
Houses for sale in Ammerdown, Frome
House Prices in Ammerdown
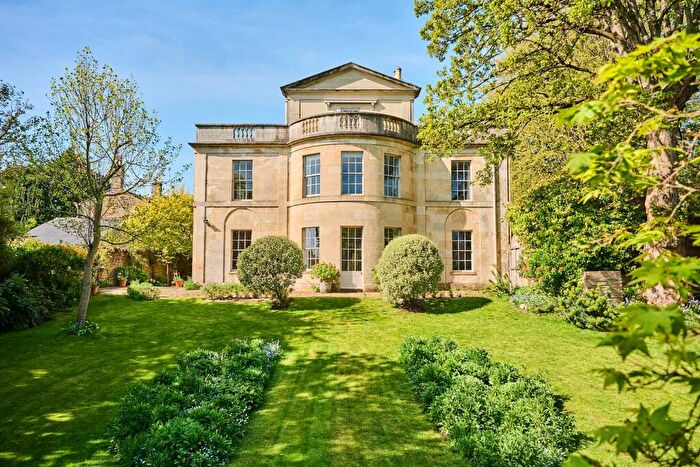
Properties in Ammerdown have an average house price of £643k and had 35 Property Transactions within the last 3 years¹.
Ammerdown is an area in Frome, Somerset with 482 households², where the most expensive property was sold for £1.8M.
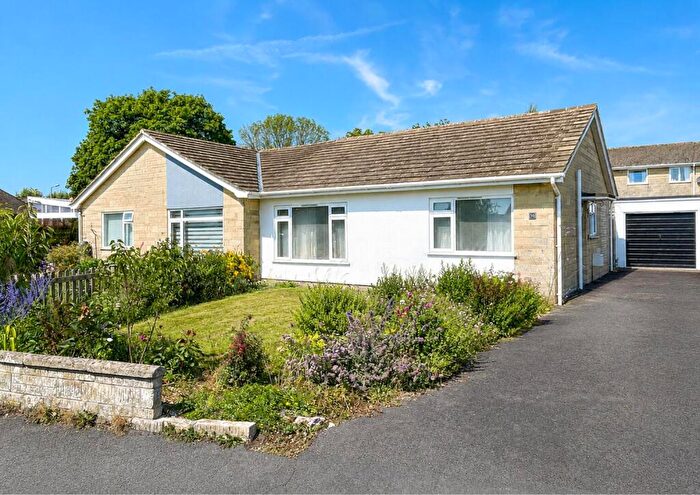
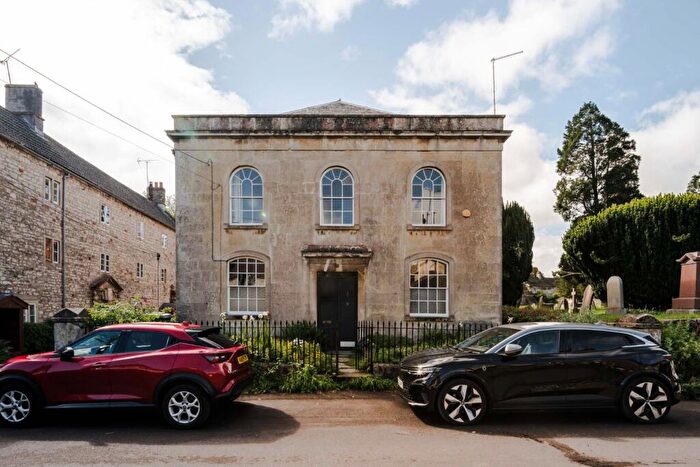
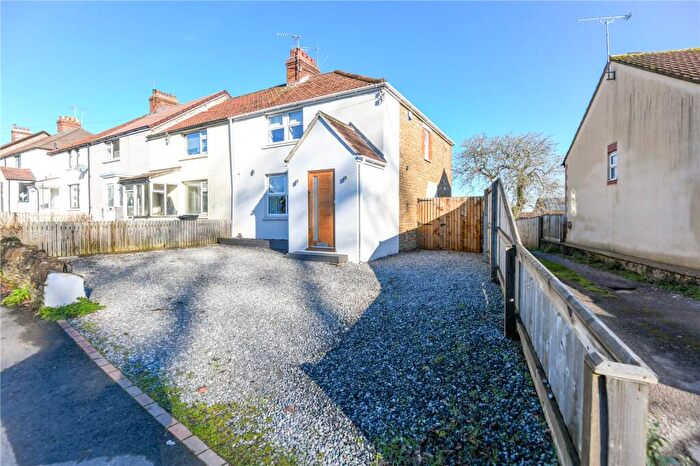
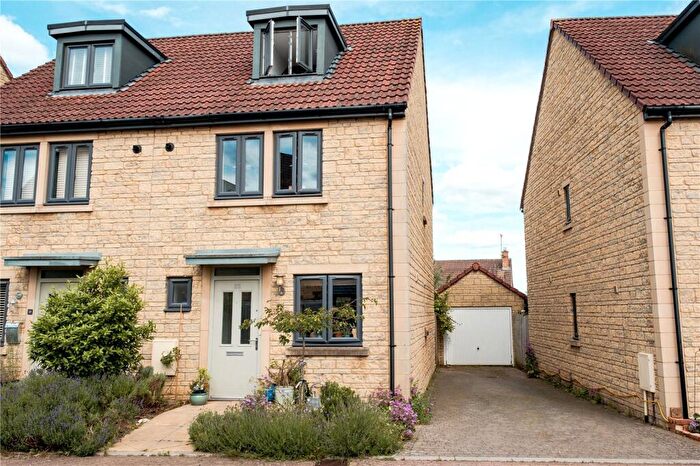
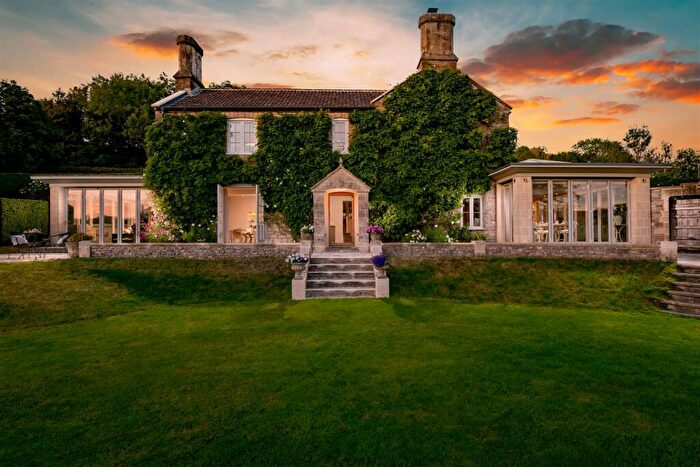
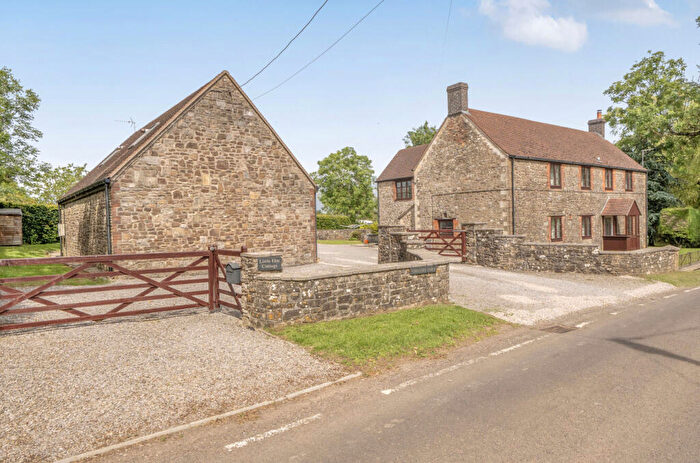
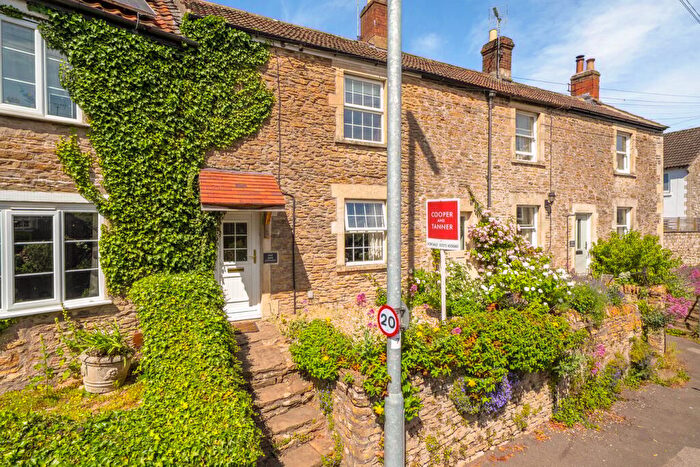
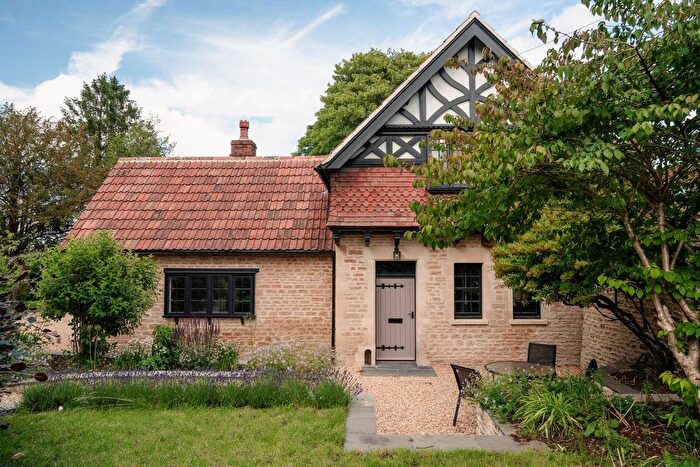
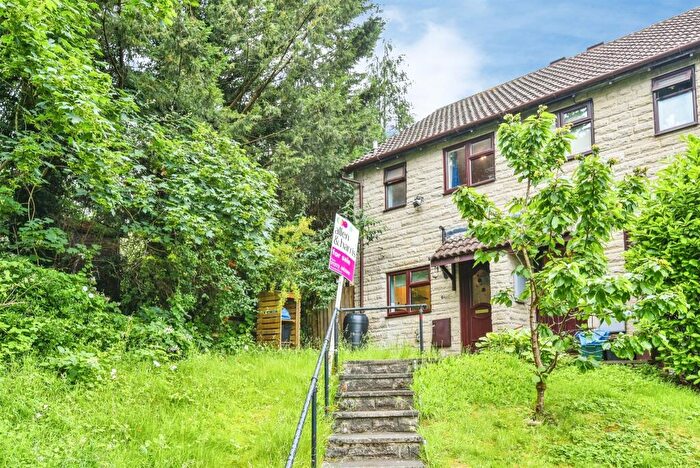
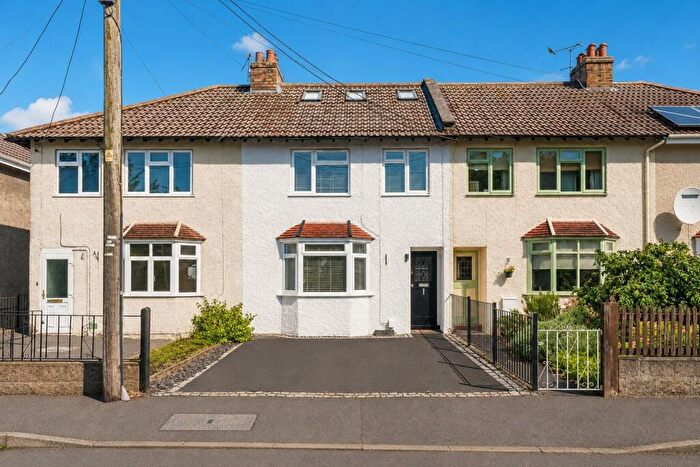
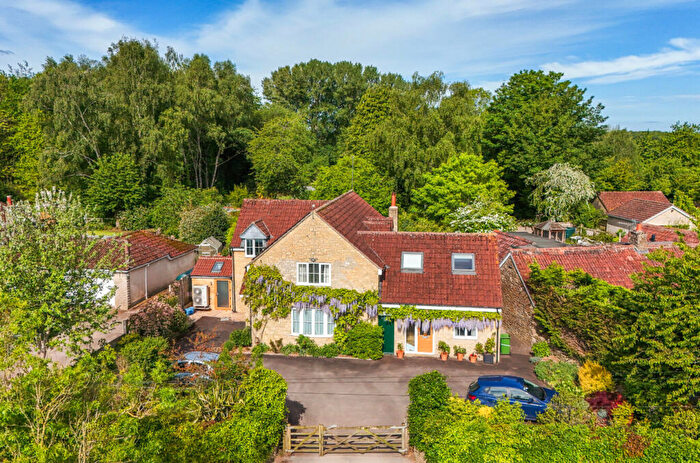
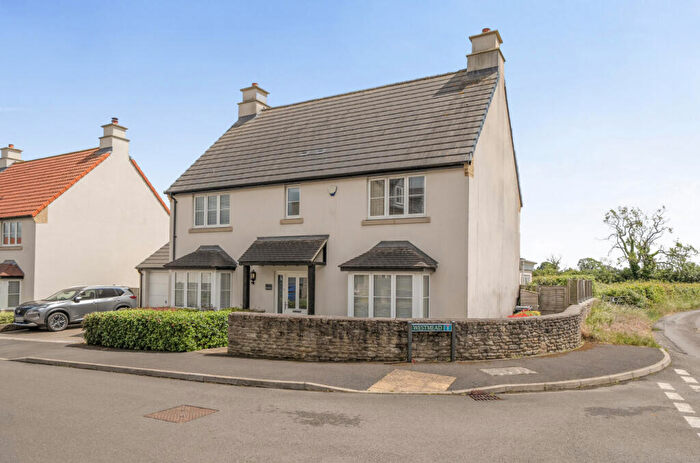
Properties for sale in Ammerdown
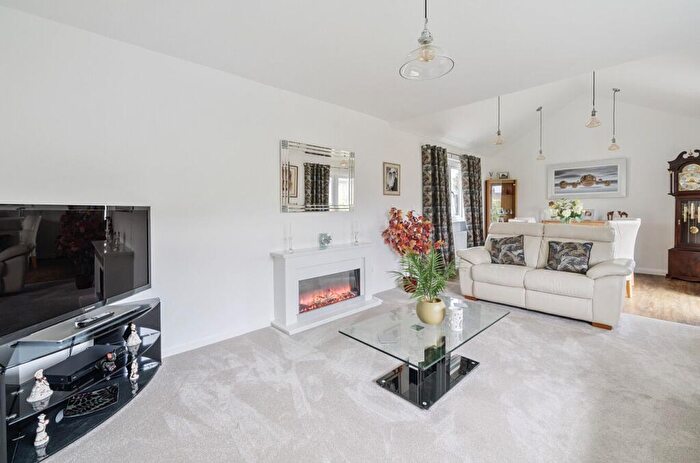
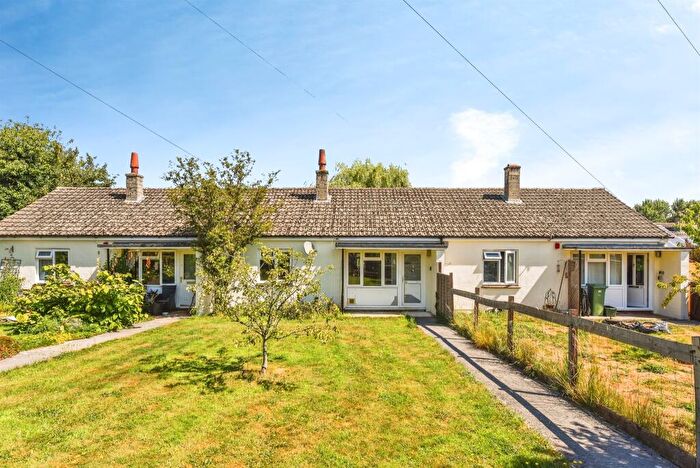
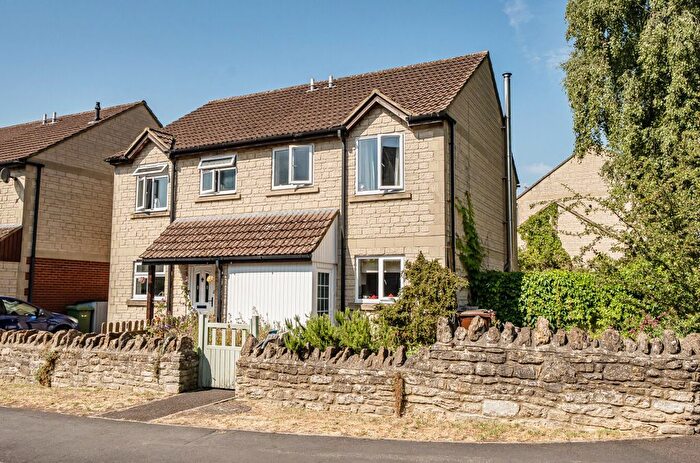
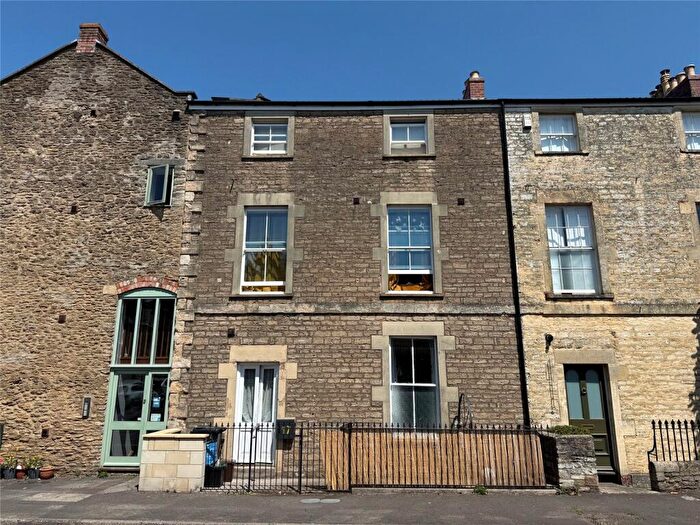
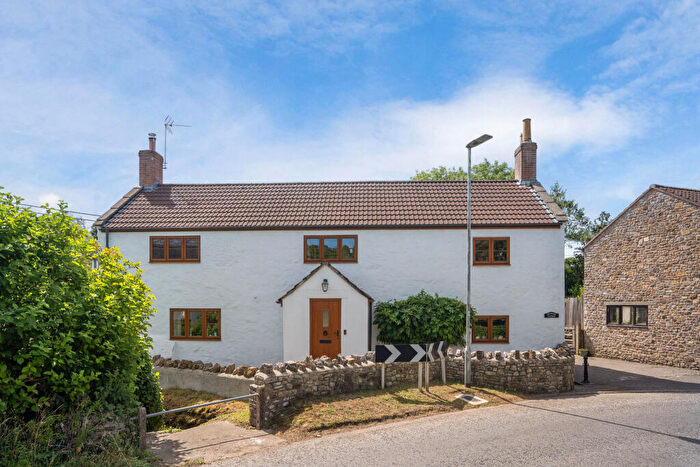
![]()
If you are looking to sell your house, let it out, or receive a property valuation, an expert can help you.
Click the button below to get started.
Roads and Postcodes in Ammerdown
Navigate through our locations to find the location of your next house in Ammerdown, Frome for sale or to rent.
Property price trends in Ammerdown
According to the latest Land Registry data, the average home in Ammerdown sold for £562,953 in 2025. That figure comes from 472 sales logged over the past 30 years.
Prices have softened over the last three years. Compared with 2022, when the typical sale came in around £586,147, that's a fall of roughly 4%.
Looking back five years, average prices are up about 58.2% since 2020, a gain of around £207,100 in cash terms.
Zoom out to the past decade for the fuller picture. Back in 2015, homes here averaged £366,647, so the typical sold price has climbed about 53.5% since then, roughly 4.4% a year. Stretch the view to fifteen years and that annual pace eases back to about 1.9%.
Frequently asked questions about Ammerdown
What is the average price for a property for sale in Ammerdown?
The average price for a property for sale in Ammerdown is £642,592. This amount is 72% higher than the average price in Frome. There are 652 property listings for sale in Ammerdown.
What streets have the most expensive properties for sale in Ammerdown?
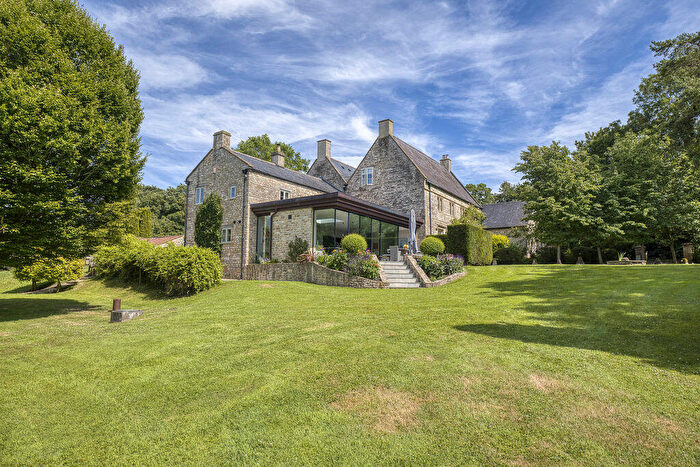
The streets with the most expensive properties for sale in Ammerdown are Hollycroft at an average of £895,000, Lower Street at an average of £679,375 and High Street at an average of £528,500.
What streets have the most affordable properties for sale in Ammerdown?
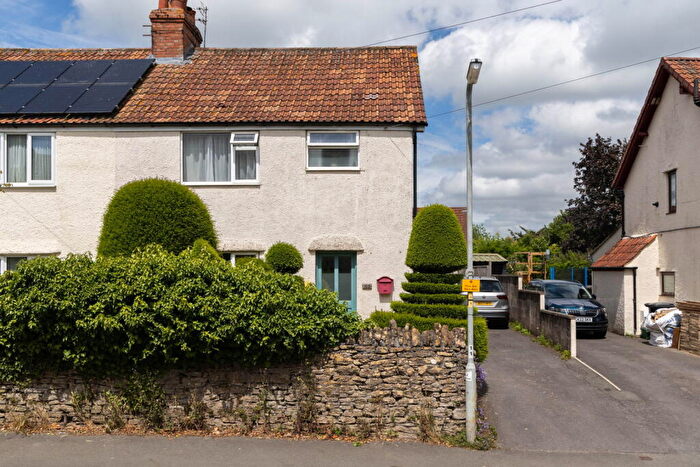
The streets with the most affordable properties for sale in Ammerdown are Longfield at an average of £278,200, Hoare's Lane at an average of £297,000 and Fairview at an average of £390,000.
Which train stations are available in or near Ammerdown?
Some of the train stations available in or near Ammerdown are Frome, Freshford and Dilton Marsh.
Property Price Paid in Ammerdown by Year
The average sold property price by year was:
| Year | Average Sold Price | Price Change |
Sold Properties
|
|---|---|---|---|
| 2025 | £562,953 | -18% |
16 Properties |
| 2024 | £661,944 | -14% |
9 Properties |
| 2023 | £752,600 | 22% |
10 Properties |
| 2022 | £586,147 | 16% |
17 Properties |
| 2021 | £491,991 | 28% |
23 Properties |
| 2020 | £355,853 | -28% |
12 Properties |
| 2019 | £457,000 | -43% |
13 Properties |
| 2018 | £652,846 | 11% |
13 Properties |
| 2017 | £583,312 | 44% |
8 Properties |
| 2016 | £327,711 | -12% |
13 Properties |
Property Price per Property Type in Ammerdown
Here you can find historic sold price data in order to help with your property search.
The average Property Paid Price for specific property types in the last three years are:
| Property Type | Average Sold Price | Sold Properties |
|---|---|---|
| Semi Detached House | £489,410.00 | 14 Semi Detached Houses |
| Detached House | £845,941.00 | 17 Detached Houses |
| Terraced House | £314,500.00 | 4 Terraced Houses |
