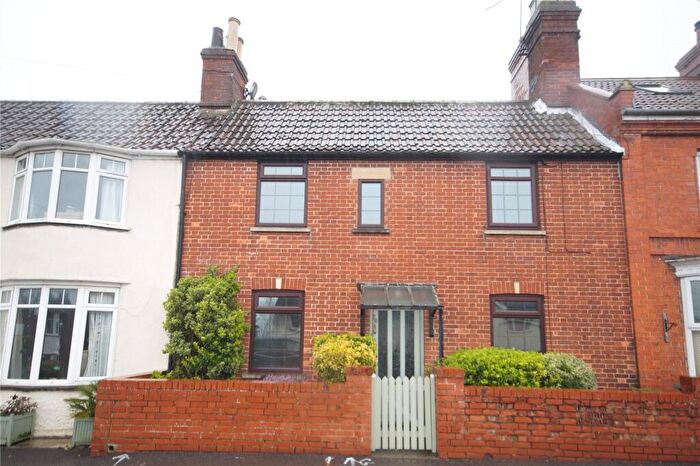
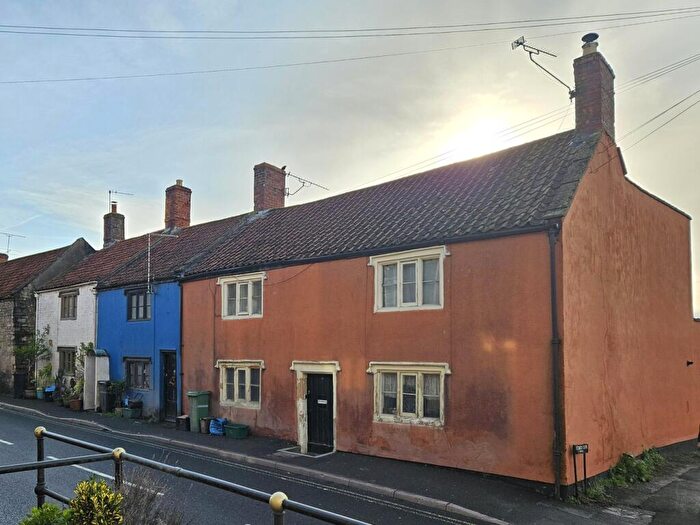
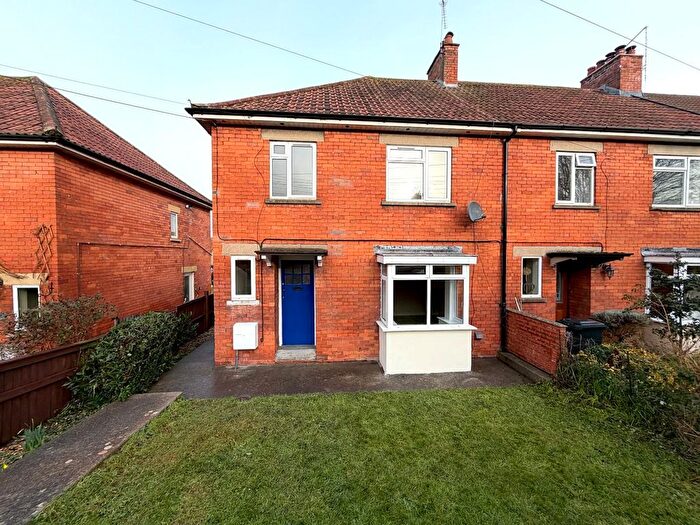
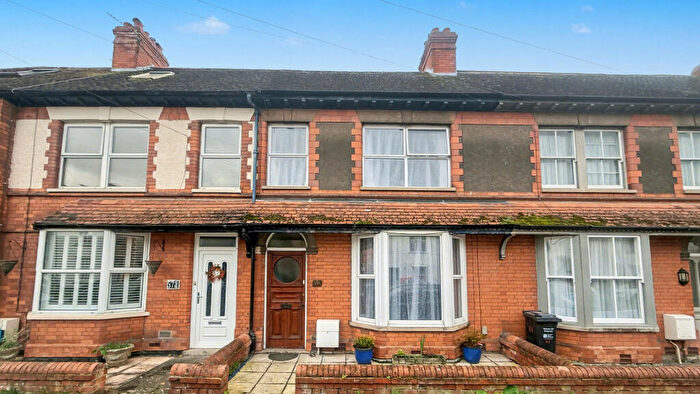
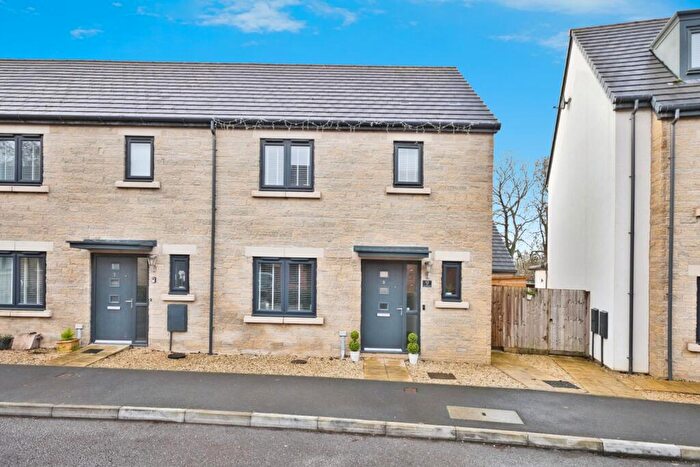
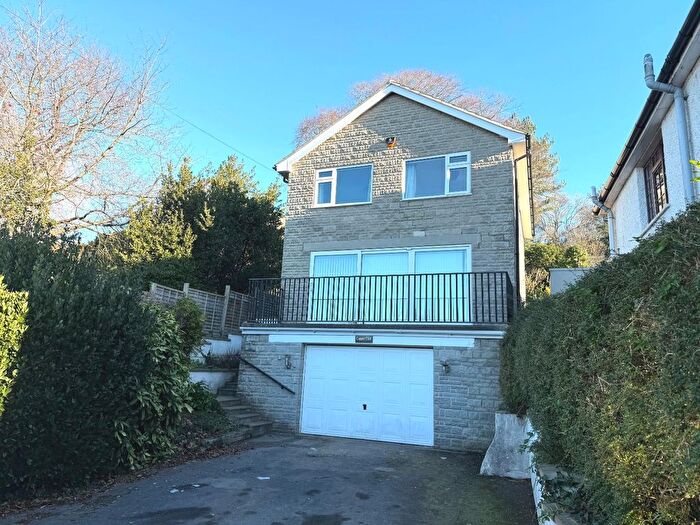
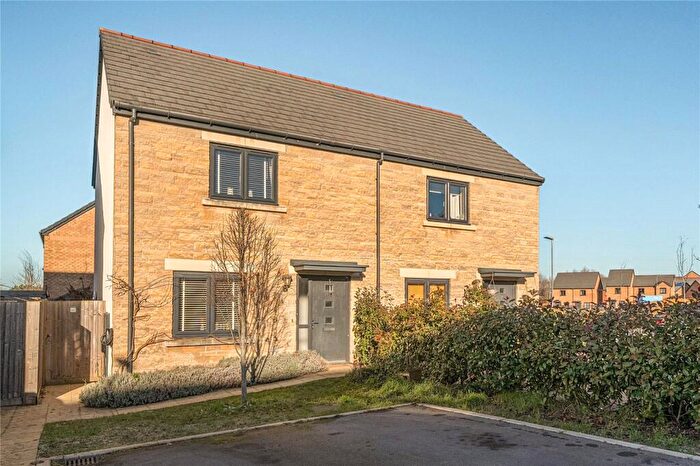
Houses for sale & to rent in Glastonbury St Edmunds, Glastonbury
House Prices in Glastonbury St Edmunds
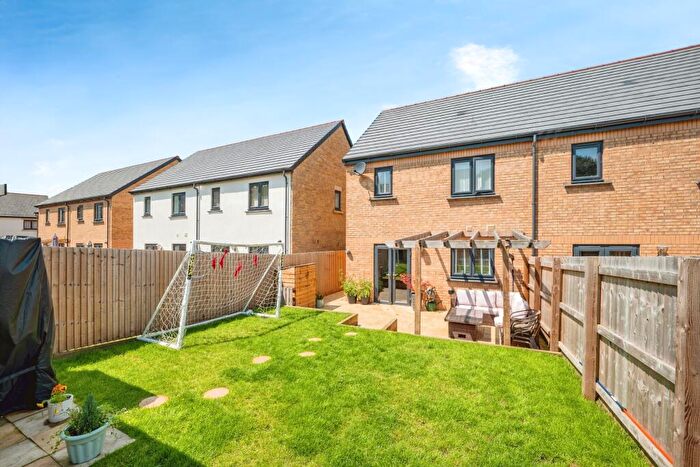
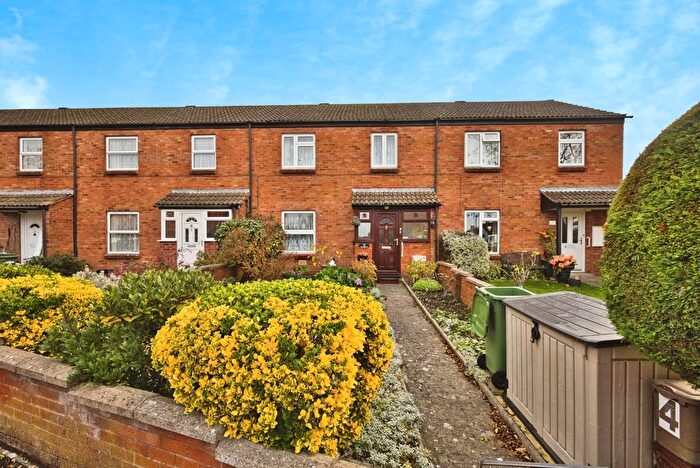
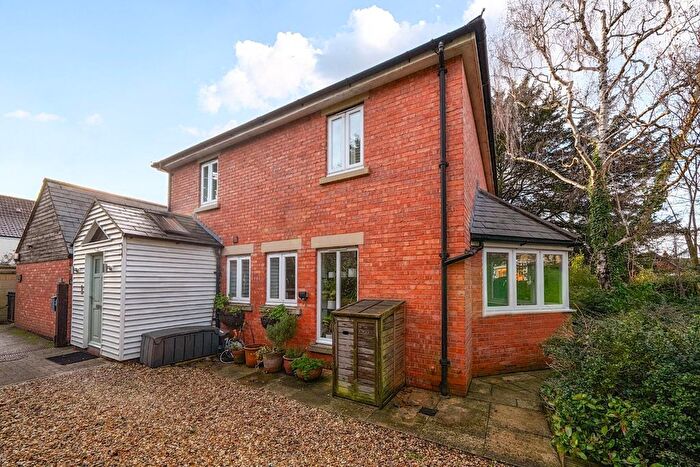
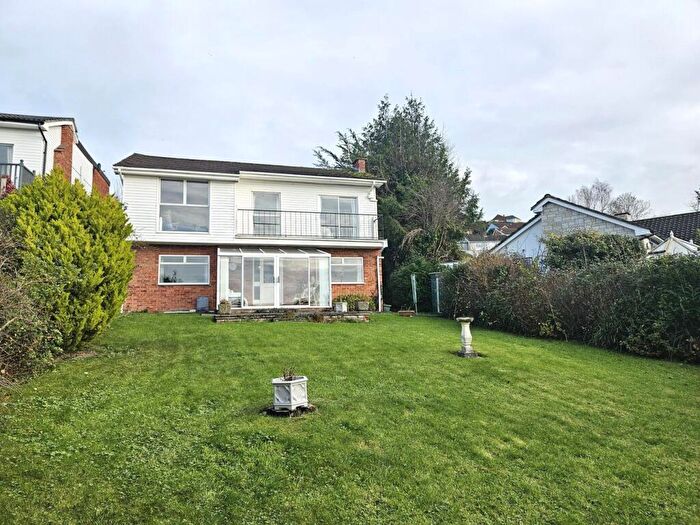
Properties in Glastonbury St Edmunds have an average house price of £365,502.09 and had 99 Property Transactions within the last 3 years¹.
Glastonbury St Edmunds is an area in Glastonbury, Somerset with 954 households², where the most expensive property was sold for £1,475,000.00.
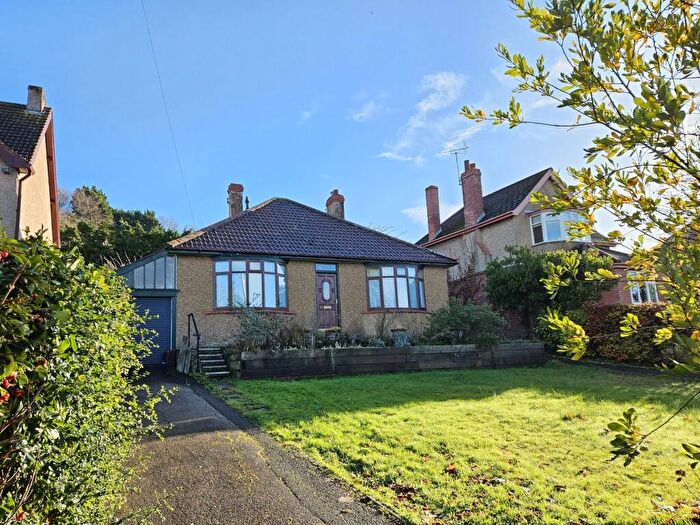
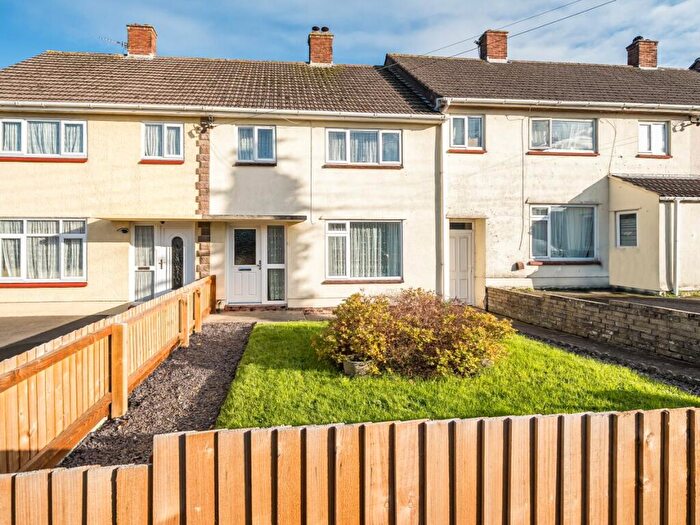
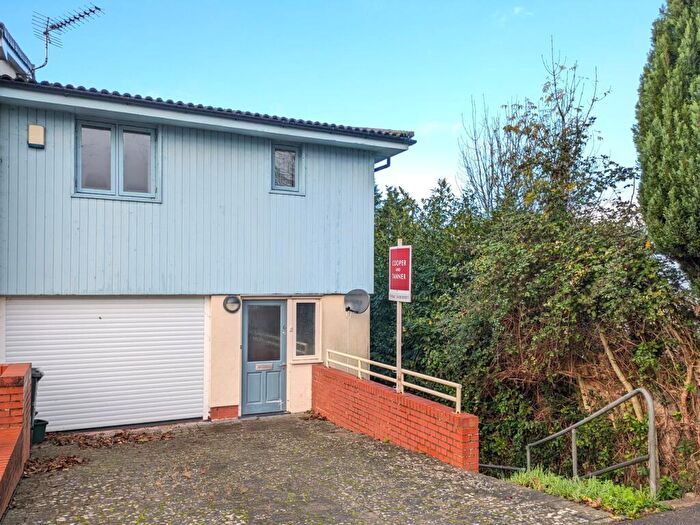
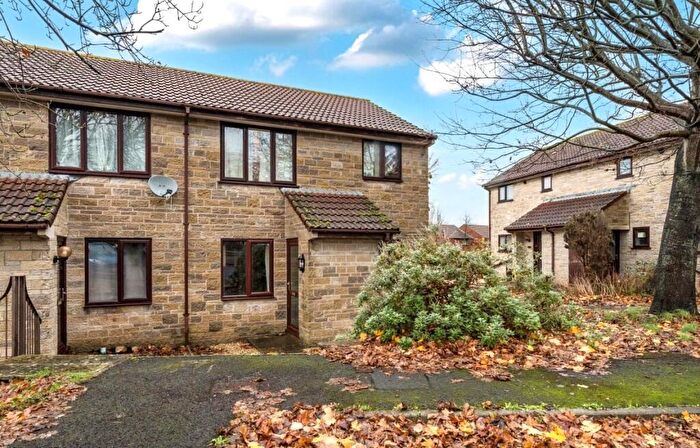
Properties for sale in Glastonbury St Edmunds
Roads and Postcodes in Glastonbury St Edmunds
Navigate through our locations to find the location of your next house in Glastonbury St Edmunds, Glastonbury for sale or to rent.
| Streets | Postcodes |
|---|---|
| Ashwell Lane | BA6 8BG |
| Bove Town | BA6 8JB BA6 8JE BA6 8JG |
| Bove Town Gardens | BA6 8FE |
| Breynton Road | BA6 8EL |
| Brindham Lane | BA6 8JX |
| Bulwarks Lane | BA6 8JL |
| Bushy Coombe Gardens | BA6 8JT |
| Chalice Hill Close | BA6 8AY |
| Chilkwell Street | BA6 8DA BA6 8DB BA6 8DD BA6 8DE BA6 8DJ BA6 8DQ BA6 8DF |
| Chinnock Road | BA6 8EW |
| Cinnamon Lane | BA6 8BN BA6 8FG |
| Coombe Terrace | BA6 8JF |
| Cottle Close | BA6 8FP |
| Coursing Batch | BA6 8BH BA6 8BQ |
| Coxwithy Lane | BA6 8FF |
| Dod Lane | BA6 8BZ |
| Dunstan Road | BA6 8EE |
| Edgarley Field Lane | BA6 8FH |
| Edgarley Road | BA6 8LA BA6 8LB BA6 8LD BA6 8LE |
| Fielding Path | BA6 8HA |
| Folliott Road | BA6 8HG |
| Gunwyn Close | BA6 8HB |
| Hamlyn Road | BA6 8HS BA6 8HT |
| Havyatt | BA6 8LF |
| Hexton Road | BA6 8HL |
| High Street | BA6 9DT |
| Jacobs Close | BA6 8EJ |
| Jocelin Road | BA6 8EN |
| Lambrook Street | BA6 8BX BA6 8BY |
| Launder Close | BA6 8AZ |
| Leg Of Mutton Road | BA6 8HH BA6 8HJ BA6 8HQ |
| Maidencroft Lane | BA6 8JP |
| Martins Lane | BA6 8LL |
| Monington Road | BA6 8HE BA6 8HF |
| Old Wells Road | BA6 8EA BA6 8EB BA6 8ED BA6 8JD |
| Park Corner | BA6 8JY |
| Ridgeway Gardens | BA6 8ER |
| Rowley Road | BA6 8HU |
| Sandpits Road | BA6 8EH |
| Selwood Road | BA6 8HN BA6 8HW |
| St Davids Close | BA6 8BP |
| Stonedown Lane | BA6 8JZ |
| Summerhouse Orchard | BA6 8JA |
| Three Hill View | BA6 8AU |
| Turstin Road | BA6 8HD |
| Wellhouse Lane | BA6 8BL BA6 8BJ |
| Wells Road | BA6 9DH BA6 9AL |
| Whiting Road | BA6 8HP BA6 8HR |
| Wick Hollow | BA6 8JJ BA6 8JQ |
| Windmill Hill Road | BA6 8EF BA6 8EG BA6 8EP BA6 8EQ |
| BA6 8JN BA6 8JR BA6 8JS BA6 8JW |
Transport near Glastonbury St Edmunds
-
Castle Cary Station
-
Bruton Station
-
Bridgwater Station
-
Highbridge and Burnham Station
-
Yeovil Pen Mill Station
- FAQ
- Price Paid By Year
- Property Type Price
Frequently asked questions about Glastonbury St Edmunds
What is the average price for a property for sale in Glastonbury St Edmunds?
The average price for a property for sale in Glastonbury St Edmunds is £365,502. This amount is 7% higher than the average price in Glastonbury. There are 640 property listings for sale in Glastonbury St Edmunds.
What streets have the most expensive properties for sale in Glastonbury St Edmunds?
The streets with the most expensive properties for sale in Glastonbury St Edmunds are Cinnamon Lane at an average of £692,500, Havyatt at an average of £619,095 and Bove Town at an average of £615,000.
What streets have the most affordable properties for sale in Glastonbury St Edmunds?
The streets with the most affordable properties for sale in Glastonbury St Edmunds are Turstin Road at an average of £152,500, Whiting Road at an average of £184,450 and Summerhouse Orchard at an average of £220,000.
Which train stations are available in or near Glastonbury St Edmunds?
Some of the train stations available in or near Glastonbury St Edmunds are Castle Cary, Bruton and Bridgwater.
Property Price Paid in Glastonbury St Edmunds by Year
The average sold property price by year was:
| Year | Average Sold Price | Price Change |
Sold Properties
|
|---|---|---|---|
| 2025 | £422,073 | 20% |
17 Properties |
| 2024 | £339,480 | -14% |
24 Properties |
| 2023 | £386,714 | 7% |
21 Properties |
| 2022 | £358,971.63 | 7% |
38 Properties |
| 2021 | £334,044 | 8% |
42 Properties |
| 2020 | £306,734 | 7% |
33 Properties |
| 2019 | £284,126 | 8% |
34 Properties |
| 2018 | £262,084.78 | -1% |
46 Properties |
| 2017 | £265,712 | -8% |
36 Properties |
| 2016 | £287,093 | 22% |
37 Properties |
| 2015 | £224,184 | 11% |
35 Properties |
| 2014 | £200,055 | -0,1% |
38 Properties |
| 2013 | £200,232 | -8% |
32 Properties |
| 2012 | £215,291 | 9% |
36 Properties |
| 2011 | £196,655 | -9% |
27 Properties |
| 2010 | £214,968 | 9% |
33 Properties |
| 2009 | £196,435 | 6% |
24 Properties |
| 2008 | £184,612 | -3% |
24 Properties |
| 2007 | £189,271 | 4% |
39 Properties |
| 2006 | £182,280 | -10% |
56 Properties |
| 2005 | £201,359 | 4% |
36 Properties |
| 2004 | £193,466 | 11% |
51 Properties |
| 2003 | £171,990 | 21% |
50 Properties |
| 2002 | £136,326 | 17% |
40 Properties |
| 2001 | £113,765 | 21% |
55 Properties |
| 2000 | £89,535 | 6% |
41 Properties |
| 1999 | £84,436 | 2% |
59 Properties |
| 1998 | £82,545 | 12% |
57 Properties |
| 1997 | £72,769 | 5% |
44 Properties |
| 1996 | £69,389 | 18% |
26 Properties |
| 1995 | £56,737 | - |
25 Properties |
Property Price per Property Type in Glastonbury St Edmunds
Here you can find historic sold price data in order to help with your property search.
The average Property Paid Price for specific property types in the last three years are:
| Property Type | Average Sold Price | Sold Properties |
|---|---|---|
| Semi Detached House | £268,824.00 | 31 Semi Detached Houses |
| Detached House | £539,509.00 | 37 Detached Houses |
| Terraced House | £278,895.00 | 24 Terraced Houses |
| Flat | £170,828.00 | 7 Flats |

