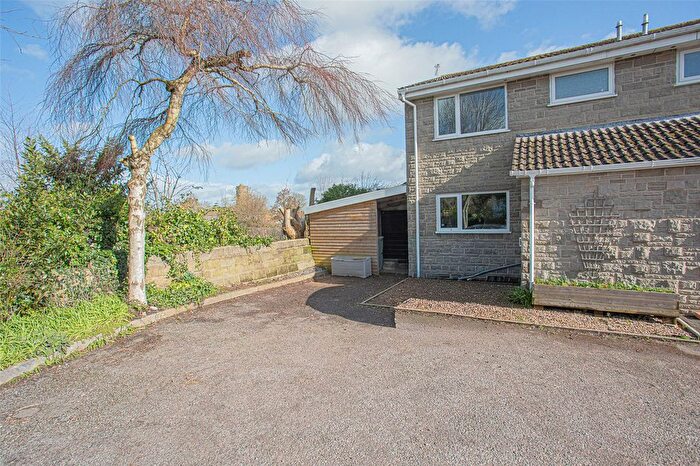
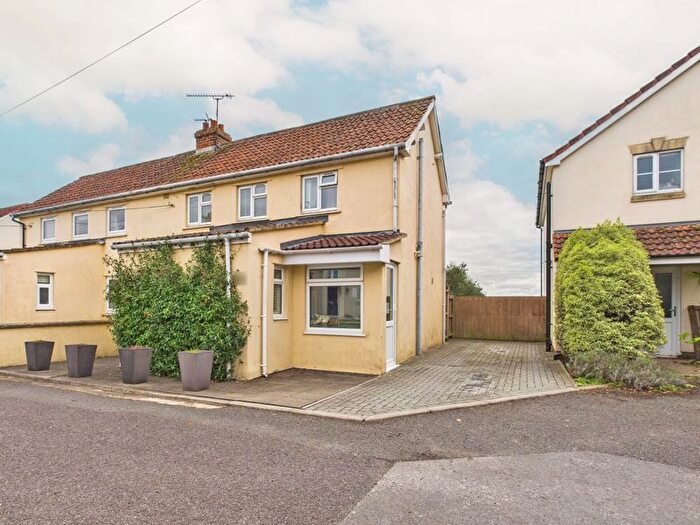
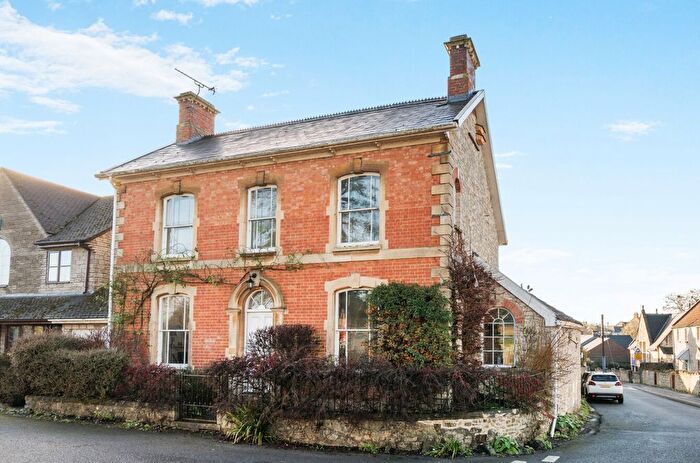
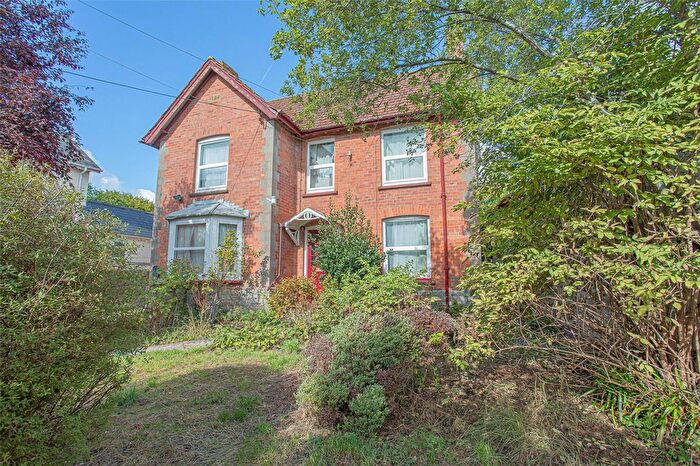
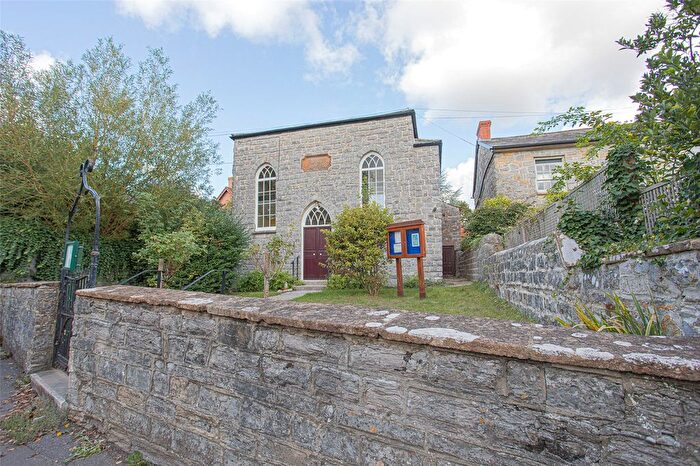
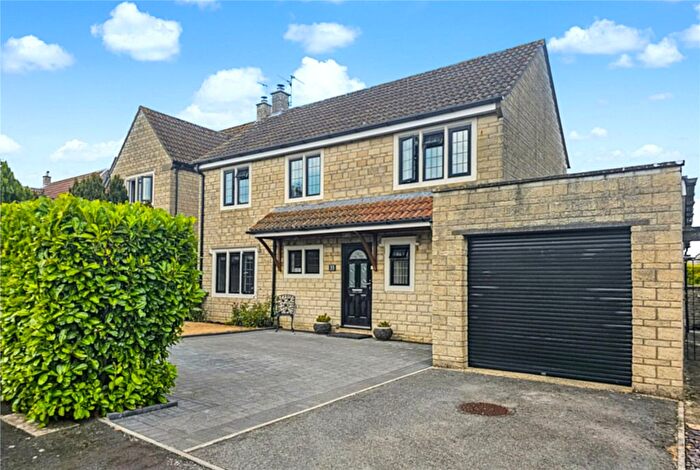
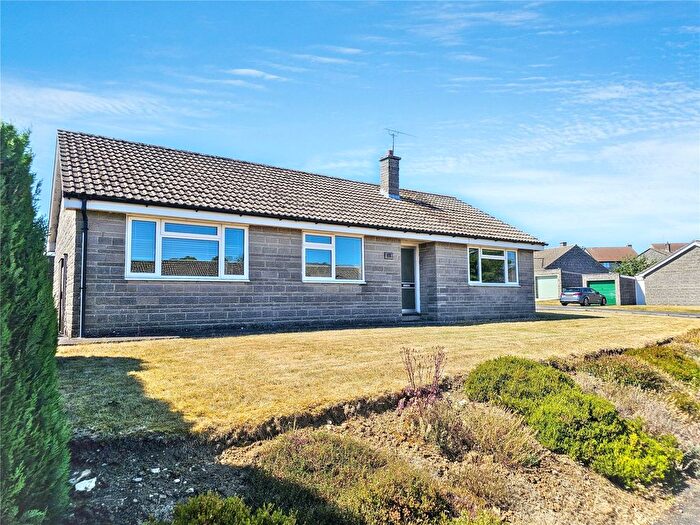
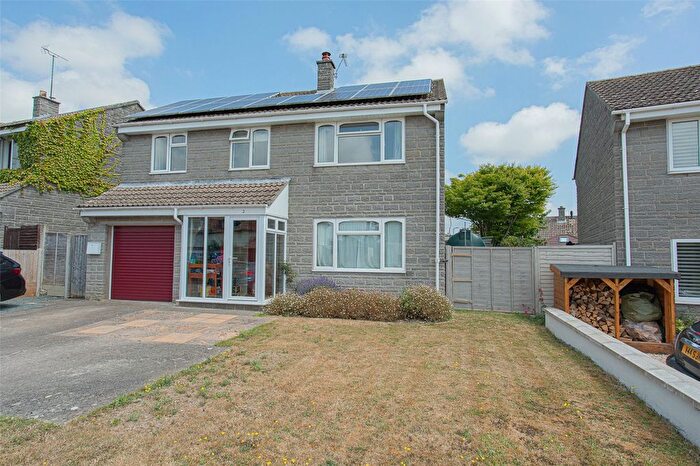
Houses for sale & to rent in Curry Rivel, Langport
House Prices in Curry Rivel
Properties in Curry Rivel have an average house price of £389,156.00 and had 111 Property Transactions within the last 3 years¹.
Curry Rivel is an area in Langport, Somerset with 1,042 households², where the most expensive property was sold for £1,425,000.00.
Properties for sale in Curry Rivel
Previously listed properties in Curry Rivel
Roads and Postcodes in Curry Rivel
Navigate through our locations to find the location of your next house in Curry Rivel, Langport for sale or to rent.
| Streets | Postcodes |
|---|---|
| Abbey Close | TA10 0EL |
| Abbey Fields | TA10 0DY |
| Back Lane | TA10 0NY |
| Bawlers Lane | TA10 0HA |
| Bell Orchard | TA10 0EG |
| Blackdown View | TA10 0ER |
| Brickwall Lane | TA10 0NX |
| Burton Close | TA10 0AF |
| Chatham Place | TA10 0HR TA10 0HS |
| Chatham Rise | TA10 0JG |
| Church Street | TA10 0JY |
| Churchway | TA10 0EF |
| Churchway Close | TA10 0ED |
| Croftland Lane | TA10 0LP |
| Currywoods Way | TA10 0NT |
| Dyers Close | TA10 0PX |
| Dyers Road | TA10 0PR |
| East Street | TA10 0JZ TA10 0LA TA10 0LB |
| Furlong Lane | TA10 0JA |
| Heale | TA10 0PL TA10 0PN |
| Heale Lane | TA10 0PG TA10 0PQ |
| High Street | TA10 0ES TA10 0ET TA10 0EY |
| Hillside Close | TA10 0EZ |
| Holdens Way | TA10 0JL |
| Honeylands | TA10 0EH TA10 0EJ TA10 0EP |
| Hoskins Close | TA10 0JQ |
| King William Lane | TA10 0HB |
| King William Mews | TA10 0HD |
| Law Lane | TA10 0LS |
| Lower Wiltown | TA10 0AD |
| Midelney Road | TA10 0LW |
| Moortown Lane | TA10 0AA |
| Mount Terrace | TA10 0EU |
| North Street | TA10 0LD TA10 0LE TA10 0LF TA10 0LG TA10 0LQ |
| Old Stream Farm | TA10 0LN |
| Parsonage Place | TA10 0EW |
| Peel Barton Lane | TA10 0HL |
| Pitt Court | TA10 0PF |
| Portway | TA10 0NQ |
| Red Hill | TA10 0PH |
| Sandpitts Hill | TA10 0NG |
| School Street | TA10 0LH TA10 0LJ TA10 0LL |
| St Andrews Close | TA10 0NS |
| Stanchester | TA10 0EA TA10 0EB |
| Stanchester Mews | TA10 0DU |
| Stanchester Way | TA10 0PS TA10 0PU |
| Stoney Lane | TA10 0HY |
| Stoneyhurst Drive | TA10 0JH |
| The Green | TA10 0HF |
| Townsend | TA10 0HN TA10 0HP TA10 0HT TA10 0HU TA10 0HW TA10 0PA |
| Vickery Close | TA10 0PY |
| Water Street | TA10 0HH |
| Westfield | TA10 0HX |
| Wiltown | TA10 0HZ TA10 0JE TA10 0JF TA10 0NZ |
| TA10 0DZ TA10 0EE TA10 0EN TA10 0HG TA10 0HQ TA10 0JB TA10 0JU TA10 0JX TA10 0LT TA10 0LU TA10 0ND TA10 0NJ TA10 0NL TA10 0NN TA10 0NP TA10 0NW TA10 0PW |
Transport near Curry Rivel
-
Bridgwater Station
-
Taunton Station
-
Crewkerne Station
-
Yeovil Pen Mill Station
-
Yeovil Junction Station
-
Highbridge and Burnham Station
-
Thornford Station
- FAQ
- Price Paid By Year
- Property Type Price
Frequently asked questions about Curry Rivel
What is the average price for a property for sale in Curry Rivel?
The average price for a property for sale in Curry Rivel is £389,156. This amount is 2% lower than the average price in Langport. There are 324 property listings for sale in Curry Rivel.
What streets have the most expensive properties for sale in Curry Rivel?
The streets with the most expensive properties for sale in Curry Rivel are Sandpitts Hill at an average of £766,666, Pitt Court at an average of £715,000 and Stoney Lane at an average of £695,000.
What streets have the most affordable properties for sale in Curry Rivel?
The streets with the most affordable properties for sale in Curry Rivel are Westfield at an average of £183,500, Chatham Place at an average of £236,666 and Chatham Rise at an average of £245,000.
Which train stations are available in or near Curry Rivel?
Some of the train stations available in or near Curry Rivel are Bridgwater, Taunton and Crewkerne.
Property Price Paid in Curry Rivel by Year
The average sold property price by year was:
| Year | Average Sold Price | Price Change |
Sold Properties
|
|---|---|---|---|
| 2025 | £394,458 | 5% |
36 Properties |
| 2024 | £376,434 | -6% |
40 Properties |
| 2023 | £398,242 | 4% |
35 Properties |
| 2022 | £380,717 | 8% |
44 Properties |
| 2021 | £350,711 | 10% |
52 Properties |
| 2020 | £315,827 | 10% |
43 Properties |
| 2019 | £283,873 | -19% |
43 Properties |
| 2018 | £339,156 | -1% |
38 Properties |
| 2017 | £342,753 | 8% |
36 Properties |
| 2016 | £316,334 | 18% |
55 Properties |
| 2015 | £258,223 | 2% |
51 Properties |
| 2014 | £253,638 | -1% |
52 Properties |
| 2013 | £256,041 | 13% |
41 Properties |
| 2012 | £222,512 | -16% |
36 Properties |
| 2011 | £258,170 | -5% |
29 Properties |
| 2010 | £271,251 | 15% |
35 Properties |
| 2009 | £229,690 | -22% |
31 Properties |
| 2008 | £280,367 | 6% |
33 Properties |
| 2007 | £263,787 | 7% |
62 Properties |
| 2006 | £246,220 | 13% |
49 Properties |
| 2005 | £213,831 | -26% |
49 Properties |
| 2004 | £269,178 | 25% |
53 Properties |
| 2003 | £202,107 | 3% |
38 Properties |
| 2002 | £195,566 | 17% |
61 Properties |
| 2001 | £163,291 | 8% |
57 Properties |
| 2000 | £149,987 | 24% |
40 Properties |
| 1999 | £113,792 | 6% |
64 Properties |
| 1998 | £106,424 | 6% |
29 Properties |
| 1997 | £100,385 | 21% |
58 Properties |
| 1996 | £78,903 | 1% |
51 Properties |
| 1995 | £78,143 | - |
47 Properties |
Property Price per Property Type in Curry Rivel
Here you can find historic sold price data in order to help with your property search.
The average Property Paid Price for specific property types in the last three years are:
| Property Type | Average Sold Price | Sold Properties |
|---|---|---|
| Semi Detached House | £309,714.00 | 30 Semi Detached Houses |
| Detached House | £447,381.00 | 68 Detached Houses |
| Terraced House | £363,625.00 | 8 Terraced Houses |
| Flat | £114,800.00 | 5 Flats |

