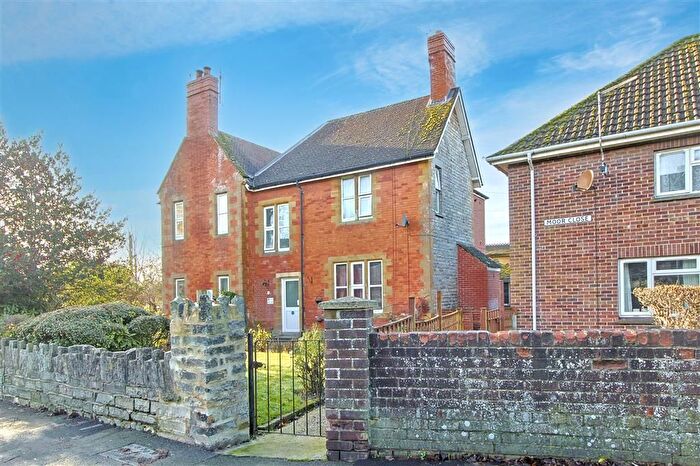
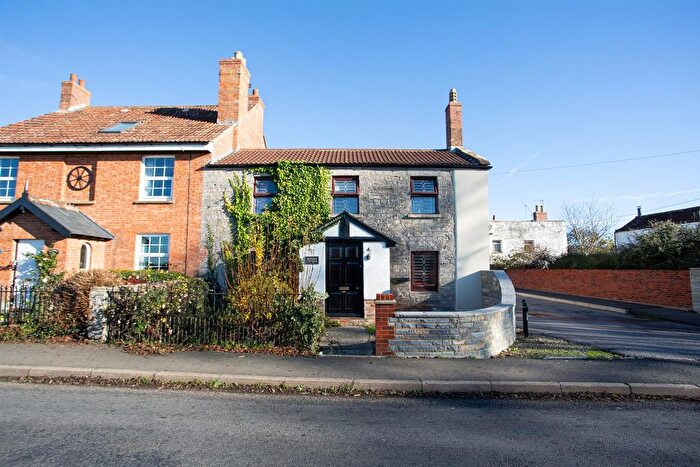
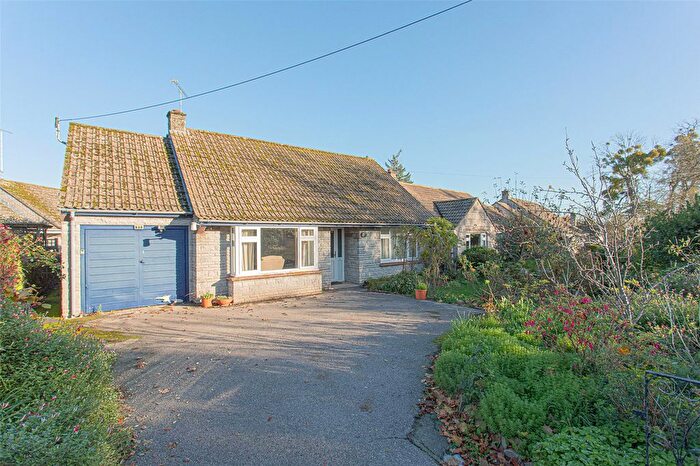
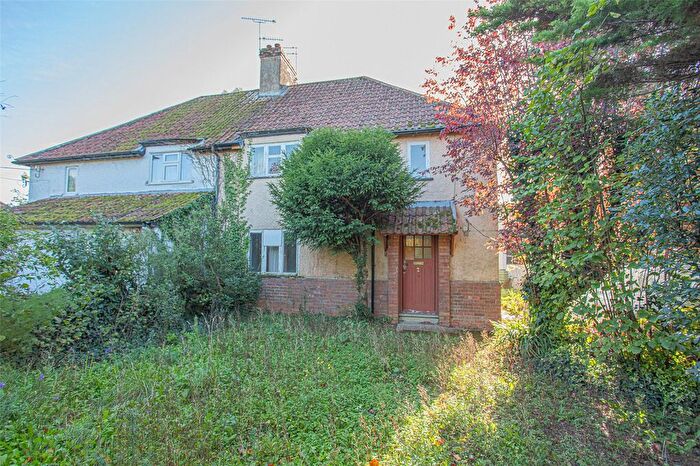
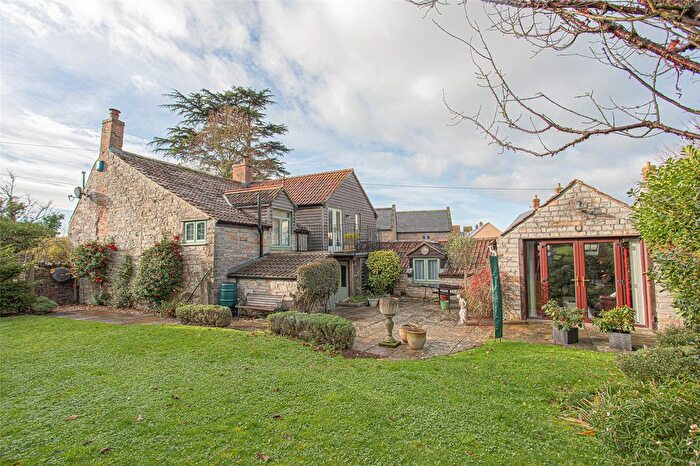
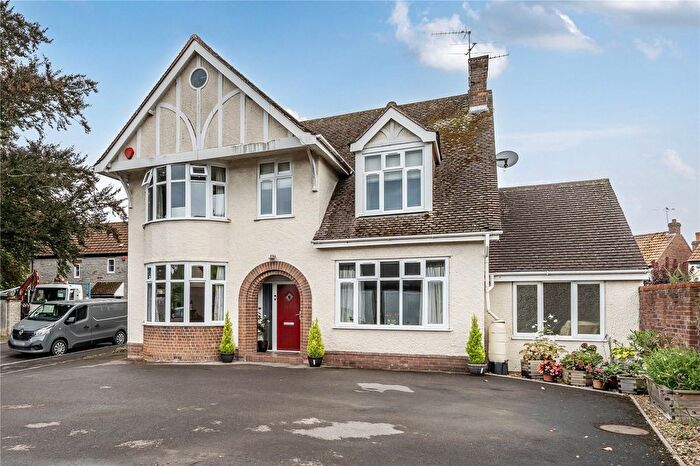
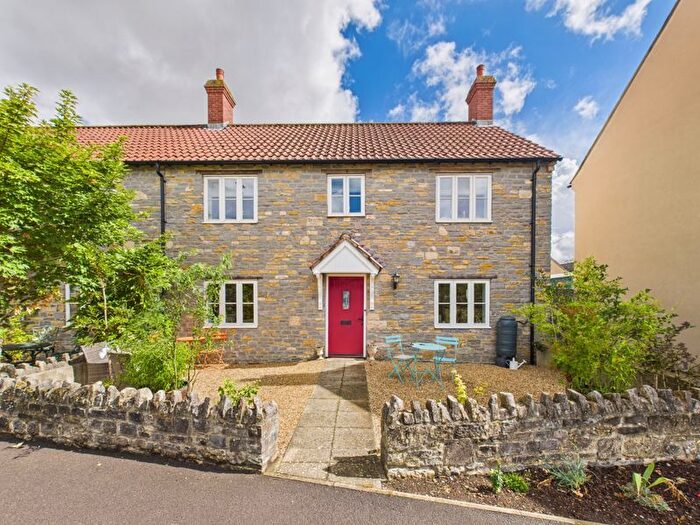
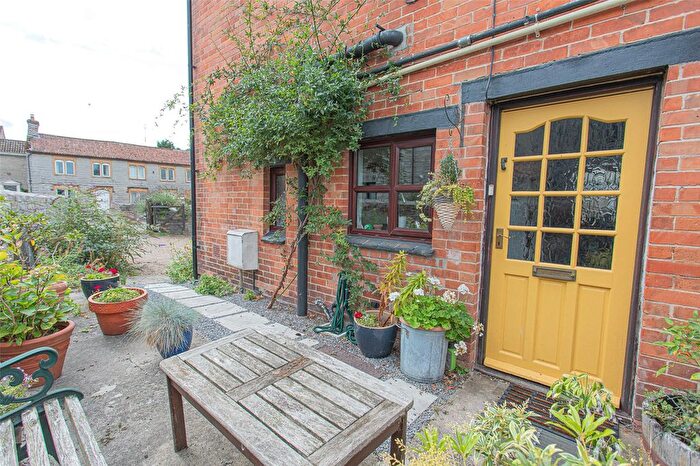
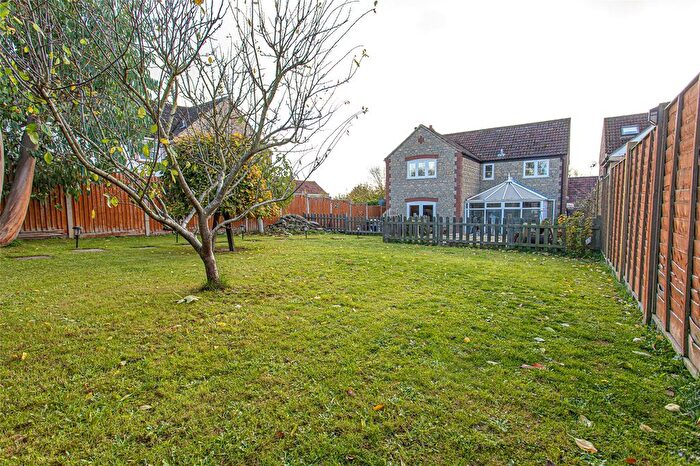
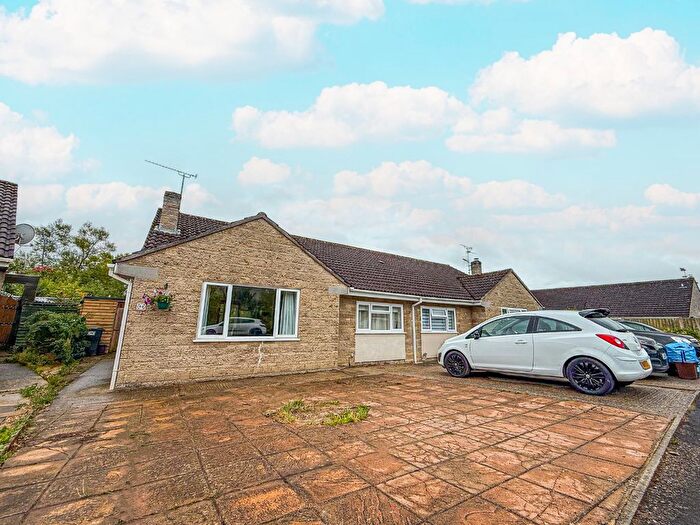
Houses for sale & to rent in Langport And Huish, Langport
House Prices in Langport And Huish
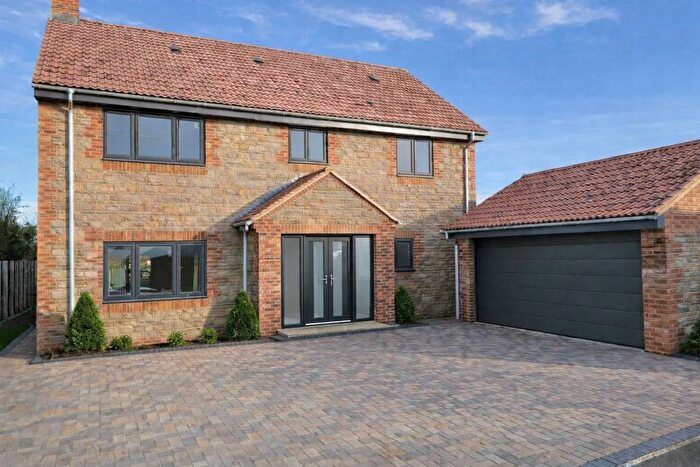
Properties in Langport And Huish have an average house price of £294,390.00 and had 128 Property Transactions within the last 3 years¹.
Langport And Huish is an area in Langport, Somerset with 1,213 households², where the most expensive property was sold for £1,240,000.00.
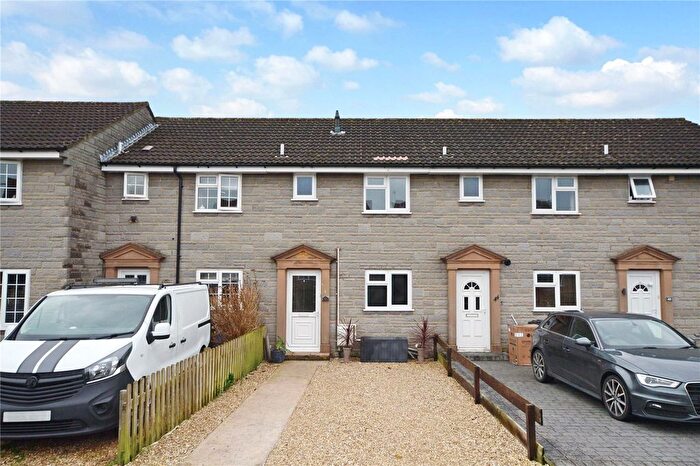
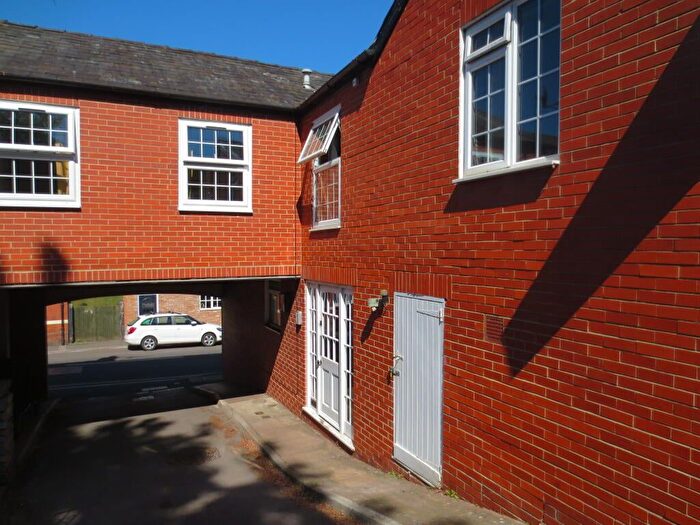
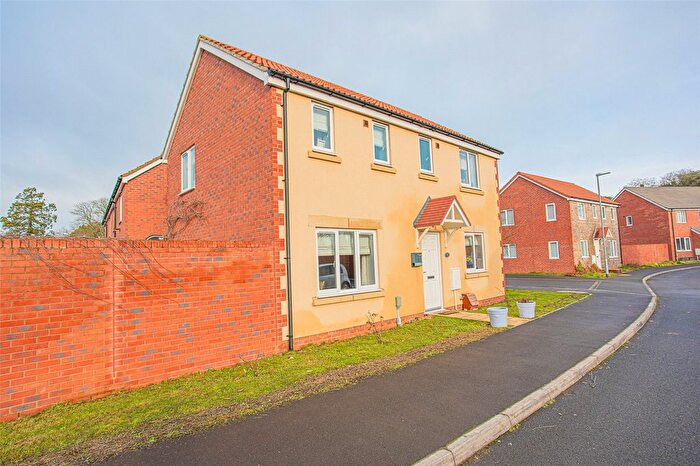
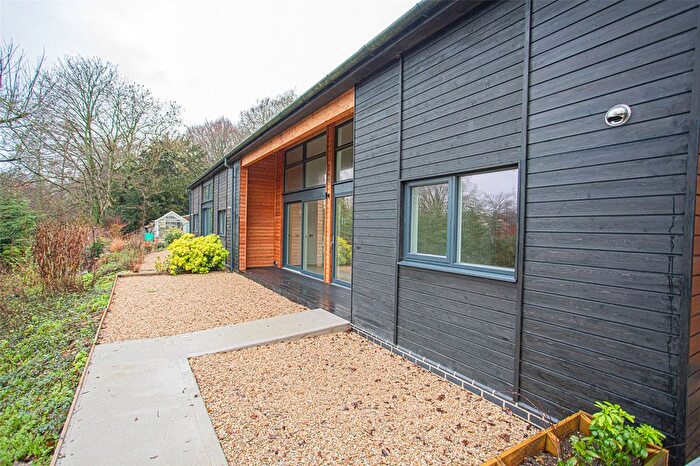
Properties for sale in Langport And Huish
Previously listed properties in Langport And Huish
Roads and Postcodes in Langport And Huish
Navigate through our locations to find the location of your next house in Langport And Huish, Langport for sale or to rent.
| Streets | Postcodes |
|---|---|
| Barrymore Close | TA10 9TB TA10 9TD |
| Bartletts Elm | TA10 9BF TA10 9BS |
| Bishops Drive | TA10 9HW |
| Bonds Pool | TA10 9QJ |
| Bow Street | TA10 9PH TA10 9PJ TA10 9PQ TA10 9PR TA10 9PS |
| Broadmeads | TA10 9RJ |
| Brookland Road | TA10 9SZ TA10 9TA TA10 9TE TA10 9TH |
| Bush Place | TA10 9PP |
| Cheapside | TA10 9PD TA10 9PW |
| Courtfield | TA10 9QS |
| Ducks Hill | TA10 9EN |
| Eastover | TA10 9BP TA10 9RX TA10 9RY |
| Eastover Close | TA10 9RS |
| Fern Road | TA10 9BU |
| Field Road | TA10 9SR TA10 9SW |
| Four Seasons Mews | TA10 9PT |
| Garden City | TA10 9ST TA10 9SU TA10 9SX |
| Great Bow Yard | TA10 9PN |
| Harveys Court | TA10 9QE |
| Huish Lea | TA10 9RF |
| Kennel Lane | TA10 9SB TA10 9SS |
| Level View | TA10 9NU |
| Maple Road | TA10 9TQ |
| Meadow Close | TA10 9SH |
| Moor Close | TA10 9RR |
| Moor Park | TA10 9PX |
| Newtown | TA10 9SE |
| Newtown Park | TA10 9TF |
| North Street | TA10 9RH TA10 9RL TA10 9RQ |
| Old Chapel Court | TA10 9RN |
| Old Market Square | TA10 9RP |
| Orchard Vale | TA10 9QW |
| Park Lane | TA10 0NF |
| Parsonage Close | TA10 9HN |
| Portland Road | TA10 9QX |
| Priests Lane | TA10 9QA |
| Somerton Road | TA10 9SG TA10 9SY |
| St Gildas Close | TA10 9QH |
| St Marys Park | TA10 9HD TA10 9HL |
| Sycamore Drive | TA10 9TL |
| Tengore End | TA10 9ET |
| The Avenue | TA10 9SA |
| The Beeches | TA10 9TU |
| The Embankment | TA10 9RZ |
| The Firs | TA10 9UA |
| The Hill | TA10 9PU TA10 9QB TA10 9QD TA10 9QF TA10 9QL TA10 9QN |
| Wagg Drove | TA10 9ER |
| Walnut Road | TA10 9TG |
| Whatley | TA10 9RA |
| Whatley Lane | TA10 9QZ |
| Willow Close | TA10 9TJ |
| Windmill Lane | TA10 9EW |
| TA10 9EJ TA10 9EP TA10 9HE TA10 9HH TA10 9HQ TA10 9QP TA10 9QT TA10 9QU TA10 9QY |
Transport near Langport And Huish
-
Bridgwater Station
-
Yeovil Pen Mill Station
-
Crewkerne Station
-
Yeovil Junction Station
-
Taunton Station
-
Castle Cary Station
-
Thornford Station
-
Highbridge and Burnham Station
-
Yetminster Station
-
Sherborne Station
- FAQ
- Price Paid By Year
- Property Type Price
Frequently asked questions about Langport And Huish
What is the average price for a property for sale in Langport And Huish?
The average price for a property for sale in Langport And Huish is £294,390. This amount is 25% lower than the average price in Langport. There are 333 property listings for sale in Langport And Huish.
What streets have the most expensive properties for sale in Langport And Huish?
The streets with the most expensive properties for sale in Langport And Huish are Level View at an average of £585,000, Kennel Lane at an average of £473,000 and St Gildas Close at an average of £445,666.
What streets have the most affordable properties for sale in Langport And Huish?
The streets with the most affordable properties for sale in Langport And Huish are Moor Close at an average of £129,166, Eastover at an average of £151,250 and Bartletts Elm at an average of £188,403.
Which train stations are available in or near Langport And Huish?
Some of the train stations available in or near Langport And Huish are Bridgwater, Yeovil Pen Mill and Crewkerne.
Property Price Paid in Langport And Huish by Year
The average sold property price by year was:
| Year | Average Sold Price | Price Change |
Sold Properties
|
|---|---|---|---|
| 2025 | £283,861 | -0,1% |
45 Properties |
| 2024 | £284,164 | -13% |
47 Properties |
| 2023 | £320,901 | 11% |
36 Properties |
| 2022 | £286,528 | -1% |
56 Properties |
| 2021 | £290,662 | 14% |
82 Properties |
| 2020 | £248,689 | 6% |
58 Properties |
| 2019 | £232,937 | 3% |
65 Properties |
| 2018 | £225,771 | -9% |
54 Properties |
| 2017 | £246,979 | 15% |
60 Properties |
| 2016 | £210,589 | 3% |
60 Properties |
| 2015 | £204,085 | 9% |
69 Properties |
| 2014 | £185,266 | -2% |
63 Properties |
| 2013 | £188,333 | 4% |
63 Properties |
| 2012 | £180,119 | 9% |
34 Properties |
| 2011 | £164,191 | -7% |
45 Properties |
| 2010 | £175,095 | 14% |
42 Properties |
| 2009 | £150,516 | -22% |
31 Properties |
| 2008 | £184,358 | -12% |
39 Properties |
| 2007 | £206,277 | 11% |
92 Properties |
| 2006 | £182,769 | 3% |
95 Properties |
| 2005 | £177,864 | -2% |
46 Properties |
| 2004 | £181,623 | 19% |
56 Properties |
| 2003 | £147,391 | 8% |
52 Properties |
| 2002 | £134,942 | 22% |
71 Properties |
| 2001 | £105,690 | 23% |
83 Properties |
| 2000 | £81,543 | 5% |
61 Properties |
| 1999 | £77,192 | 8% |
75 Properties |
| 1998 | £71,303 | 23% |
52 Properties |
| 1997 | £54,863 | 2% |
76 Properties |
| 1996 | £53,947 | 4% |
60 Properties |
| 1995 | £51,733 | - |
42 Properties |
Property Price per Property Type in Langport And Huish
Here you can find historic sold price data in order to help with your property search.
The average Property Paid Price for specific property types in the last three years are:
| Property Type | Average Sold Price | Sold Properties |
|---|---|---|
| Semi Detached House | £290,902.00 | 44 Semi Detached Houses |
| Detached House | £435,960.00 | 38 Detached Houses |
| Terraced House | £238,023.00 | 21 Terraced Houses |
| Flat | £132,690.00 | 25 Flats |

