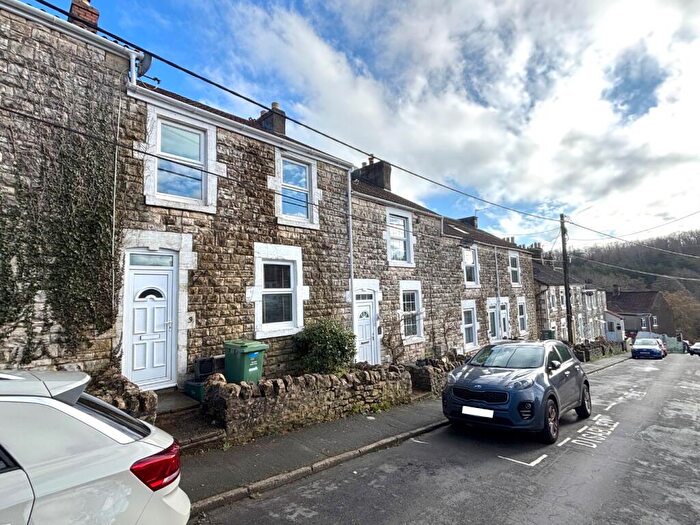
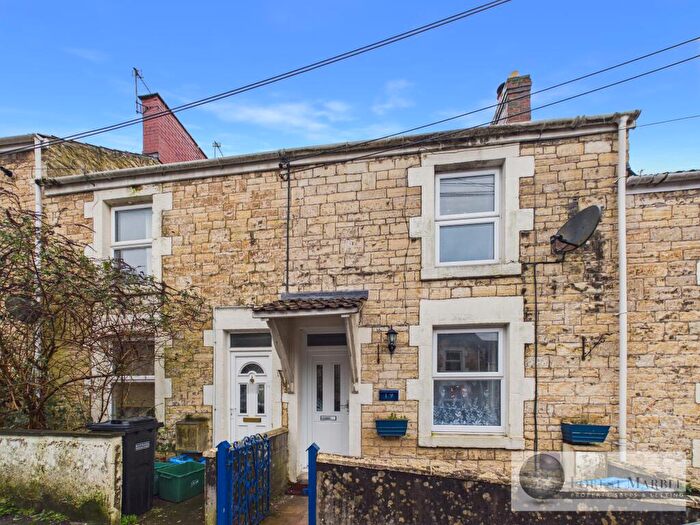
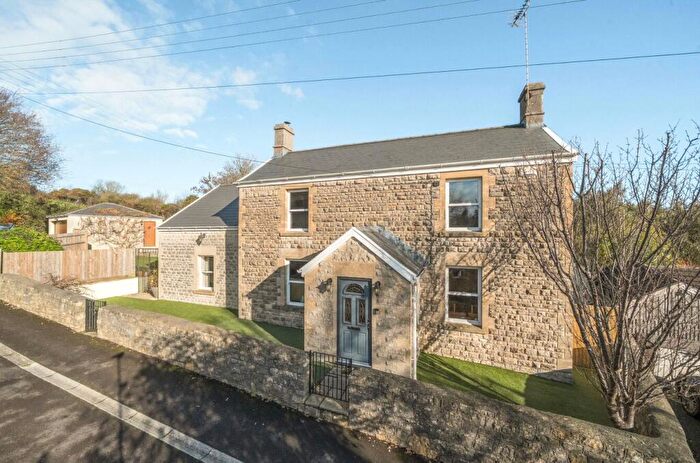
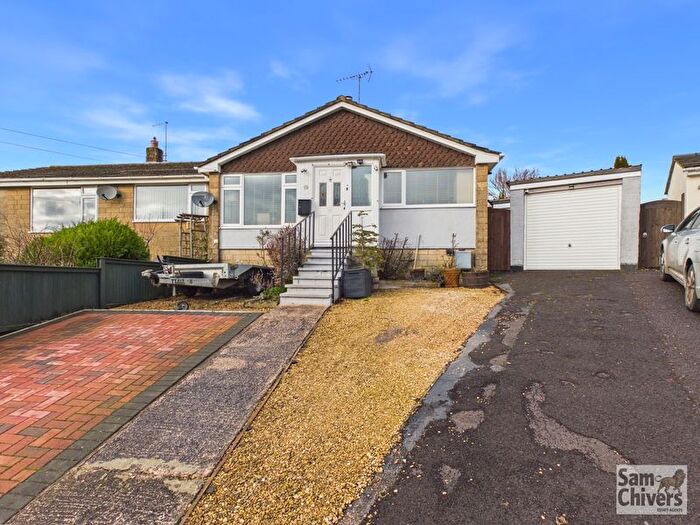
Houses for sale & to rent in Ammerdown, Radstock
House Prices in Ammerdown
Properties in Ammerdown have an average house price of £417,543.00 and had 33 Property Transactions within the last 3 years¹.
Ammerdown is an area in Radstock, Somerset with 466 households², where the most expensive property was sold for £1,260,000.00.
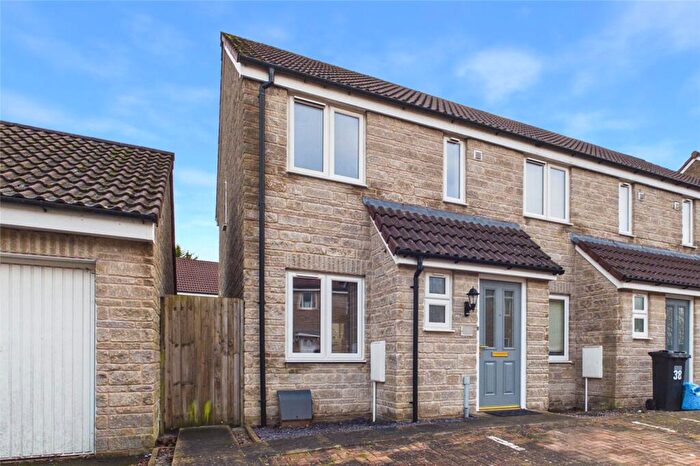
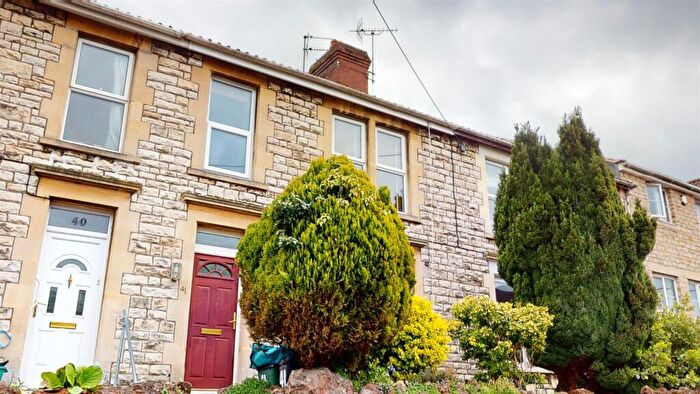
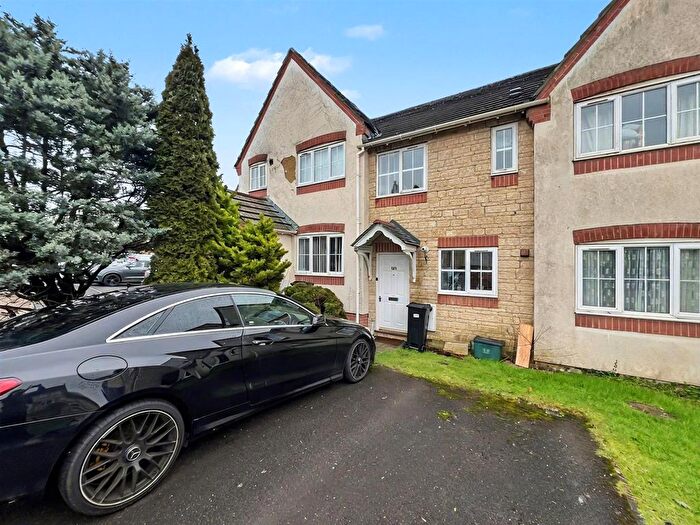
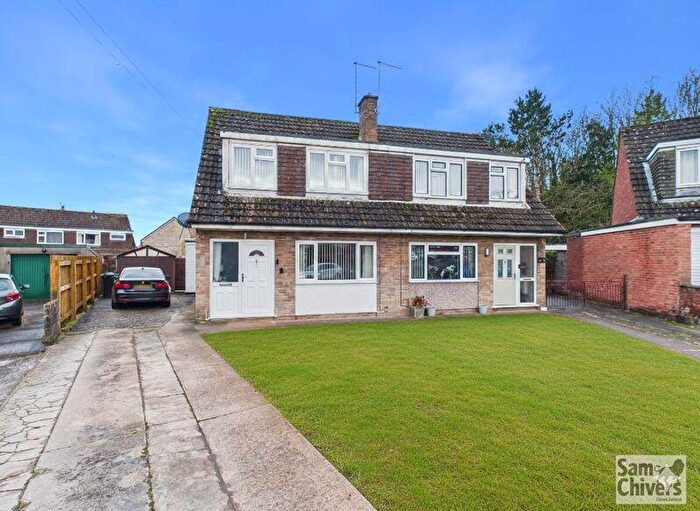
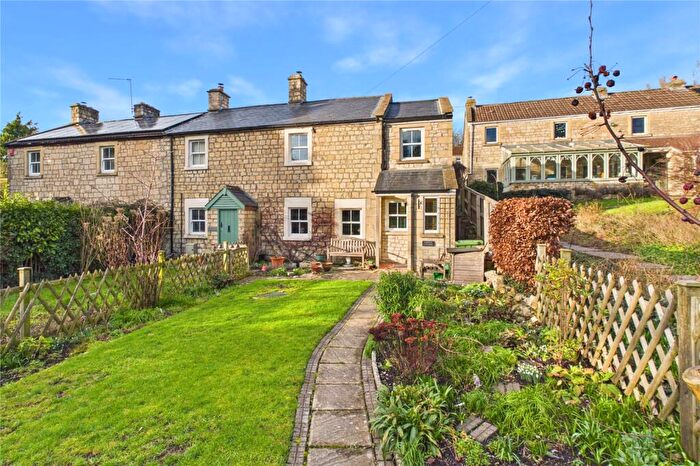
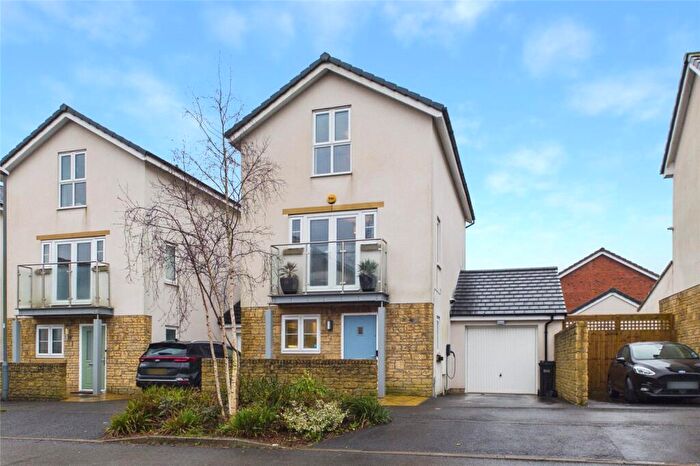
Properties for sale in Ammerdown
Roads and Postcodes in Ammerdown
Navigate through our locations to find the location of your next house in Ammerdown, Radstock for sale or to rent.
| Streets | Postcodes |
|---|---|
| Ames Lane | BA3 5TB |
| Ammerdown Park | BA3 5SH BA3 5SW |
| Ammerdown Terrace | BA3 5UG |
| Bearberry Meadow | BA3 4FR |
| Bishop Street | BA3 5XA |
| Cabbells Mead | BA3 5TA |
| Charlton | BA3 5TL BA3 5TN |
| Charlton Lane | BA3 4BD |
| Charlton Road | BA3 5EU |
| Charmborough Farm Rural Business Park | BA3 5FX |
| Chickwell Lane | BA3 5XT |
| Churchway | BA3 5US |
| Coles Gardens | BA3 5TG |
| Faulkland | BA3 5UH BA3 5WA BA3 5XD BA3 5XE BA3 5XF BA3 5XQ BA3 5YG |
| Follet Close | BA3 5TD |
| Fossefield Road | BA3 4AS BA3 4AT |
| Fosseway South | BA3 4AW |
| Frome Road | BA3 5UD |
| Fullwell Close | BA3 5XL |
| Fulwell Lane | BA3 5GN |
| Green Parlour | BA3 5UB |
| Greenway | BA3 5UW |
| Grove Lane | BA3 5UU |
| High Street | BA3 5UX |
| Hoares Lane | BA3 5ST BA3 5UL |
| Jubilee Terrace | BA3 5XU |
| Knobsbury Lane | BA3 5SJ |
| Knoll Lane | BA3 5GD |
| Lansdown View | BA3 5UT |
| Lower Vobster Cottages | BA3 5RL |
| Manor Close | BA3 5GE |
| Mells Lane | BA3 5SQ |
| Pond Cottages | BA3 5XB |
| Railway Cottages | BA3 5SR |
| Ruckley Ford | BA3 5YA |
| School Lane | BA3 5TE |
| Silver Street | BA3 5SU |
| St Edmunds Terrace | BA3 5SB |
| Terry Hill | BA3 5UF BA3 5UJ BA3 5UQ |
| The Green | BA3 5UZ BA3 5UY |
| Turners Tower | BA3 5UN BA3 5UP |
| Tyning Hill | BA3 5UR |
| Westmead | BA3 5GL |
| Whitfield Cottages | BA3 4QD |
| Wild Orchard | BA3 5XJ |
| BA3 5RJ BA3 5RN BA3 5SA BA3 5SD BA3 5SP BA3 5SX BA3 5XS BA3 5YD BA3 5YE BA3 5YF BA3 5SL BA3 5SN BA3 5SS BA3 5SY BA3 5SZ BA3 5XX BA3 5YB BA3 5YP |
Transport near Ammerdown
-
Frome Station
-
Freshford Station
-
Avoncliff Station
-
Oldfield Park Station
-
Bath Spa Station
-
Bradford-On-Avon Station
-
Trowbridge Station
-
Dilton Marsh Station
-
Westbury Station
- FAQ
- Price Paid By Year
- Property Type Price
Frequently asked questions about Ammerdown
What is the average price for a property for sale in Ammerdown?
The average price for a property for sale in Ammerdown is £417,543. This amount is 3% higher than the average price in Radstock. There are 3,374 property listings for sale in Ammerdown.
What streets have the most expensive properties for sale in Ammerdown?
The streets with the most expensive properties for sale in Ammerdown are Charlton at an average of £935,000, High Street at an average of £820,000 and Jubilee Terrace at an average of £800,000.
What streets have the most affordable properties for sale in Ammerdown?
The streets with the most affordable properties for sale in Ammerdown are Fullwell Close at an average of £135,000, Follet Close at an average of £190,000 and Lower Vobster Cottages at an average of £255,000.
Which train stations are available in or near Ammerdown?
Some of the train stations available in or near Ammerdown are Frome, Freshford and Avoncliff.
Property Price Paid in Ammerdown by Year
The average sold property price by year was:
| Year | Average Sold Price | Price Change |
Sold Properties
|
|---|---|---|---|
| 2025 | £571,944 | 35% |
9 Properties |
| 2024 | £371,528 | 10% |
16 Properties |
| 2023 | £335,875 | -51% |
8 Properties |
| 2022 | £505,781 | -3% |
18 Properties |
| 2021 | £521,852 | 5% |
17 Properties |
| 2020 | £495,088 | 30% |
17 Properties |
| 2019 | £344,321 | -17% |
14 Properties |
| 2018 | £402,427 | 1% |
18 Properties |
| 2017 | £397,987 | -4% |
24 Properties |
| 2016 | £412,812 | 13% |
8 Properties |
| 2015 | £357,765 | 14% |
13 Properties |
| 2014 | £306,124 | -6% |
18 Properties |
| 2013 | £324,269 | 4% |
13 Properties |
| 2012 | £311,488 | 5% |
9 Properties |
| 2011 | £297,095 | -26% |
10 Properties |
| 2010 | £373,008 | 8% |
10 Properties |
| 2009 | £342,923 | 23% |
13 Properties |
| 2008 | £264,500 | -50% |
5 Properties |
| 2007 | £396,809 | 19% |
16 Properties |
| 2006 | £320,707 | 8% |
7 Properties |
| 2005 | £294,168 | 11% |
12 Properties |
| 2004 | £263,136 | 37% |
22 Properties |
| 2003 | £166,880 | -22% |
13 Properties |
| 2002 | £203,986 | -16% |
17 Properties |
| 2001 | £236,913 | 47% |
18 Properties |
| 2000 | £125,137 | 20% |
20 Properties |
| 1999 | £100,500 | -19% |
11 Properties |
| 1998 | £119,812 | -0,4% |
8 Properties |
| 1997 | £120,331 | 2% |
19 Properties |
| 1996 | £117,410 | 20% |
15 Properties |
| 1995 | £93,812 | - |
12 Properties |
Property Price per Property Type in Ammerdown
Here you can find historic sold price data in order to help with your property search.
The average Property Paid Price for specific property types in the last three years are:
| Property Type | Average Sold Price | Sold Properties |
|---|---|---|
| Semi Detached House | £342,994.00 | 9 Semi Detached Houses |
| Detached House | £644,750.00 | 12 Detached Houses |
| Terraced House | £264,500.00 | 10 Terraced Houses |
| Flat | £155,000.00 | 2 Flats |

