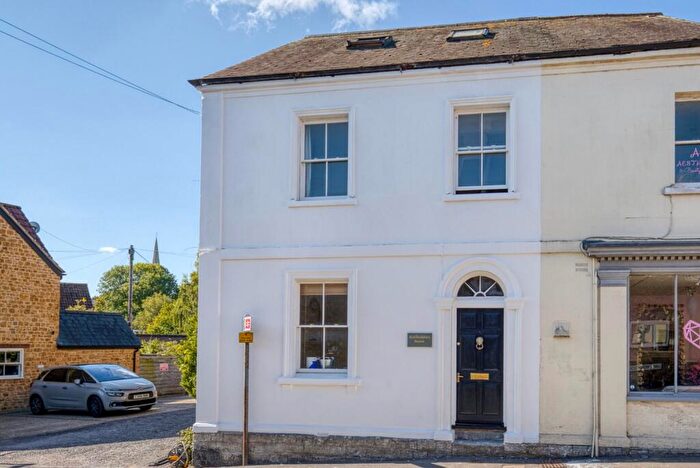
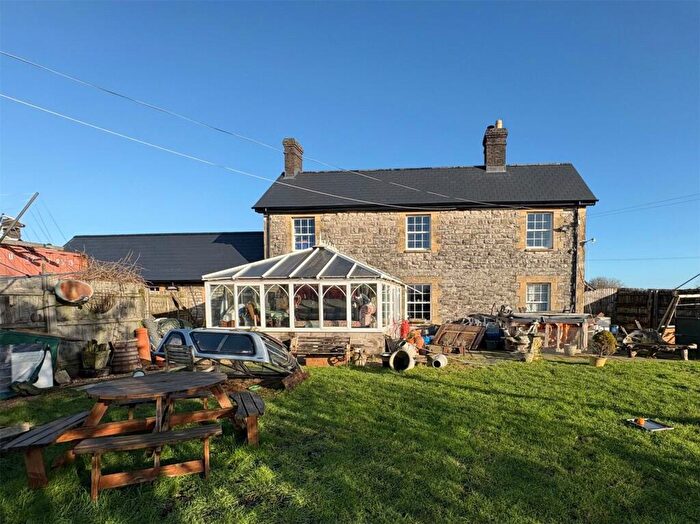
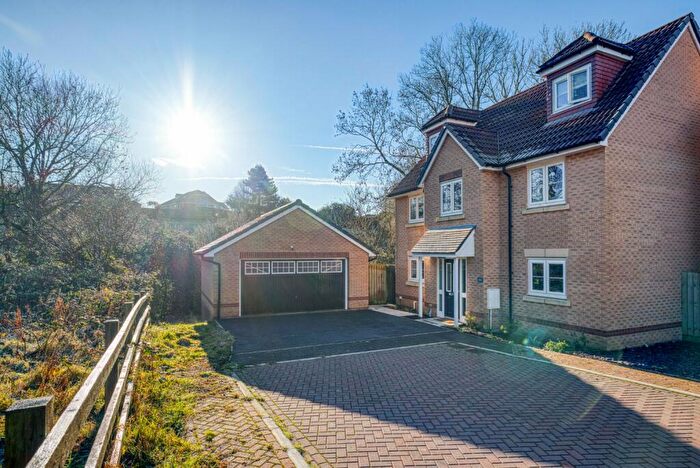
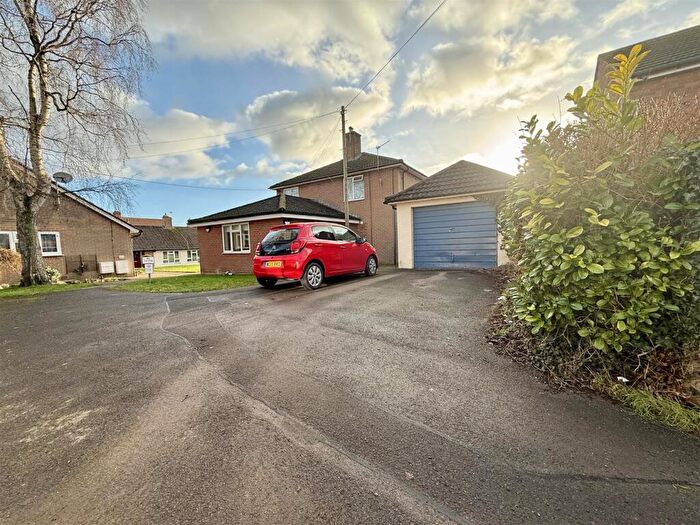
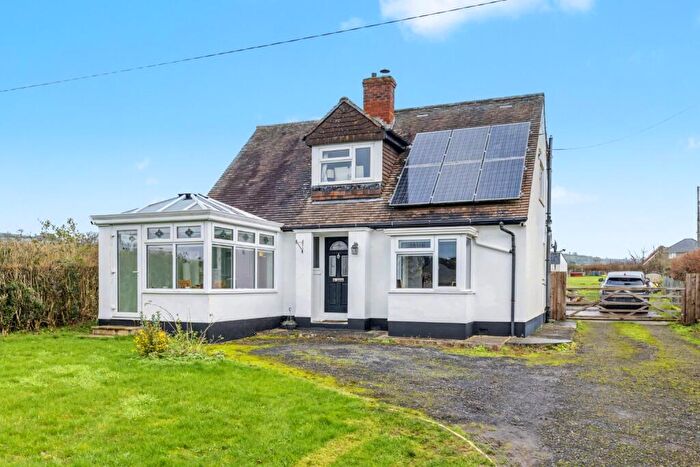
Houses for sale & to rent in The Pennards And Ditcheat, Shepton Mallet
House Prices in The Pennards And Ditcheat
Properties in The Pennards And Ditcheat have an average house price of £690,262.00 and had 30 Property Transactions within the last 3 years¹.
The Pennards And Ditcheat is an area in Shepton Mallet, Somerset with 535 households², where the most expensive property was sold for £4,414,865.00.
Properties for sale in The Pennards And Ditcheat
Roads and Postcodes in The Pennards And Ditcheat
Navigate through our locations to find the location of your next house in The Pennards And Ditcheat, Shepton Mallet for sale or to rent.
| Streets | Postcodes |
|---|---|
| Arthurs Bridge | BA4 6ND |
| Cock Mill Lane | BA4 4HR |
| Cockmill Lane | BA4 6TR |
| College Green | BA4 6SA |
| Culberry Cottages | BA4 6TT |
| Ditcheat Hill | BA4 6TL |
| Easton Lane | BA4 6SY |
| Easton Town | BA4 6SG |
| Easton Trow Lane | BA4 6PU |
| Fieldside | BA4 6QQ |
| Folly Drive | BA4 6QH |
| Hedge Lane | BA4 6SU |
| Hembridge | BA4 6TZ |
| Hillside Villas | BA4 6QF |
| Hornblotton House Cottage | BA4 6SB |
| Huckymead Lane | BA4 6RS |
| Huxham Green | BA4 6RR |
| Huxham Lane | BA4 6RP |
| Kilkenny Lane | BA4 6RU |
| Kite Lane | BA4 6RA |
| Lintern Close | BA4 6PJ |
| Little Pennard | BA4 6TW |
| Longmans Lea | BA4 6RT |
| Manor Close | BA4 6QT |
| Manor Cottages | BA4 6QA |
| Middleway Road | BA4 6TS |
| Mill Lane | BA4 6PX |
| Millford Lane | BA4 6PT |
| Prospect Cottages | BA4 6PW |
| Pye Hill | BA4 6TG |
| Pylle Hill | BA4 6TE |
| Pylle Lane | BA4 6SZ BA4 6TD |
| Queens Square | BA4 6QX |
| Silver Street | BA4 6QY |
| Smiths Lane | BA4 6PR |
| Somerleaze Cottages | BA4 6TY |
| South View | BA4 6PP |
| Stickleball Hill | BA4 6UG |
| Stone | BA4 6RY |
| Stone Lane | BA4 6RZ |
| The Drove | BA4 6UA |
| The Folly | BA4 6QS |
| The Gardens | BA4 6TU |
| The Green | BA4 6QZ |
| The Old Threshing Mill | BA4 6SP |
| Withial | BA4 6UE |
| Withial Hill | BA4 6UF |
| Wraxall Green | BA4 6RH |
| BA4 6PL BA4 6PN BA4 6PS BA4 6PY BA4 6PZ BA4 6QR BA4 6QU BA4 6RB BA4 6RD BA4 6RE BA4 6RJ BA4 6RL BA4 6RQ BA4 6RW BA4 6RX BA4 6SF BA4 6ST BA4 6TA BA4 6NB BA4 6QG BA4 6RF BA4 6RG BA4 6TB BA4 6TF BA4 6TN BA4 6TP BA4 6TQ BA4 6TX |
Transport near The Pennards And Ditcheat
-
Castle Cary Station
-
Bruton Station
-
Templecombe Station
-
Sherborne Station
-
Frome Station
-
Yeovil Pen Mill Station
-
Gillingham (Dorset) Station
-
Yeovil Junction Station
-
Thornford Station
- FAQ
- Price Paid By Year
- Property Type Price
Frequently asked questions about The Pennards And Ditcheat
What is the average price for a property for sale in The Pennards And Ditcheat?
The average price for a property for sale in The Pennards And Ditcheat is £690,262. This amount is 102% higher than the average price in Shepton Mallet. There are 856 property listings for sale in The Pennards And Ditcheat.
What streets have the most expensive properties for sale in The Pennards And Ditcheat?
The streets with the most expensive properties for sale in The Pennards And Ditcheat are Pylle Hill at an average of £2,582,432, Withial at an average of £1,100,000 and Queens Square at an average of £760,000.
What streets have the most affordable properties for sale in The Pennards And Ditcheat?
The streets with the most affordable properties for sale in The Pennards And Ditcheat are South View at an average of £300,000 and Pylle Lane at an average of £365,000.
Which train stations are available in or near The Pennards And Ditcheat?
Some of the train stations available in or near The Pennards And Ditcheat are Castle Cary, Bruton and Templecombe.
Property Price Paid in The Pennards And Ditcheat by Year
The average sold property price by year was:
| Year | Average Sold Price | Price Change |
Sold Properties
|
|---|---|---|---|
| 2025 | £772,500 | 28% |
4 Properties |
| 2024 | £556,357 | -47% |
14 Properties |
| 2023 | £819,072 | 21% |
12 Properties |
| 2022 | £648,336 | 22% |
15 Properties |
| 2021 | £506,580 | -2% |
20 Properties |
| 2020 | £516,586 | 5% |
15 Properties |
| 2019 | £490,000 | 3% |
10 Properties |
| 2018 | £475,535 | 25% |
14 Properties |
| 2017 | £356,746 | -6% |
16 Properties |
| 2016 | £378,888 | 18% |
9 Properties |
| 2015 | £309,352 | -6% |
12 Properties |
| 2014 | £326,437 | 15% |
16 Properties |
| 2013 | £277,041 | -14% |
12 Properties |
| 2012 | £315,994 | 15% |
10 Properties |
| 2011 | £268,562 | -34% |
8 Properties |
| 2010 | £359,781 | 11% |
16 Properties |
| 2009 | £321,892 | -16% |
14 Properties |
| 2008 | £373,900 | -25% |
10 Properties |
| 2007 | £467,247 | 16% |
12 Properties |
| 2006 | £392,321 | 26% |
14 Properties |
| 2005 | £291,090 | 10% |
16 Properties |
| 2004 | £261,150 | -24% |
10 Properties |
| 2003 | £323,059 | 33% |
12 Properties |
| 2002 | £217,973 | -27% |
21 Properties |
| 2001 | £277,423 | 30% |
19 Properties |
| 2000 | £195,105 | -31% |
19 Properties |
| 1999 | £254,964 | 53% |
14 Properties |
| 1998 | £121,064 | 24% |
14 Properties |
| 1997 | £92,433 | -36% |
12 Properties |
| 1996 | £125,250 | 35% |
14 Properties |
| 1995 | £81,285 | - |
7 Properties |
Property Price per Property Type in The Pennards And Ditcheat
Here you can find historic sold price data in order to help with your property search.
The average Property Paid Price for specific property types in the last three years are:
| Property Type | Average Sold Price | Sold Properties |
|---|---|---|
| Semi Detached House | £394,875.00 | 8 Semi Detached Houses |
| Detached House | £889,103.00 | 18 Detached Houses |
| Terraced House | £386,250.00 | 4 Terraced Houses |

