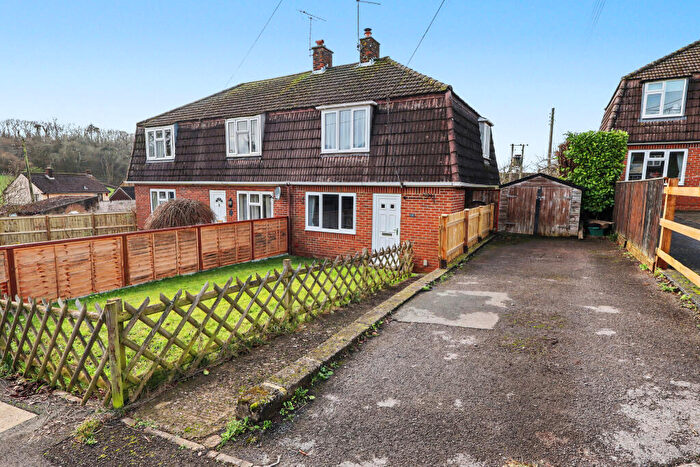
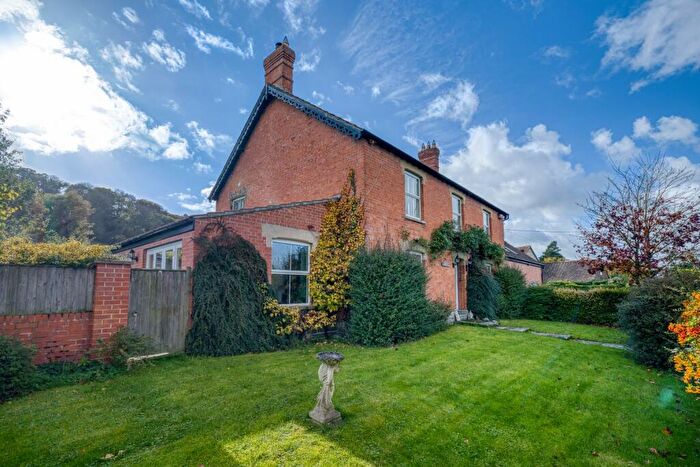
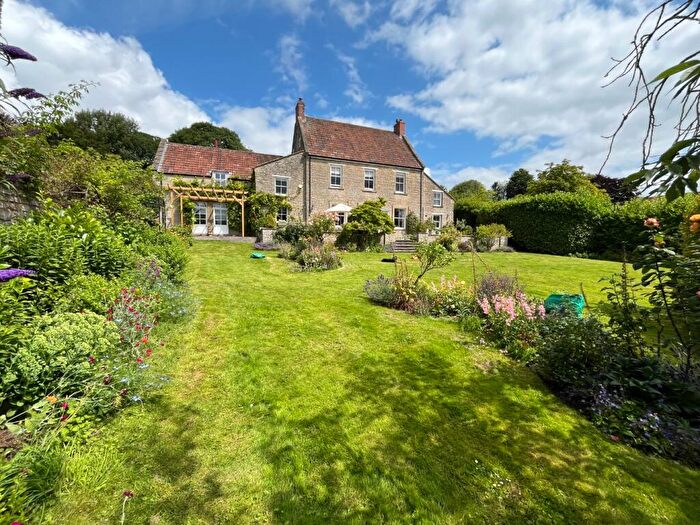
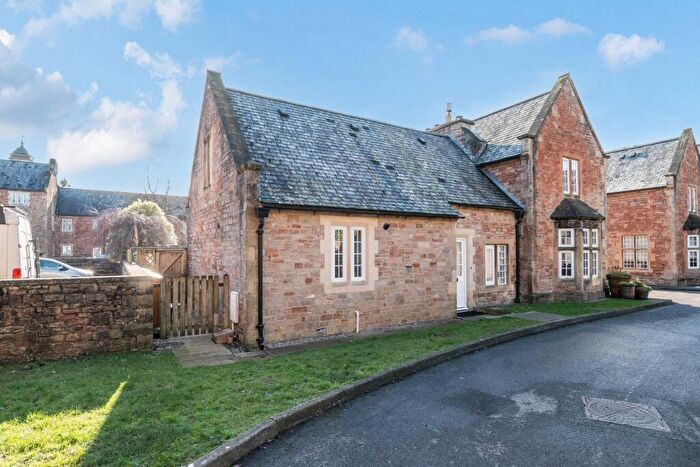
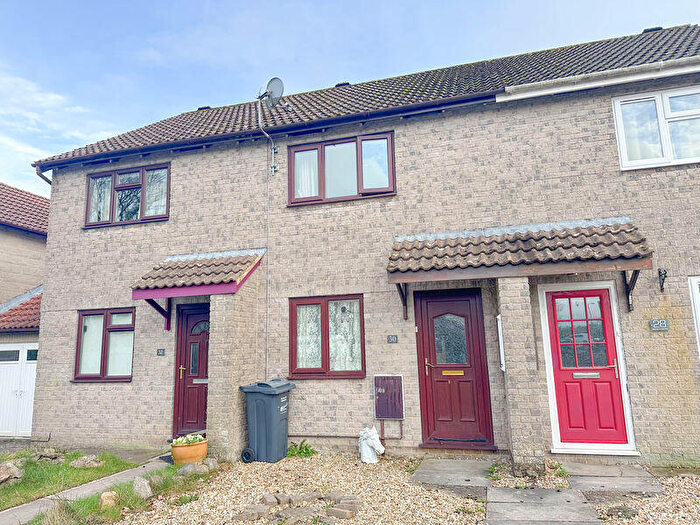
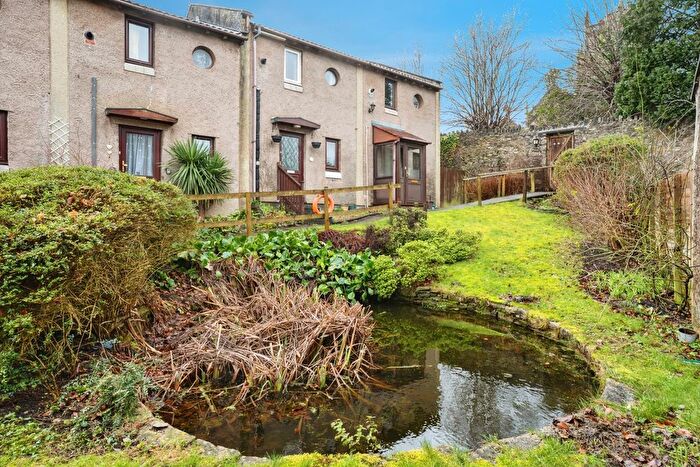
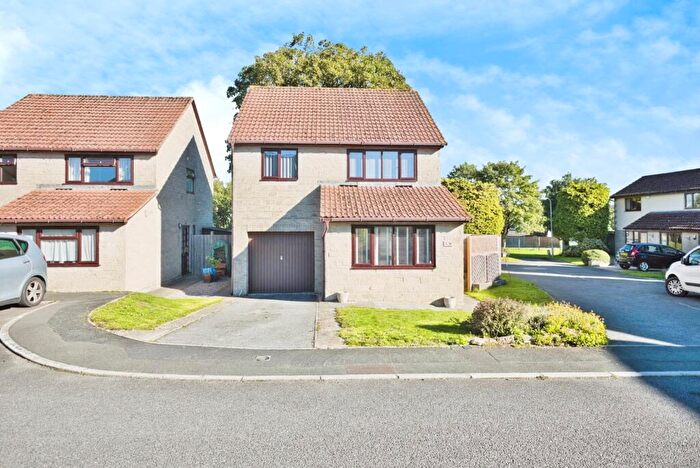
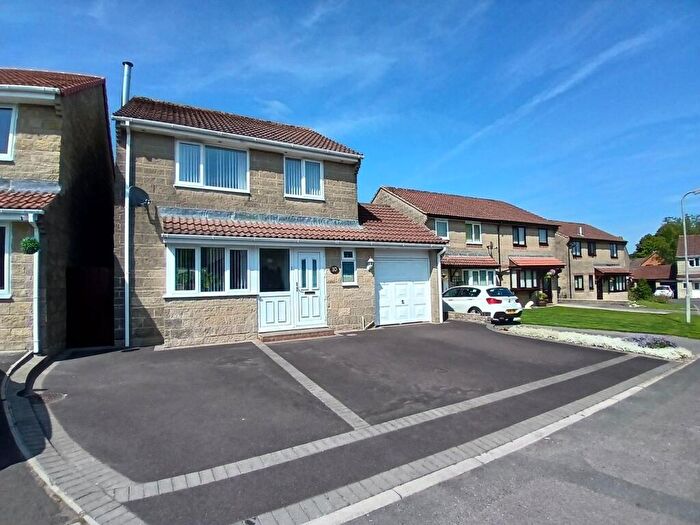
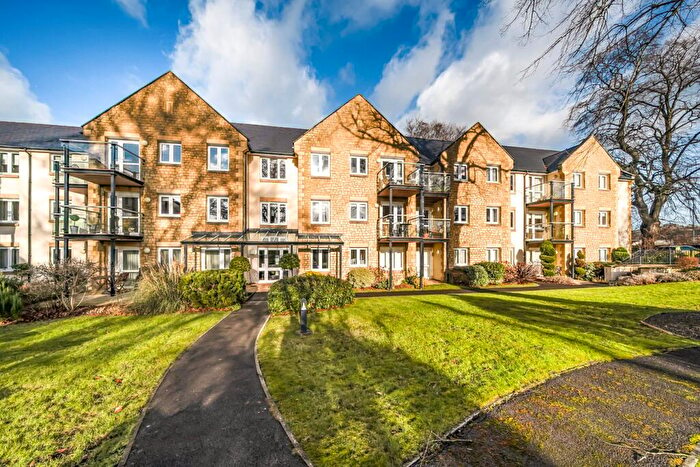
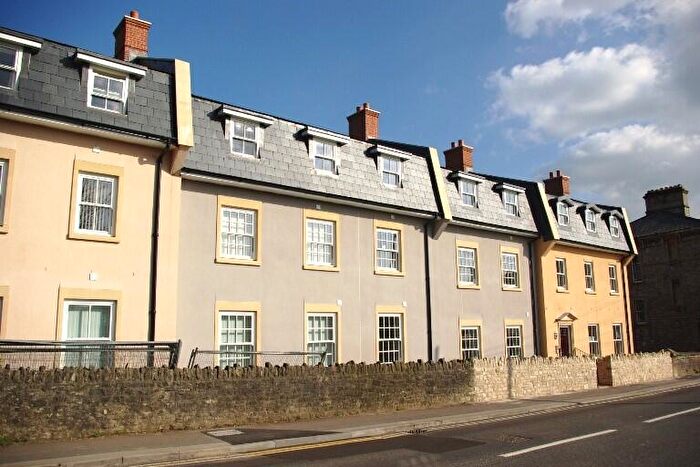
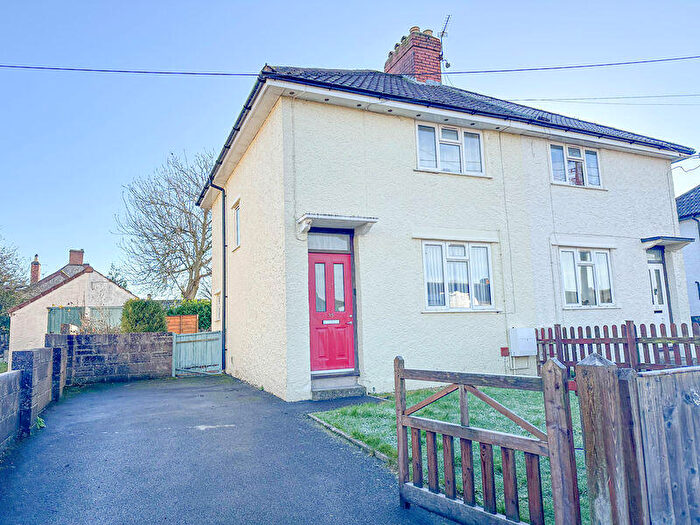
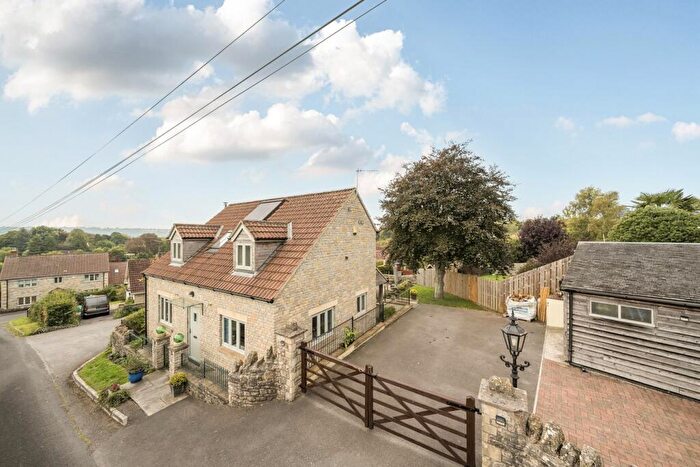
Houses for sale & to rent in Croscombe And Pilton, Shepton Mallet
House Prices in Croscombe And Pilton
Properties in Croscombe And Pilton have an average house price of £576,460.00 and had 39 Property Transactions within the last 3 years¹.
Croscombe And Pilton is an area in Shepton Mallet, Somerset with 549 households², where the most expensive property was sold for £975,000.00.
Properties for sale in Croscombe And Pilton
Roads and Postcodes in Croscombe And Pilton
Navigate through our locations to find the location of your next house in Croscombe And Pilton, Shepton Mallet for sale or to rent.
| Streets | Postcodes |
|---|---|
| Abbots Way | BA4 4BN |
| Barrow Lane | BA4 4BH BA4 4HL |
| Beardly Batch | BA4 4NB |
| Bowermead Lane | BA4 4DS |
| Bread Street | BA4 4BJ BA4 4BQ |
| Church View | BA4 4AD |
| Cock & Bull Drove | BA4 4HS |
| Compton Lane | BA4 4FL BA4 4NS |
| Conduit Square | BA4 4AX BA4 4DZ BA4 4EA |
| Culverwell Cottages | BA4 4DG |
| Cumhill | BA4 4BG |
| Dark Lane | BA4 4AQ |
| East Town Lane | BA4 4NX |
| Folly Lane | BA4 4ER BA4 4FA |
| Ford Lane | BA4 4BT |
| Ham Lane | BA4 4JB |
| Ham Lane East | BA4 4JA |
| Hartley Cottages | BA4 4ED |
| High Street | BA4 4AA BA4 4HA |
| John Beales Hill | BA4 4DB |
| John Burns Cottages | BA4 4NT |
| Knowle Lane | BA4 4PF |
| Lamberts Hill | BA4 4DR |
| Launcherley Lane | BA4 4AB |
| Lower Street | BA4 4DD |
| Lower Westholme | BA4 4EL BA4 4HW |
| Margaret Bondfield Close | BA4 4FY |
| Mead Lane | BA4 4HJ |
| Mount Pleasant | BA4 4BL |
| Neat Lane | BA4 4NU |
| Northtown | BA4 4AG |
| Northtown Lane | BA4 4AF |
| Park Hill | BA4 4AZ BA4 4EE BA4 4AY |
| Parsons Batch | BA4 4AU |
| Pilton Road | BA4 4ET |
| Platterwell Lane | BA4 6SR |
| Pylle Road | BA4 4BP BA4 4BR BA4 4HP |
| Quaish Lane | BA4 4HD |
| Ridge Lane | BA4 4FJ |
| Rose Cottages | BA4 4PD |
| Shop Lane | BA4 4BA BA4 4BE |
| Shutwell Lane | BA4 4DY |
| St Marys Lane | BA4 4BD BA4 4BB |
| Steanbow Cottages | BA4 4EH |
| Stocks Lane | BA4 4EP BA4 4EU |
| Tanyard Lane | BA4 4AE |
| Top Street | BA4 4DF BA4 4DQ BA4 4DU BA4 4DH |
| Upper Westholme | BA4 4EN |
| Watery Lane | BA4 4FF |
| Weir Lane | BA4 4BS |
| Westholme | BA4 4EW |
| Westholme Road | BA4 4EB |
| Whitstone Hill | BA4 4DT |
| Windsor Hill | BA4 4JQ |
| Worminster | BA4 4AJ BA4 4AN |
| Worthy Lane | BA4 4BY |
| BA4 4DX BA4 4EZ BA4 4HB BA4 4HE BA4 4HN BA4 4NR BA4 4NY BA4 4PA BA4 4PB BA4 4AP BA4 4ES BA4 4HQ |
Transport near Croscombe And Pilton
- FAQ
- Price Paid By Year
- Property Type Price
Frequently asked questions about Croscombe And Pilton
What is the average price for a property for sale in Croscombe And Pilton?
The average price for a property for sale in Croscombe And Pilton is £576,460. This amount is 69% higher than the average price in Shepton Mallet. There are 1,116 property listings for sale in Croscombe And Pilton.
What streets have the most expensive properties for sale in Croscombe And Pilton?
The streets with the most expensive properties for sale in Croscombe And Pilton are Mount Pleasant at an average of £940,000, East Town Lane at an average of £882,500 and Cumhill at an average of £842,500.
What streets have the most affordable properties for sale in Croscombe And Pilton?
The streets with the most affordable properties for sale in Croscombe And Pilton are Dark Lane at an average of £221,000, Whitstone Hill at an average of £280,000 and Pilton Road at an average of £285,000.
Which train stations are available in or near Croscombe And Pilton?
Some of the train stations available in or near Croscombe And Pilton are Castle Cary, Bruton and Frome.
Property Price Paid in Croscombe And Pilton by Year
The average sold property price by year was:
| Year | Average Sold Price | Price Change |
Sold Properties
|
|---|---|---|---|
| 2025 | £504,041 | -23% |
12 Properties |
| 2024 | £619,107 | 4% |
14 Properties |
| 2023 | £597,380 | -32% |
13 Properties |
| 2022 | £789,525 | 31% |
13 Properties |
| 2021 | £541,888 | 0,4% |
18 Properties |
| 2020 | £539,746 | -3% |
15 Properties |
| 2019 | £555,300 | 15% |
10 Properties |
| 2018 | £474,676 | 10% |
17 Properties |
| 2017 | £429,153 | 3% |
13 Properties |
| 2016 | £415,879 | -13% |
17 Properties |
| 2015 | £470,785 | -28% |
14 Properties |
| 2014 | £601,726 | 19% |
19 Properties |
| 2013 | £485,086 | 30% |
11 Properties |
| 2012 | £339,708 | -43% |
12 Properties |
| 2011 | £487,212 | 34% |
12 Properties |
| 2010 | £319,954 | -5% |
11 Properties |
| 2009 | £336,782 | 17% |
17 Properties |
| 2008 | £279,285 | -63% |
14 Properties |
| 2007 | £455,378 | 26% |
24 Properties |
| 2006 | £338,875 | -3% |
8 Properties |
| 2005 | £350,639 | 5% |
14 Properties |
| 2004 | £332,465 | 22% |
16 Properties |
| 2003 | £259,816 | -10% |
15 Properties |
| 2002 | £285,774 | 30% |
27 Properties |
| 2001 | £198,922 | 8% |
29 Properties |
| 2000 | £182,179 | 16% |
21 Properties |
| 1999 | £153,585 | 17% |
13 Properties |
| 1998 | £127,589 | -26% |
14 Properties |
| 1997 | £160,818 | 47% |
18 Properties |
| 1996 | £84,965 | -14% |
20 Properties |
| 1995 | £97,032 | - |
14 Properties |
Property Price per Property Type in Croscombe And Pilton
Here you can find historic sold price data in order to help with your property search.
The average Property Paid Price for specific property types in the last three years are:
| Property Type | Average Sold Price | Sold Properties |
|---|---|---|
| Semi Detached House | £409,000.00 | 9 Semi Detached Houses |
| Detached House | £666,584.00 | 23 Detached Houses |
| Terraced House | £495,642.00 | 7 Terraced Houses |

