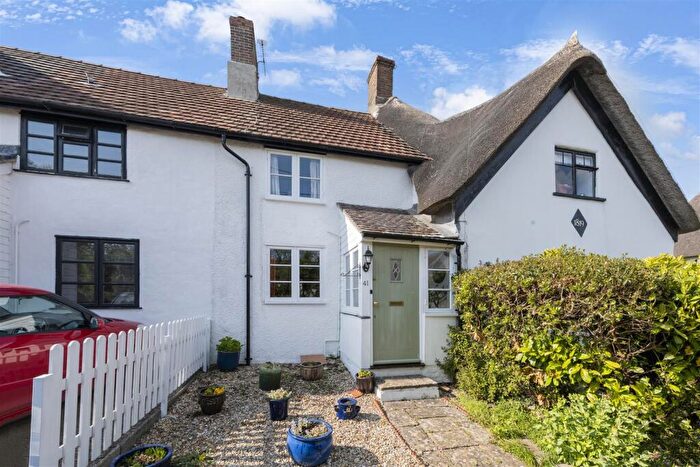
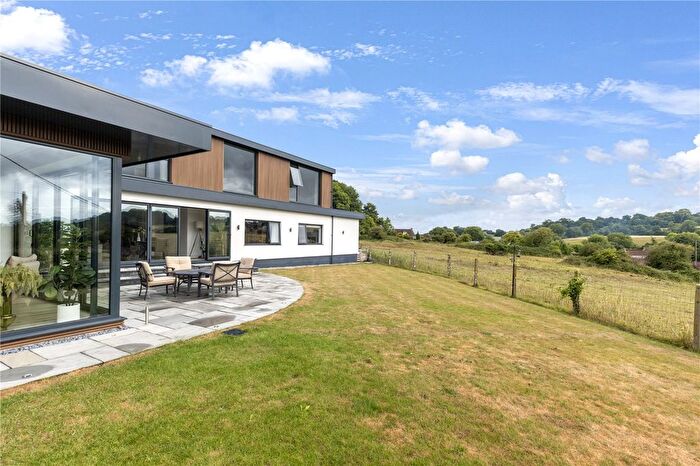
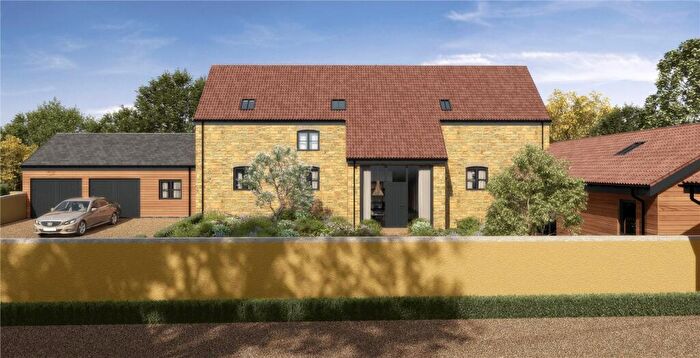
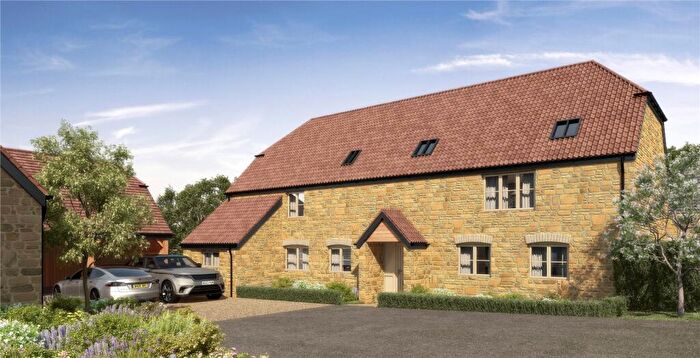
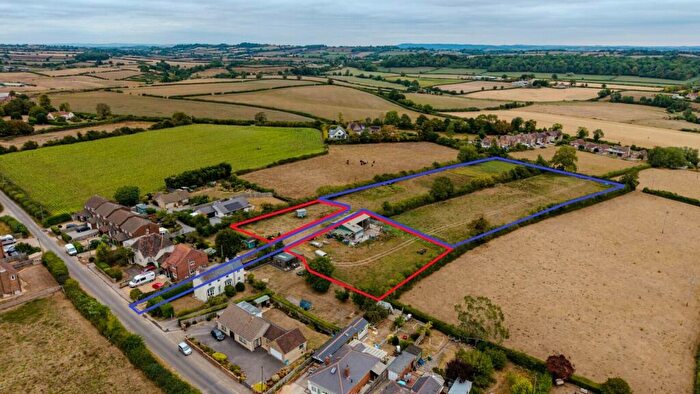
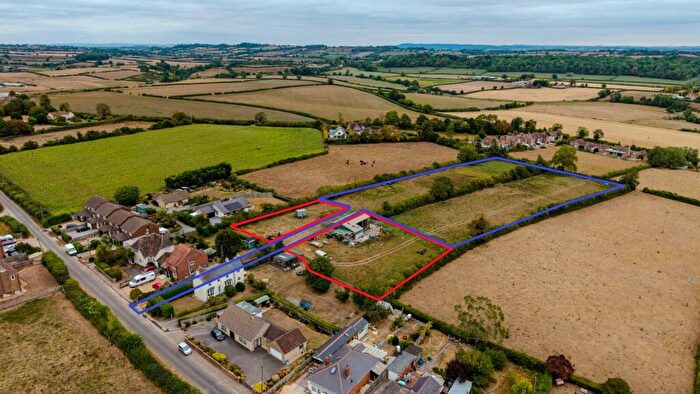
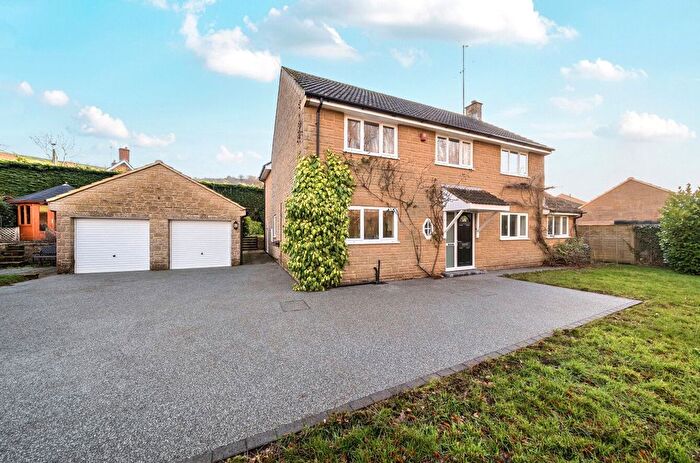
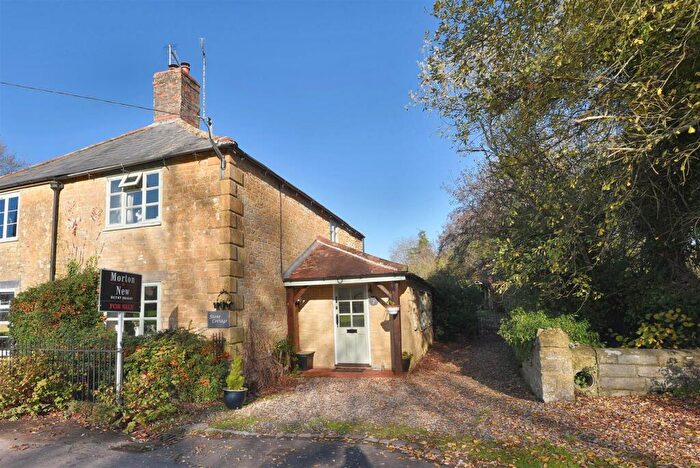
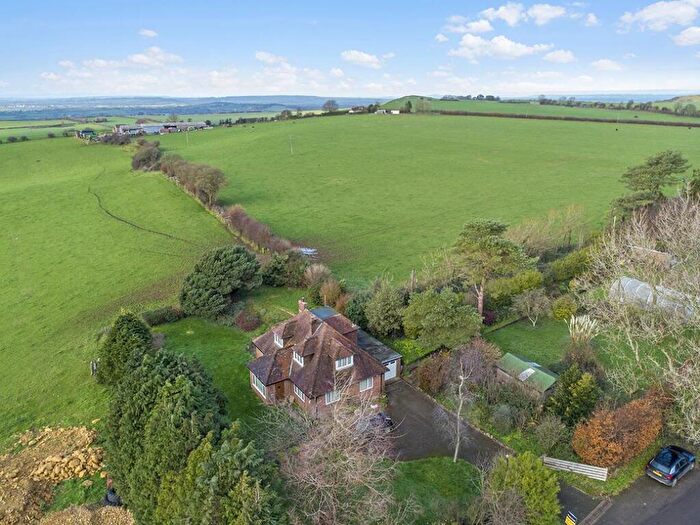
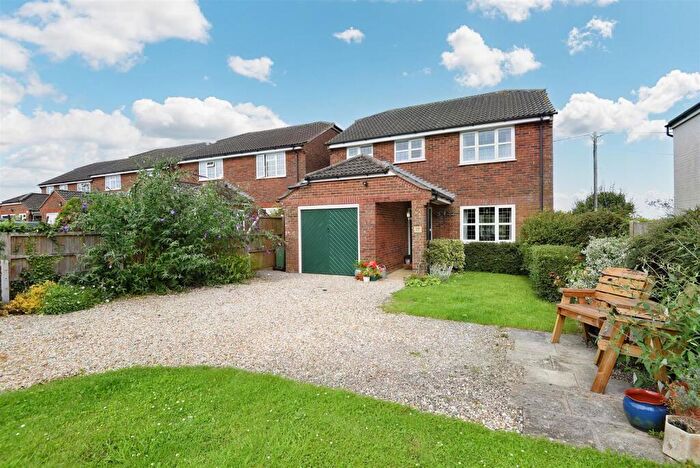
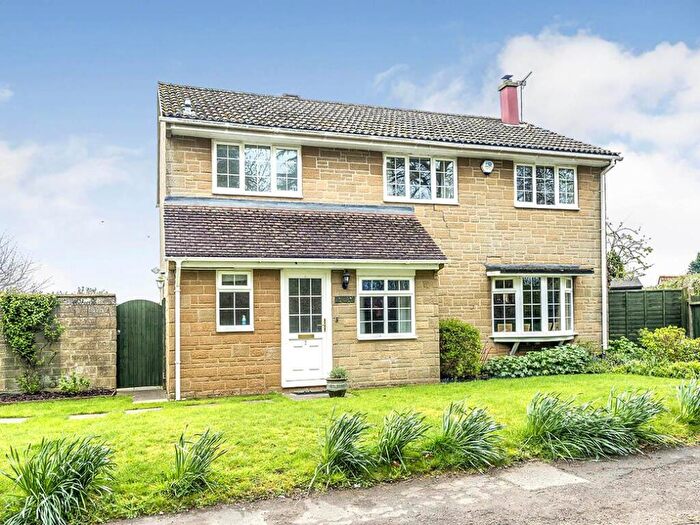
Houses for sale & to rent in Blackmoor Vale, Sherborne
House Prices in Blackmoor Vale
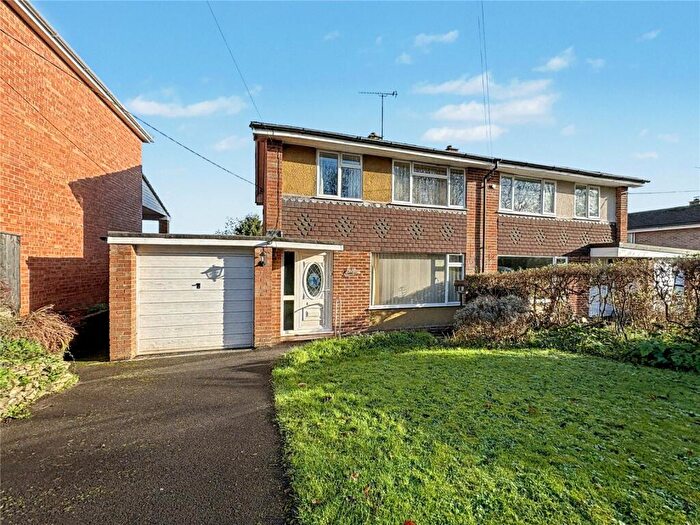
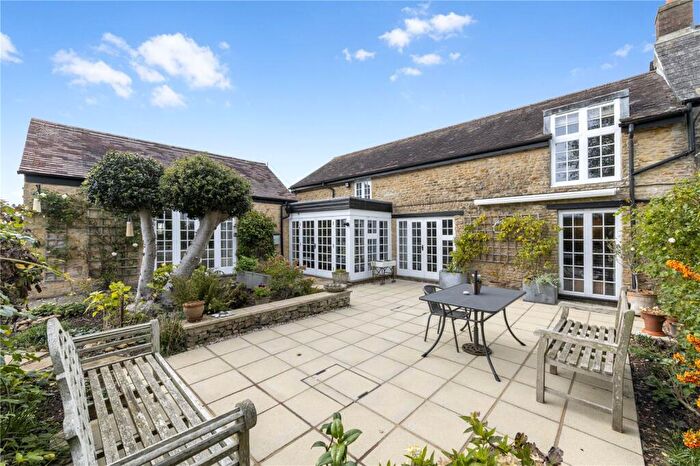
Properties in Blackmoor Vale have an average house price of £779,640.00 and had 22 Property Transactions within the last 3 years¹.
Blackmoor Vale is an area in Sherborne, Somerset with 359 households², where the most expensive property was sold for £3,100,000.00.
Properties for sale in Blackmoor Vale
Roads and Postcodes in Blackmoor Vale
Navigate through our locations to find the location of your next house in Blackmoor Vale, Sherborne for sale or to rent.
| Streets | Postcodes |
|---|---|
| Blackford Road | DT9 4NS DT9 4PG |
| Blackford Way | DT9 4ND |
| Bramley Close | DT9 4PL |
| Cathill Lane | DT9 4PA |
| Cowpath Lane | DT9 4NR |
| Green Lane | DT9 4NY |
| Hanover View | DT9 5FW |
| Harvest Lane | DT9 4PH |
| High Street | DT9 4FY |
| Honeysuckle Court | DT9 4NF |
| Lester Lane | DT9 4NU |
| Level Lane | DT9 4NN |
| Manor Close | DT9 4PF |
| Maperton Road | DT9 4NT |
| Middle Ridge Lane | DT9 4LP |
| Milborne Port Road | DT9 4NH |
| Orchard Way | DT9 4PJ |
| Sherborne Road | DT9 4NJ |
| Southdown | DT9 4NQ |
| The Knapp | DT9 4PQ |
| Vartenham Close | DT9 5FY |
| Warren Close | DT9 4NW |
| Water Lane | DT9 4NX |
| DT9 4LH DT9 4LL DT9 4LN DT9 4LQ DT9 4LR DT9 4LS DT9 4LT DT9 4LW DT9 4LX DT9 4LZ DT9 4NL DT9 4NZ DT9 4PB DT9 4PD DT9 4PE DT9 4PR DT9 4LU DT9 4NP DT9 5HD |
Transport near Blackmoor Vale
-
Templecombe Station
-
Sherborne Station
-
Castle Cary Station
-
Yeovil Pen Mill Station
-
Bruton Station
-
Thornford Station
-
Yeovil Junction Station
-
Yetminster Station
-
Gillingham (Dorset) Station
- FAQ
- Price Paid By Year
- Property Type Price
Frequently asked questions about Blackmoor Vale
What is the average price for a property for sale in Blackmoor Vale?
The average price for a property for sale in Blackmoor Vale is £779,640. This amount is 107% higher than the average price in Sherborne. There are 211 property listings for sale in Blackmoor Vale.
What streets have the most expensive properties for sale in Blackmoor Vale?
The streets with the most expensive properties for sale in Blackmoor Vale are Water Lane at an average of £2,037,500, Blackford Way at an average of £760,000 and Harvest Lane at an average of £705,000.
What streets have the most affordable properties for sale in Blackmoor Vale?
The streets with the most affordable properties for sale in Blackmoor Vale are Manor Close at an average of £320,000, Orchard Way at an average of £460,000 and Maperton Road at an average of £512,500.
Which train stations are available in or near Blackmoor Vale?
Some of the train stations available in or near Blackmoor Vale are Templecombe, Sherborne and Castle Cary.
Property Price Paid in Blackmoor Vale by Year
The average sold property price by year was:
| Year | Average Sold Price | Price Change |
Sold Properties
|
|---|---|---|---|
| 2025 | £603,000 | -46% |
5 Properties |
| 2024 | £881,450 | 14% |
10 Properties |
| 2023 | £760,371 | 16% |
7 Properties |
| 2022 | £641,735 | 11% |
17 Properties |
| 2021 | £571,922 | 36% |
23 Properties |
| 2020 | £367,142 | -19% |
7 Properties |
| 2019 | £435,357 | -59% |
14 Properties |
| 2018 | £694,166 | 33% |
6 Properties |
| 2017 | £466,928 | 16% |
14 Properties |
| 2016 | £392,961 | 17% |
13 Properties |
| 2015 | £326,900 | -47% |
10 Properties |
| 2014 | £479,359 | 9% |
16 Properties |
| 2013 | £433,933 | -4% |
15 Properties |
| 2012 | £451,500 | 29% |
10 Properties |
| 2011 | £318,590 | -0,4% |
11 Properties |
| 2010 | £319,819 | 21% |
13 Properties |
| 2009 | £254,076 | -55% |
13 Properties |
| 2008 | £394,571 | 2% |
7 Properties |
| 2007 | £388,160 | 9% |
27 Properties |
| 2006 | £354,514 | -29% |
17 Properties |
| 2005 | £456,700 | 27% |
10 Properties |
| 2004 | £332,263 | 20% |
19 Properties |
| 2003 | £266,611 | 9% |
18 Properties |
| 2002 | £243,235 | 16% |
17 Properties |
| 2001 | £204,305 | -4% |
17 Properties |
| 2000 | £213,440 | 28% |
20 Properties |
| 1999 | £154,673 | 17% |
21 Properties |
| 1998 | £128,700 | 12% |
10 Properties |
| 1997 | £113,818 | 18% |
22 Properties |
| 1996 | £93,675 | -8% |
14 Properties |
| 1995 | £101,454 | - |
11 Properties |
Property Price per Property Type in Blackmoor Vale
Here you can find historic sold price data in order to help with your property search.
The average Property Paid Price for specific property types in the last three years are:
| Property Type | Average Sold Price | Sold Properties |
|---|---|---|
| Semi Detached House | £368,750.00 | 4 Semi Detached Houses |
| Detached House | £898,652.00 | 17 Detached Houses |
| Flat | £400,000.00 | 1 Flat |

