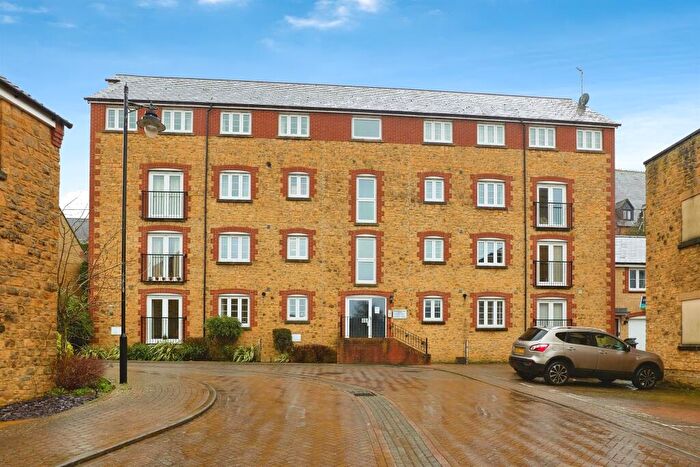
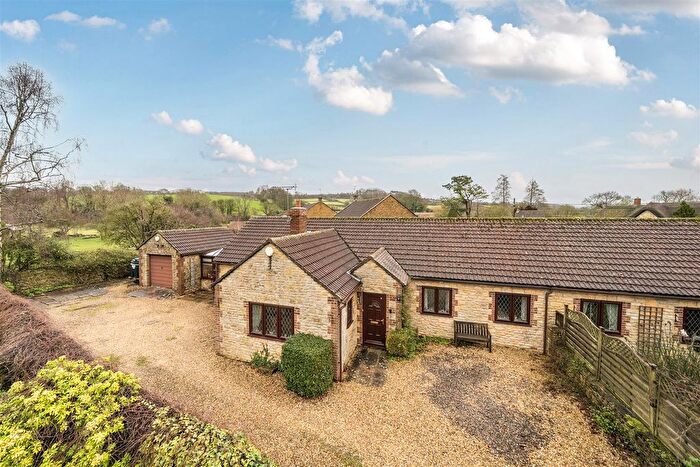
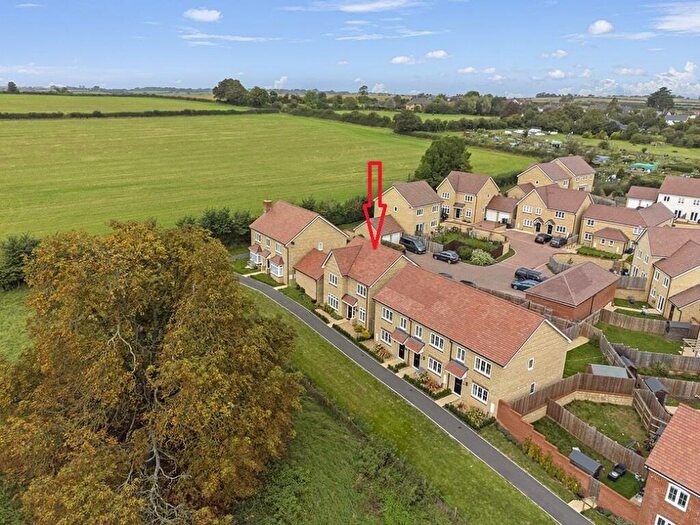
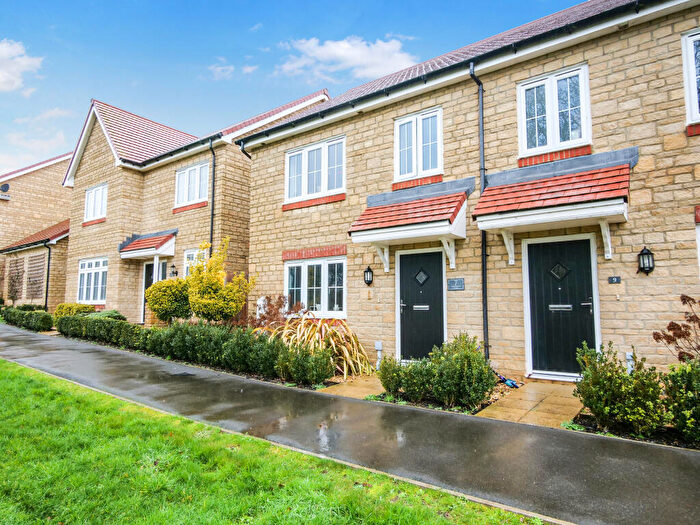
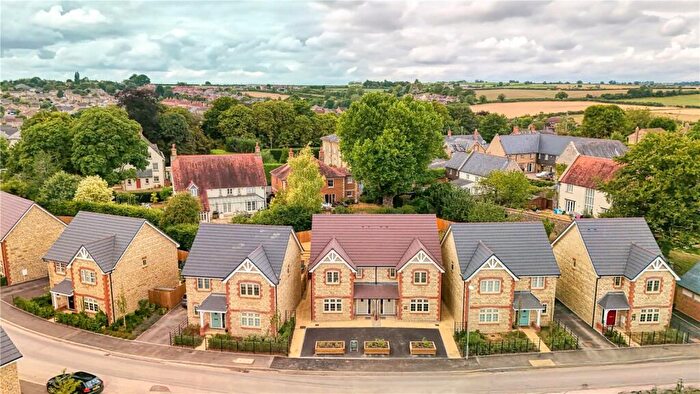
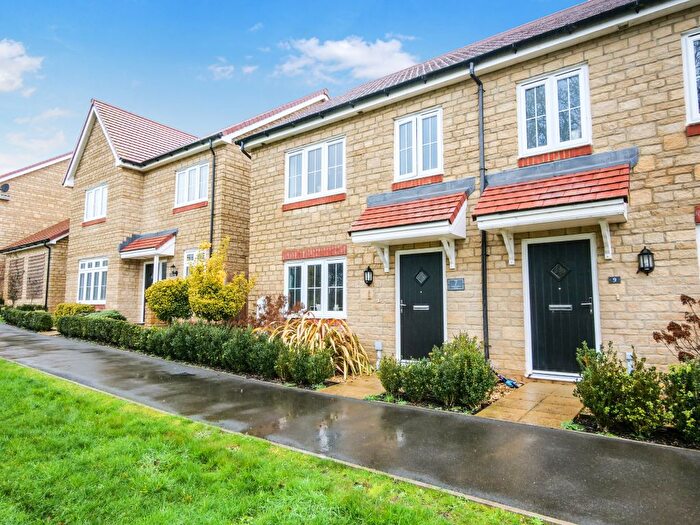
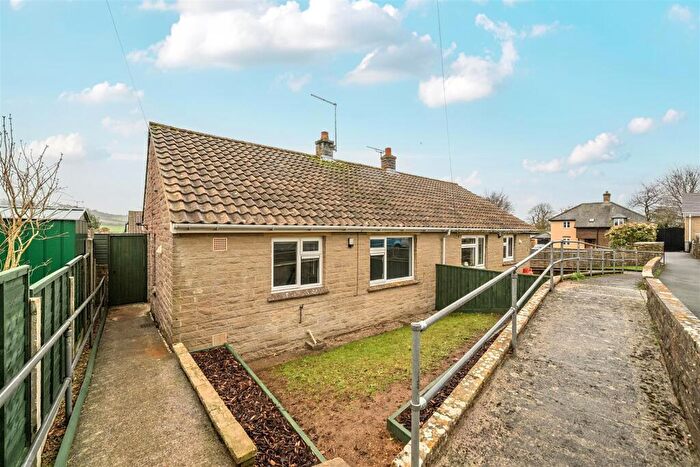
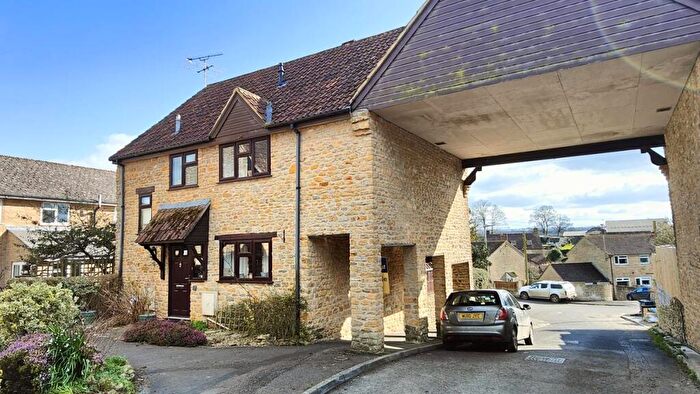
Houses for sale & to rent in Milborne Port, Sherborne
House Prices in Milborne Port
Properties in Milborne Port have an average house price of £306,530.00 and had 125 Property Transactions within the last 3 years¹.
Milborne Port is an area in Sherborne, Somerset with 1,251 households², where the most expensive property was sold for £2,300,000.00.
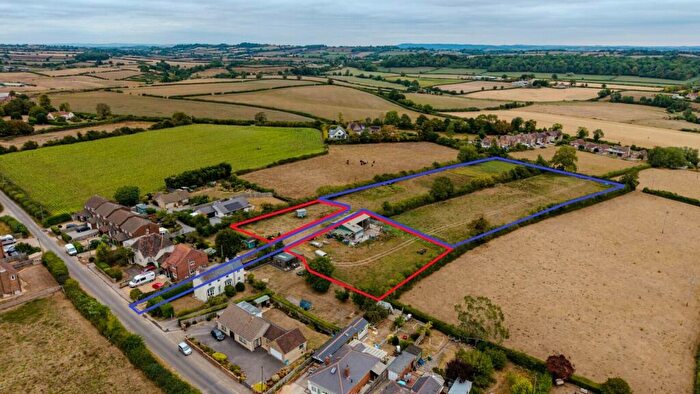
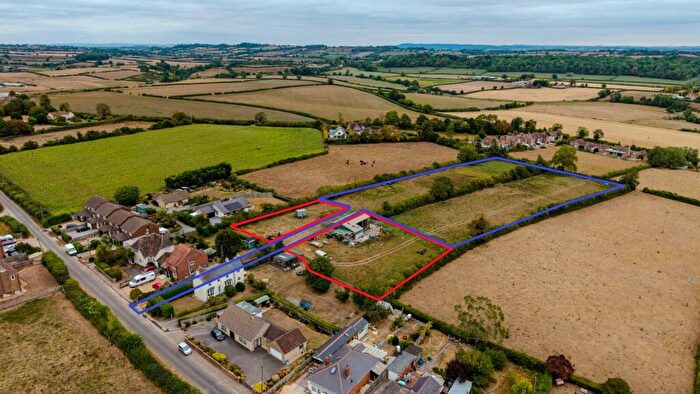
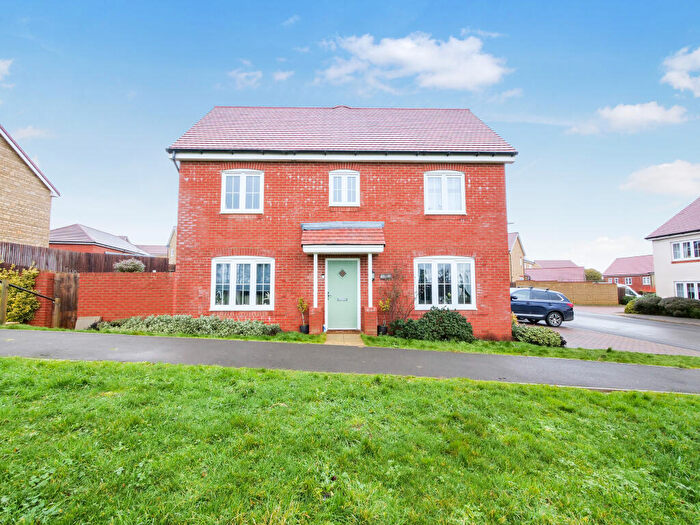
Properties for sale in Milborne Port
Roads and Postcodes in Milborne Port
Navigate through our locations to find the location of your next house in Milborne Port, Sherborne for sale or to rent.
| Streets | Postcodes |
|---|---|
| Angel Court | DT9 5LT |
| Bathwell Lane | DT9 5AN |
| Bauntons Close | DT9 5BY |
| Bauntons Orchard | DT9 5BP |
| Bazzleways Close | DT9 5FD |
| Brook Street | DT9 5DN |
| Brookside | DT9 5RB |
| Cannon Court Mews | DT9 5RD |
| Chapel Lane | DT9 5DL |
| Church Place | DT9 5HJ |
| Church Street | DT9 5DJ |
| Church Walk | DT9 5AH |
| Cold Harbour | DT9 5EL |
| Combe Hill | DT9 5BE DT9 5BG DT9 5BQ |
| Court Lane | DT9 5EE |
| Crackmore Drive | DT9 5FX |
| East Street | DT9 5DR |
| East View | DT9 5DZ |
| Everlanes Close | DT9 5FT |
| Furlong Lane | DT9 5HH |
| Gainsborough | DT9 5AZ DT9 5BA DT9 5BB DT9 5BD DT9 5FH |
| Gascoigne Place | DT9 5FE |
| Glovers Close | DT9 5ER |
| Goathill Road | DT9 5AY |
| Goldings Lane | DT9 5AD |
| Gunville Gardens | DT9 5FF |
| Henning Way | DT9 5HN |
| High Street | DT9 5AG DT9 5AQ DT9 5DQ DT9 5DF DT9 5DG |
| Higher Gunville | DT9 5AW |
| Higher Kingsbury | DT9 5EB |
| Higher Kingsbury Close | DT9 5JL |
| Lambert Close | DT9 5AF |
| Limerick Close | DT9 5EN |
| Limerick Villas | DT9 5ES |
| Lion Drive | DT9 5FQ |
| London Road | DT9 5DP DT9 5DW DT9 5RA |
| Lower Gunville | DT9 5AP |
| Lower Kingsbury | DT9 5ED |
| Manor Road | DT9 5BL DT9 5BN |
| Milborne Gardens | DT9 5FS |
| Newtown | DT9 5BH DT9 5BJ |
| North Crescent | DT9 5HW |
| North Street | DT9 5EP DT9 5ET DT9 5EW |
| Old Tannery Way | DT9 5GA |
| Orchard Road | DT9 5BU |
| Orchard Walk | DT9 5DE |
| Paddock Walk | DT9 5EA |
| Piece Road | DT9 5BW |
| Plover Close | DT9 5DD |
| Plover Road | DT9 5DA |
| Prankerds Road | DT9 5BX |
| Pud Brook | DT9 5RF |
| Redwing Road | DT9 5DB |
| Rosemary Street | DT9 5AR |
| Russell Place | DT9 5HQ |
| Sansomes Hill | DT9 5AJ DT9 5AL |
| Sherborne Road | DT9 5AS DT9 5AT DT9 5AX DT9 5AU |
| South Street | DT9 5DH |
| South View Road | DT9 5BS |
| Southcombe Gardens | DT9 5FB |
| Springfield Road | DT9 5RE |
| Station Road | DT9 5EF DT9 5EG DT9 5EH DT9 5EQ |
| Streamside Walk | DT9 5GB |
| The Brambles | DT9 5AE |
| The Meads | DT9 5DS |
| Thimble Lane | DT9 5JJ |
| Victoria Terrace | DT9 5BZ |
| Waterloo Crescent | DT9 4NG |
| West Hill | DT9 5HL DT9 5LS |
| West View | DT9 5EJ |
| Wheathill Close | DT9 5EU |
| Wheathill Lane | DT9 5EX DT9 5EY |
| Wheathill Way | DT9 5EZ DT9 5HA DT9 5FR |
| Wick Road | DT9 5BT DT9 5HF DT9 5HG |
| DT9 4PP DT9 4PW DT9 4LJ DT9 5DU DT9 5FU DT9 5HB DT9 5HE |
Transport near Milborne Port
-
Sherborne Station
-
Templecombe Station
-
Thornford Station
-
Yeovil Pen Mill Station
-
Yetminster Station
-
Yeovil Junction Station
-
Chetnole Station
-
Castle Cary Station
-
Gillingham (Dorset) Station
-
Bruton Station
- FAQ
- Price Paid By Year
- Property Type Price
Frequently asked questions about Milborne Port
What is the average price for a property for sale in Milborne Port?
The average price for a property for sale in Milborne Port is £306,530. This amount is 19% lower than the average price in Sherborne. There are 424 property listings for sale in Milborne Port.
What streets have the most expensive properties for sale in Milborne Port?
The streets with the most expensive properties for sale in Milborne Port are Furlong Lane at an average of £780,000, Russell Place at an average of £625,000 and Lower Kingsbury at an average of £512,500.
What streets have the most affordable properties for sale in Milborne Port?
The streets with the most affordable properties for sale in Milborne Port are South View Road at an average of £140,000, Cold Harbour at an average of £149,000 and Rosemary Street at an average of £188,500.
Which train stations are available in or near Milborne Port?
Some of the train stations available in or near Milborne Port are Sherborne, Templecombe and Thornford.
Property Price Paid in Milborne Port by Year
The average sold property price by year was:
| Year | Average Sold Price | Price Change |
Sold Properties
|
|---|---|---|---|
| 2025 | £275,384 | -9% |
48 Properties |
| 2024 | £300,616 | -22% |
47 Properties |
| 2023 | £365,631 | 7% |
30 Properties |
| 2022 | £339,184 | 18% |
55 Properties |
| 2021 | £277,706 | -18% |
80 Properties |
| 2020 | £328,166 | 8% |
52 Properties |
| 2019 | £301,131 | 16% |
47 Properties |
| 2018 | £253,325 | -1% |
60 Properties |
| 2017 | £255,746 | 2% |
66 Properties |
| 2016 | £251,388 | 7% |
83 Properties |
| 2015 | £234,680 | 6% |
58 Properties |
| 2014 | £220,644 | 7% |
71 Properties |
| 2013 | £204,591 | -3% |
81 Properties |
| 2012 | £210,112 | 2% |
36 Properties |
| 2011 | £205,041 | -5% |
68 Properties |
| 2010 | £216,081 | 4% |
61 Properties |
| 2009 | £207,107 | 10% |
50 Properties |
| 2008 | £186,025 | -24% |
25 Properties |
| 2007 | £229,809 | 0,4% |
68 Properties |
| 2006 | £228,820 | 3% |
65 Properties |
| 2005 | £222,500 | 11% |
42 Properties |
| 2004 | £198,485 | -2% |
56 Properties |
| 2003 | £201,575 | 29% |
52 Properties |
| 2002 | £142,917 | 11% |
61 Properties |
| 2001 | £127,164 | 20% |
51 Properties |
| 2000 | £101,888 | 3% |
53 Properties |
| 1999 | £98,455 | 5% |
65 Properties |
| 1998 | £93,812 | 27% |
43 Properties |
| 1997 | £68,221 | 13% |
59 Properties |
| 1996 | £59,014 | -4% |
69 Properties |
| 1995 | £61,553 | - |
51 Properties |
Property Price per Property Type in Milborne Port
Here you can find historic sold price data in order to help with your property search.
The average Property Paid Price for specific property types in the last three years are:
| Property Type | Average Sold Price | Sold Properties |
|---|---|---|
| Semi Detached House | £283,167.00 | 47 Semi Detached Houses |
| Detached House | £484,807.00 | 26 Detached Houses |
| Terraced House | £252,133.00 | 45 Terraced Houses |
| Flat | £150,928.00 | 7 Flats |

