
Houses for sale & to rent in Cary, Somerton
House Prices in Cary
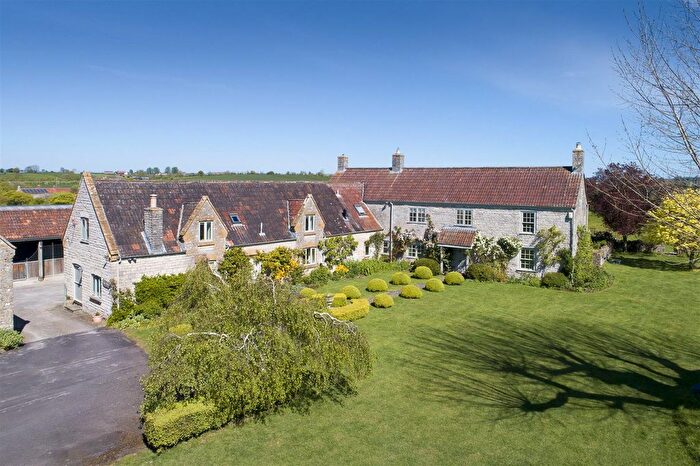
Properties in Cary have an average house price of £1.04M and had 9 Property Transactions within the last 3 years¹.
Cary is an area in Somerton, Somerset with 110 households², where the most expensive property was sold for £3M.
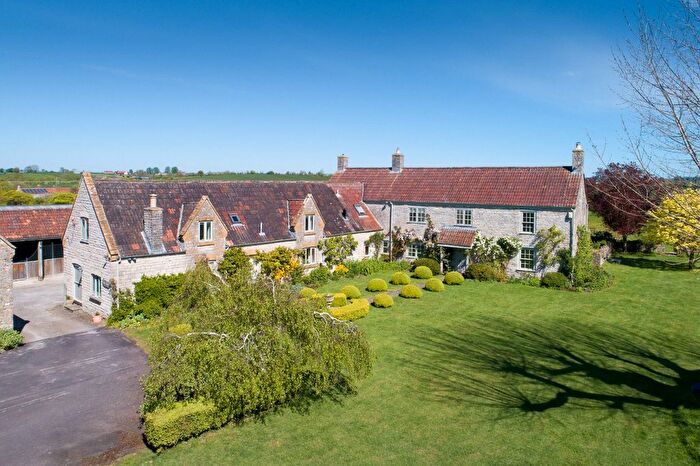
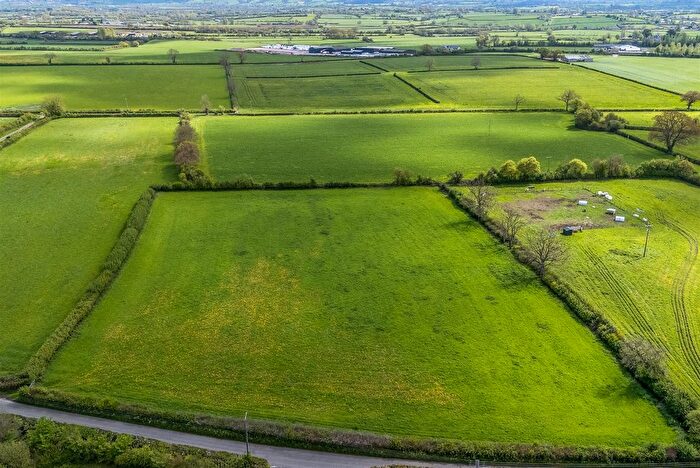
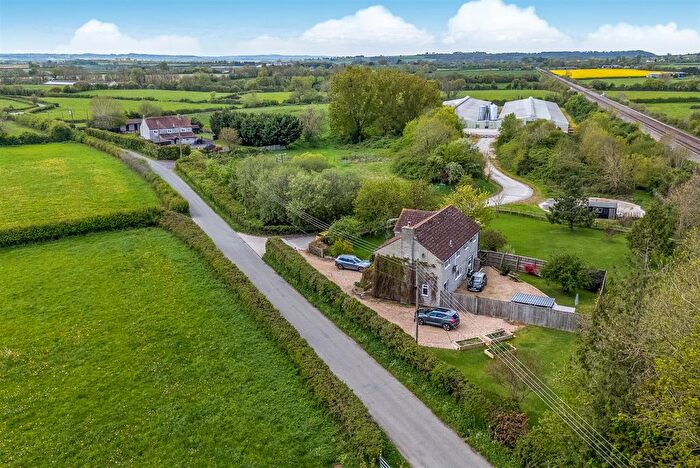
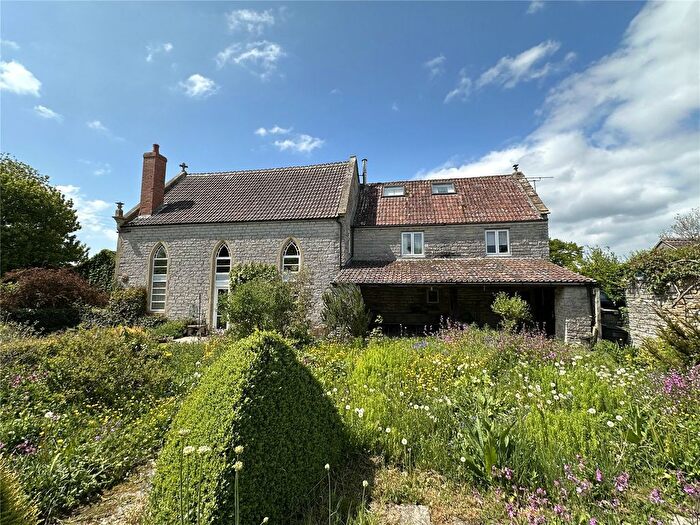
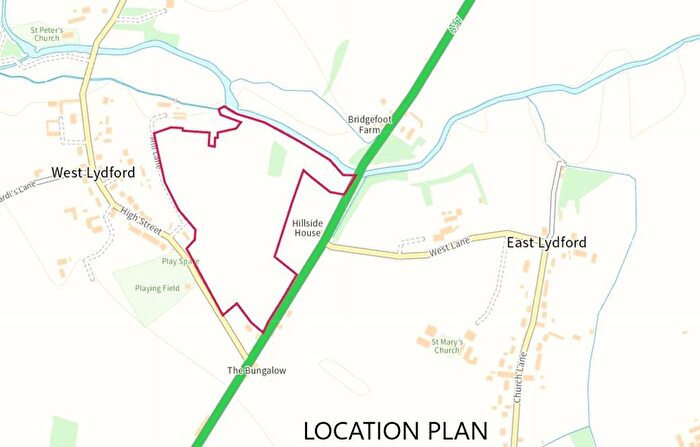
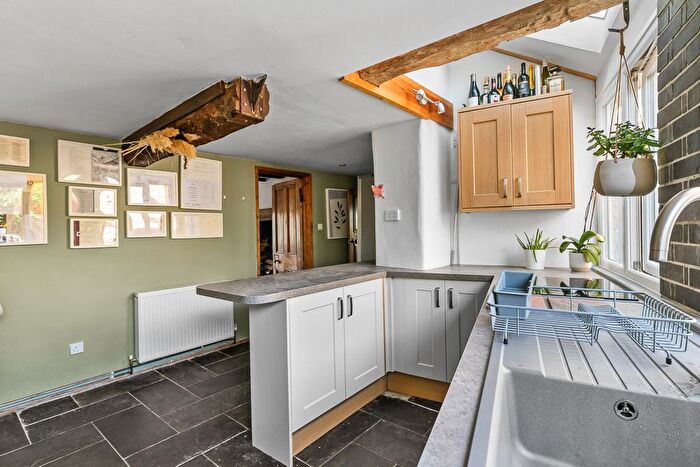
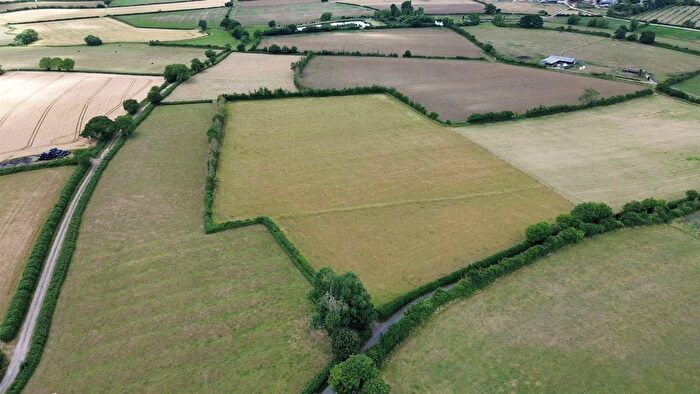
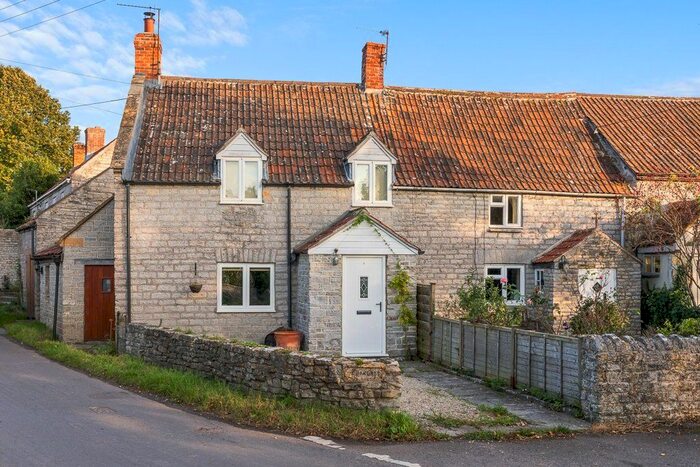
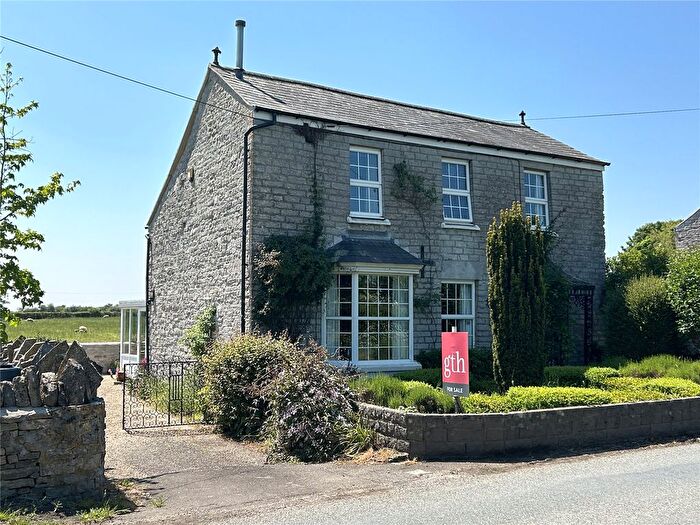
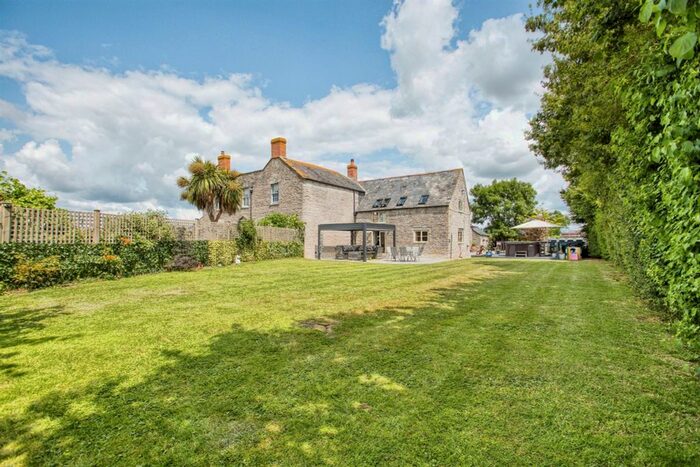
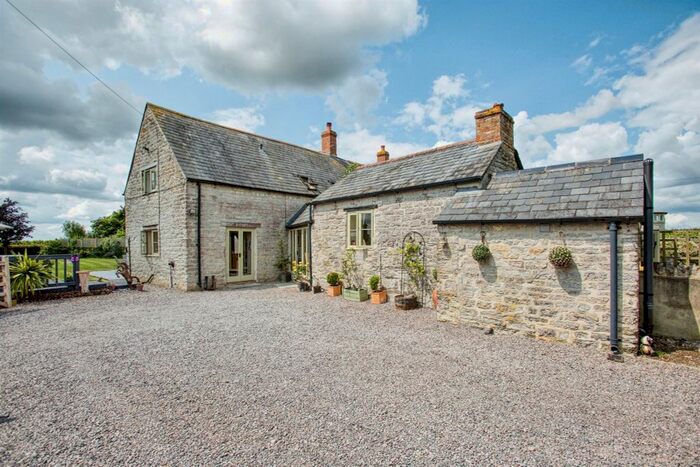
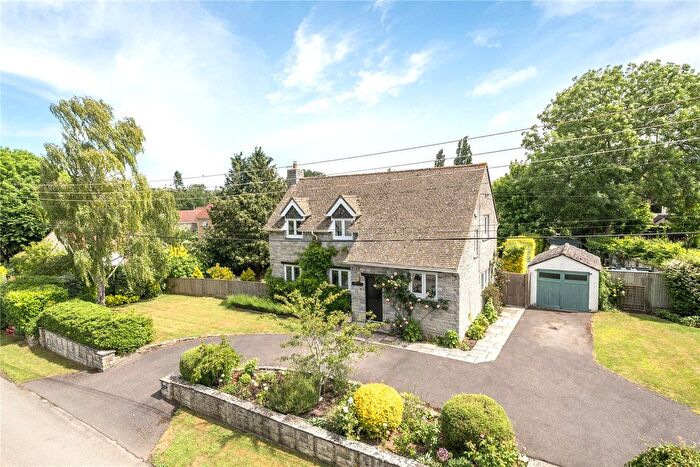
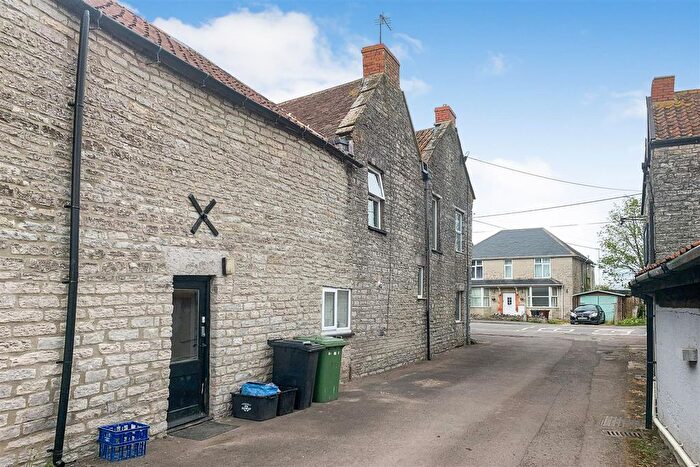
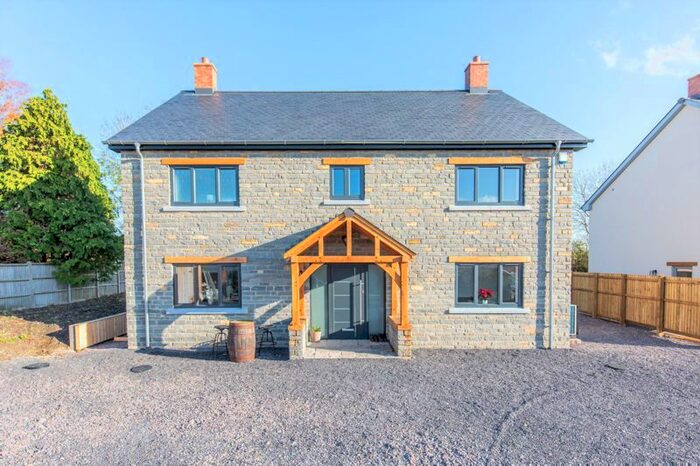
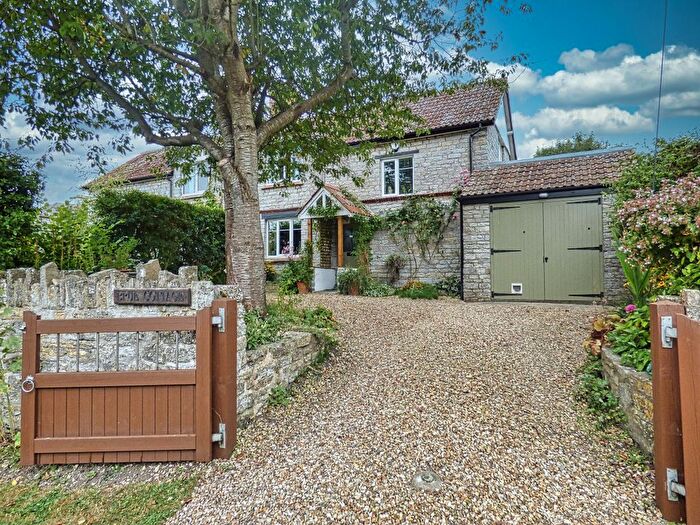
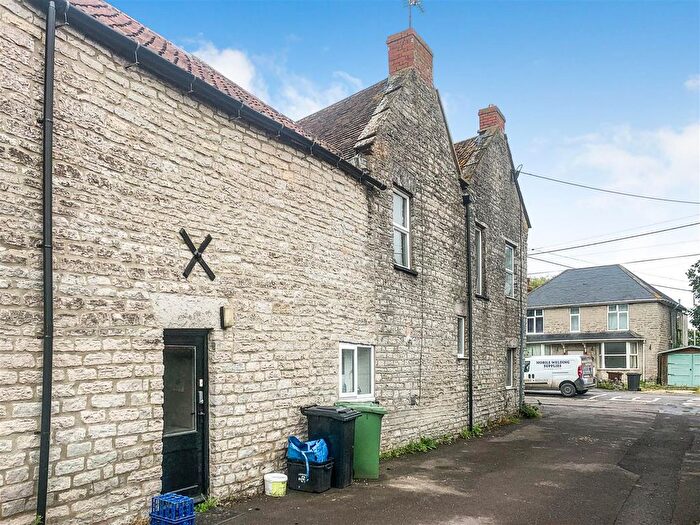
Previously listed properties in Cary
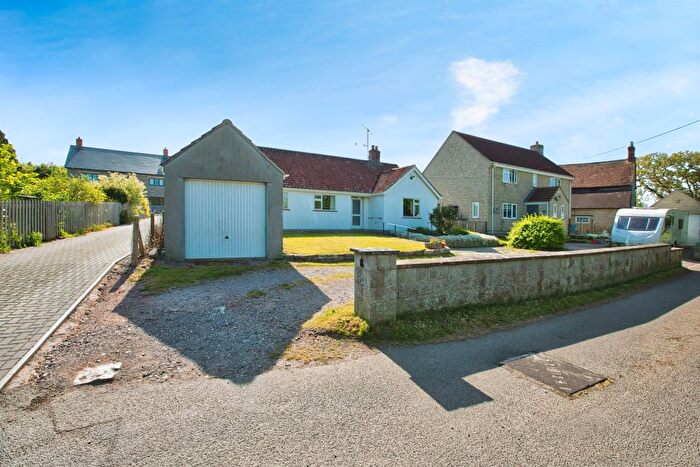
![]()
If you are looking to sell your house, let it out, or receive a property valuation, an expert can help you.
Click the button below to get started.

Roads and Postcodes in Cary
Navigate through our locations to find the location of your next house in Cary, Somerton for sale or to rent.
| Streets | Postcodes |
|---|---|
| Baker Street | TA11 7DU |
| Chapel Yard | TA11 7EN |
| Church Street | TA11 7DT |
| Foddington | TA11 7EL |
| Foddington Road | TA11 7EH |
| Main Street | TA11 7DZ |
| North Street | TA11 7EA |
| Wheathill | TA11 7HG |
| TA11 7DS TA11 7EB TA11 7ED TA11 7EE TA11 7EG TA11 7EJ TA11 7EQ TA11 7EF |
Transport near Cary
-
 Castle Cary Station
 -
Yeovil Pen Mill Station
-
Bruton Station
-
Sherborne Station
-
Yeovil Junction Station
-
Templecombe Station
- FAQ
- Price Paid By Year
- Property Type Price
Frequently asked questions about Cary
What is the average price for a property for sale in Cary?
The average price for a property for sale in Cary is £1,038,194. This amount is 152% higher than the average price in Somerton. There are 22 property listings for sale in Cary.
What streets have the most expensive properties for sale in Cary?
The street with the most expensive properties for sale in Cary is Main Street at an average of £1,072,000.
What streets have the most affordable properties for sale in Cary?
The street with the most affordable properties for sale in Cary is Baker Street at an average of £535,000.
Which train stations are available in or near Cary?
Some of the train stations available in or near Cary are Castle Cary, Yeovil Pen Mill and Bruton.
Property Price Paid in Cary by Year
The average sold property price by year was:
| Year | Average Sold Price | Price Change |
Sold Properties
|
|---|---|---|---|
| 2025 | £1,296,250 | -8% |
4 Properties |
| 2024 | £1,400,000 | 51% |
1 Property |
| 2023 | £689,687 | 30% |
4 Properties |
| 2022 | £483,650 | -50% |
2 Properties |
| 2021 | £725,000 | 23% |
3 Properties |
| 2020 | £559,450 | 5% |
10 Properties |
| 2019 | £529,166 | 12% |
6 Properties |
| 2018 | £466,620 | 32% |
5 Properties |
| 2017 | £317,156 | -46% |
4 Properties |
| 2016 | £464,250 | 33% |
4 Properties |
| 2015 | £311,083 | -135% |
6 Properties |
| 2014 | £730,900 | 27% |
5 Properties |
| 2013 | £531,666 | 0,5% |
3 Properties |
| 2012 | £529,250 | -1% |
2 Properties |
| 2011 | £535,000 | 60% |
2 Properties |
| 2010 | £213,000 | -29% |
2 Properties |
| 2008 | £275,125 | -33% |
4 Properties |
| 2007 | £364,708 | 12% |
6 Properties |
| 2006 | £319,583 | 27% |
6 Properties |
| 2005 | £234,021 | 13% |
7 Properties |
| 2004 | £203,875 | -52% |
4 Properties |
| 2003 | £310,833 | 36% |
3 Properties |
| 2002 | £199,741 | -19% |
9 Properties |
| 2001 | £237,500 | -8% |
4 Properties |
| 2000 | £255,857 | 66% |
7 Properties |
| 1999 | £88,166 | -47% |
3 Properties |
| 1998 | £129,250 | -8% |
2 Properties |
| 1997 | £139,000 | 47% |
5 Properties |
| 1996 | £74,200 | 22% |
7 Properties |
| 1995 | £58,000 | - |
1 Property |
Property Price per Property Type in Cary
Here you can find historic sold price data in order to help with your property search.
The average Property Paid Price for specific property types in the last three years are:
| Property Type | Average Sold Price | Sold Properties |
|---|---|---|
| Semi Detached House | £464,000.00 | 2 Semi Detached Houses |
| Terraced House | £290,000.00 | 1 Terraced House |
| Detached House | £1,354,291.00 | 6 Detached Houses |