Houses for sale & to rent in Northstone, Somerton
House Prices in Northstone
Properties in Northstone have an average house price of £457,779.00 and had 89 Property Transactions within the last 3 years¹.
Northstone is an area in Somerton, Somerset with 1,172 households², where the most expensive property was sold for £1,410,000.00.
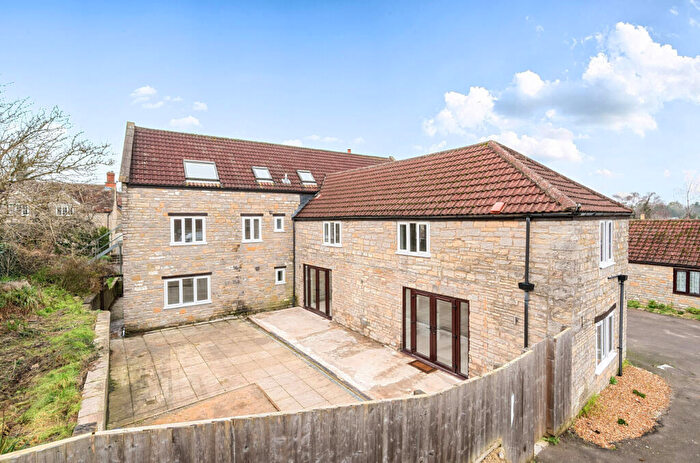
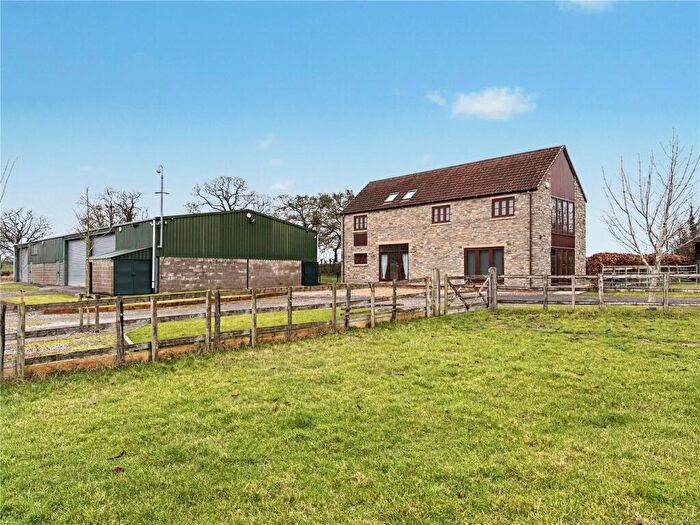
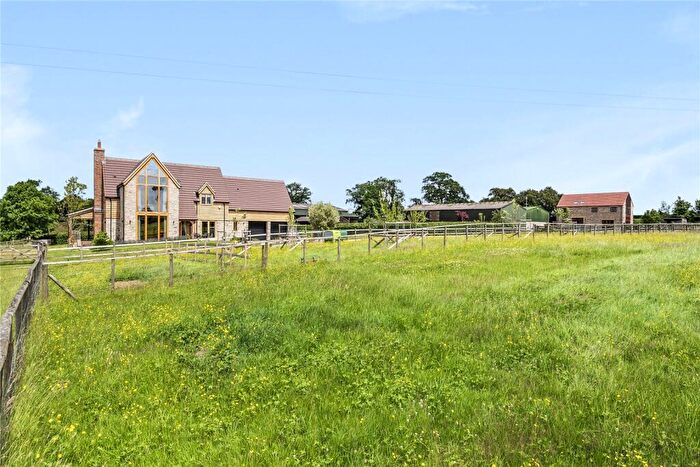
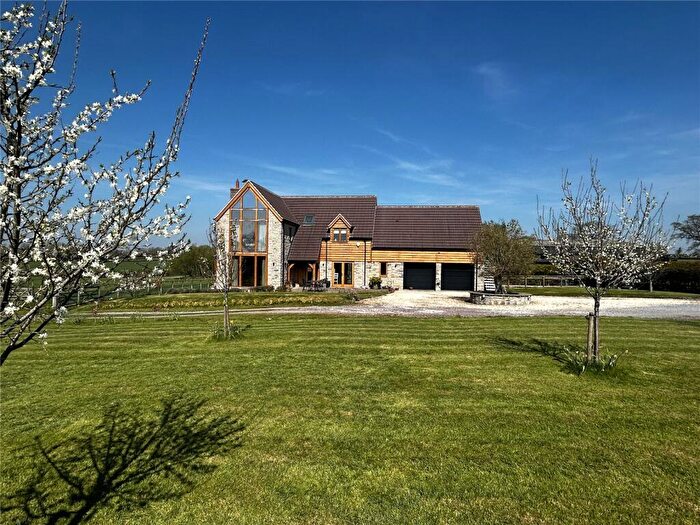
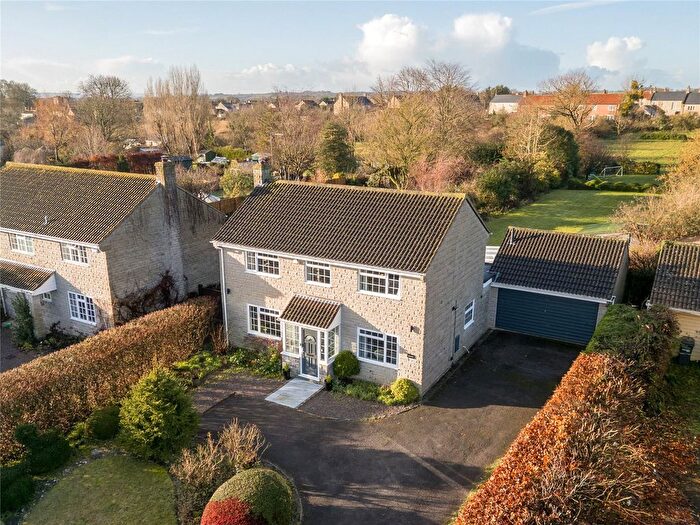
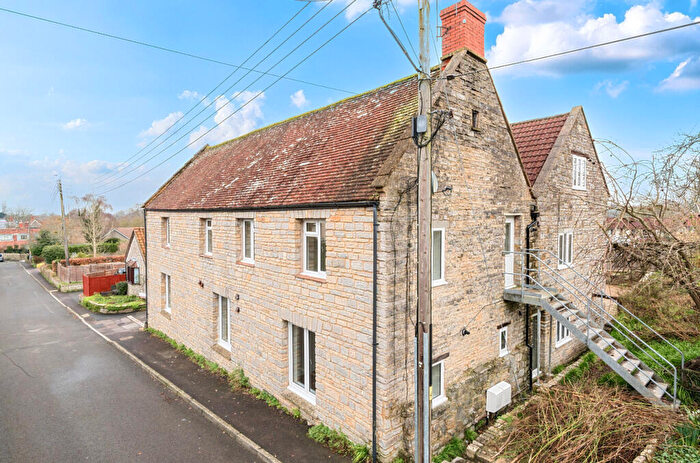
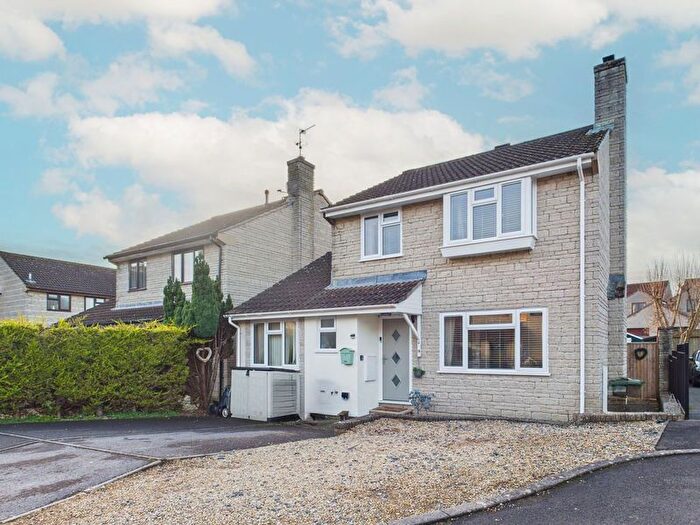
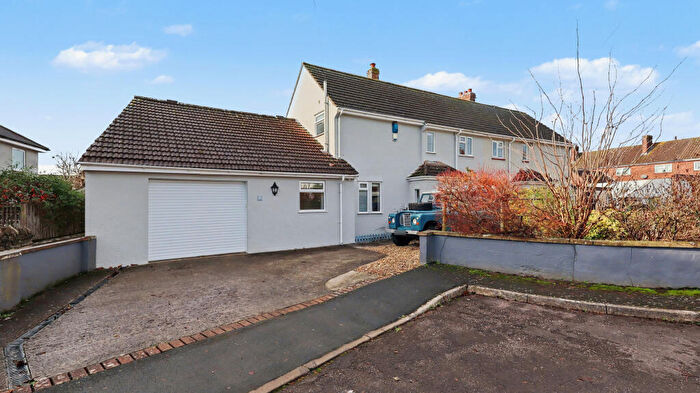
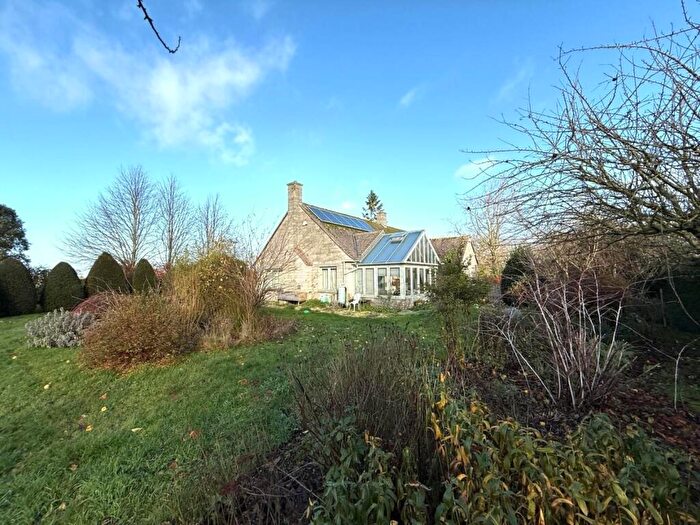
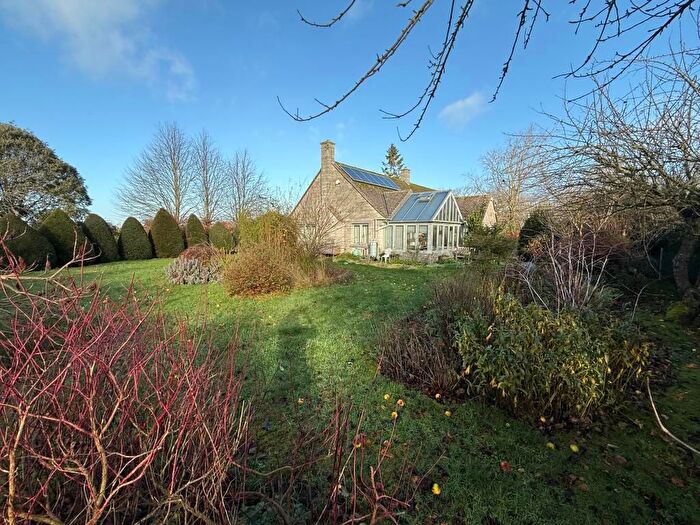
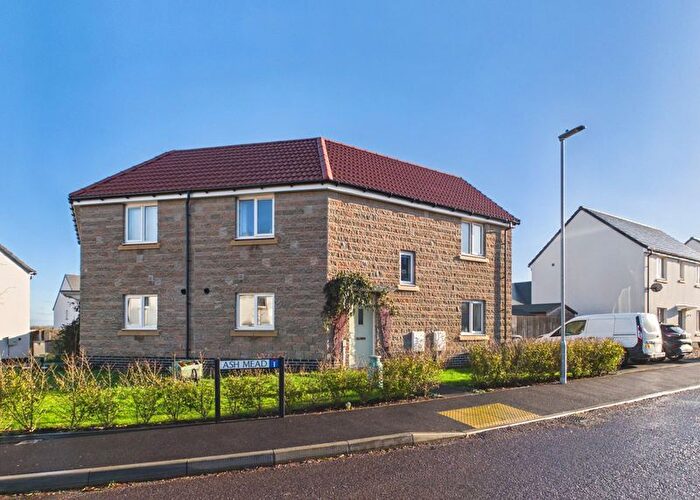
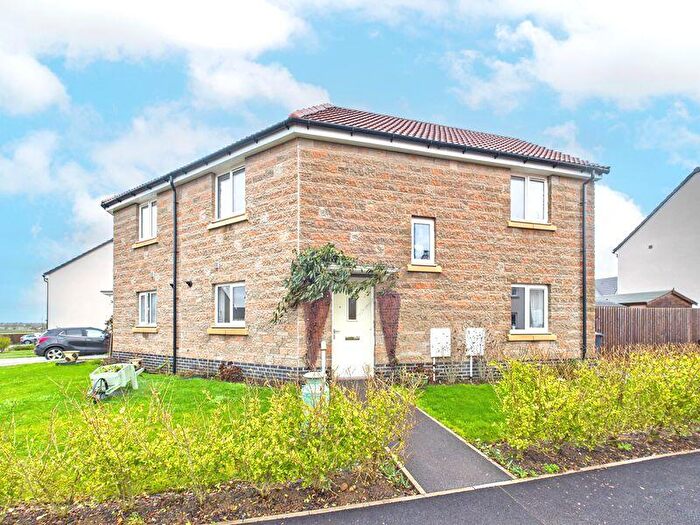
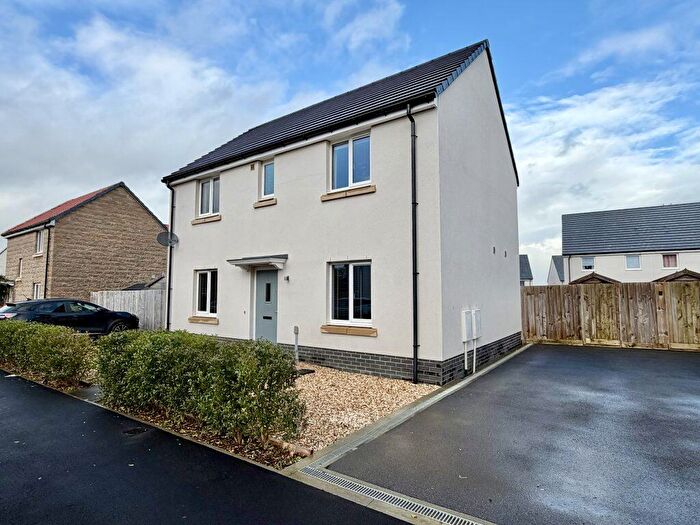
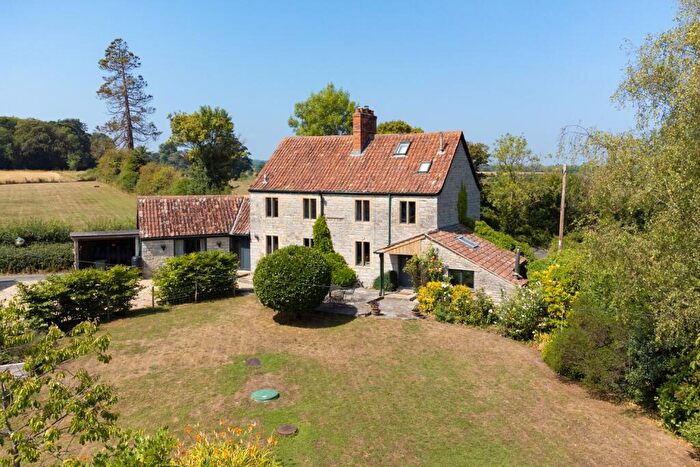
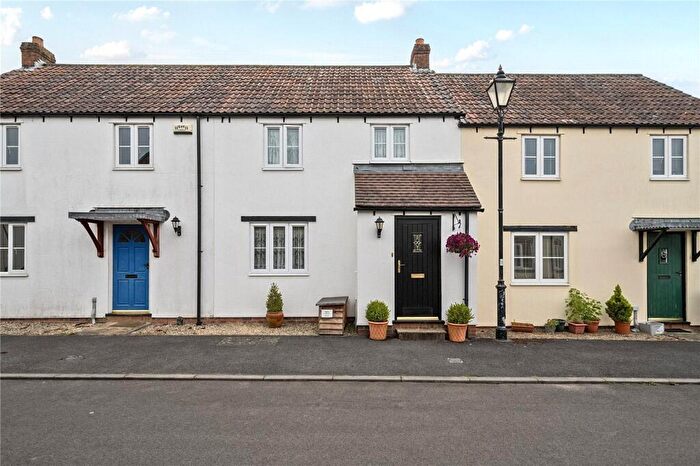
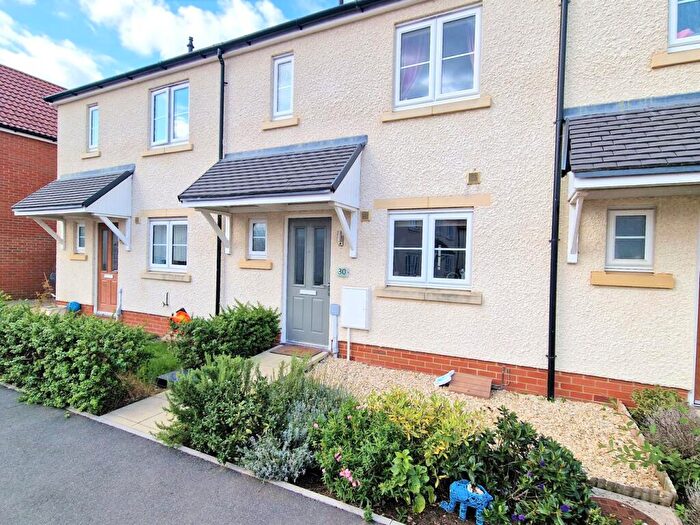
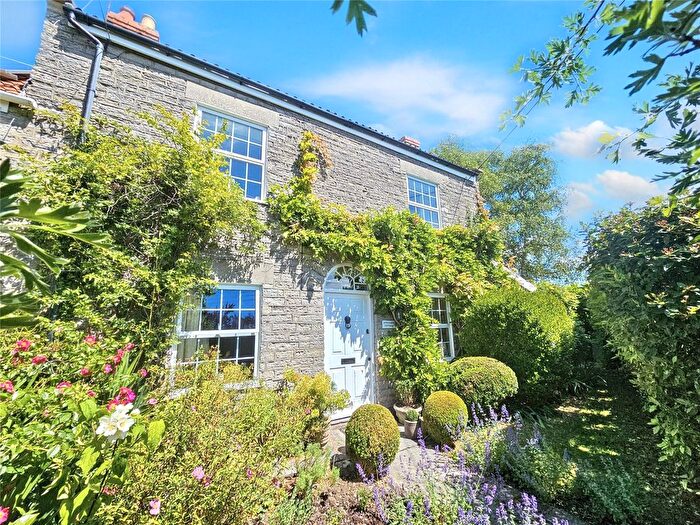
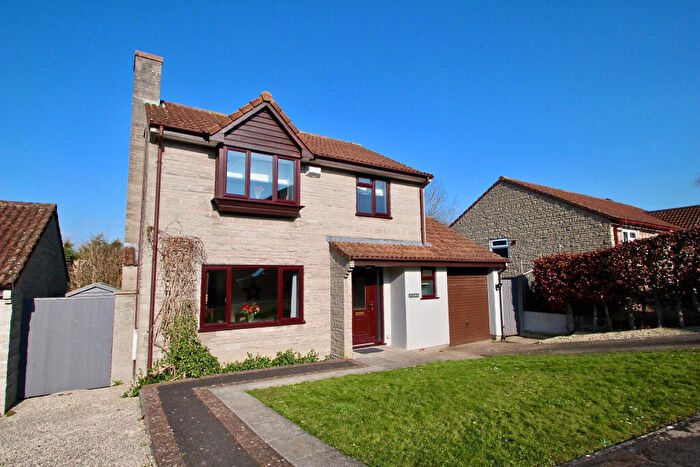
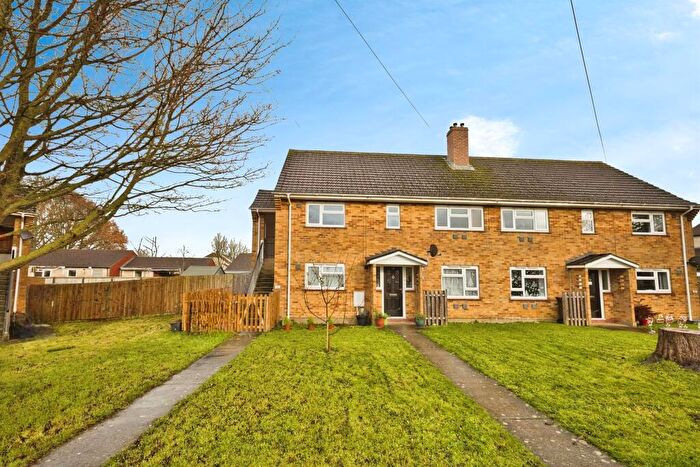
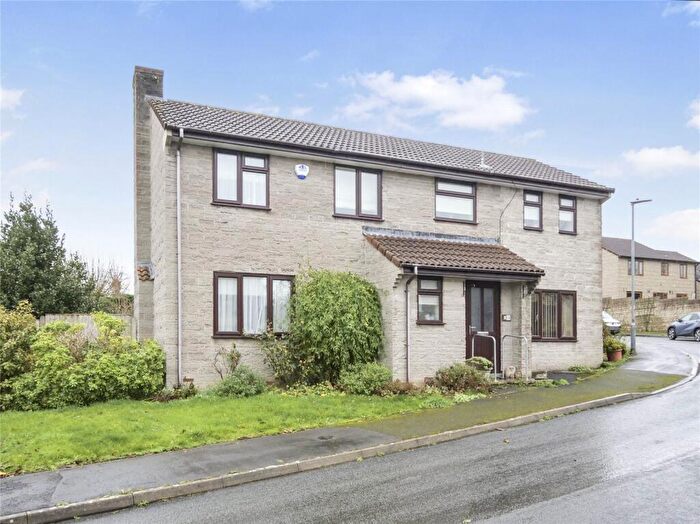
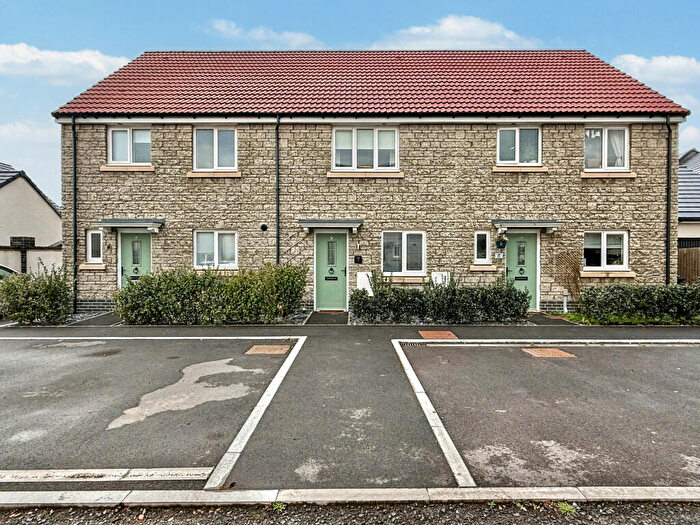
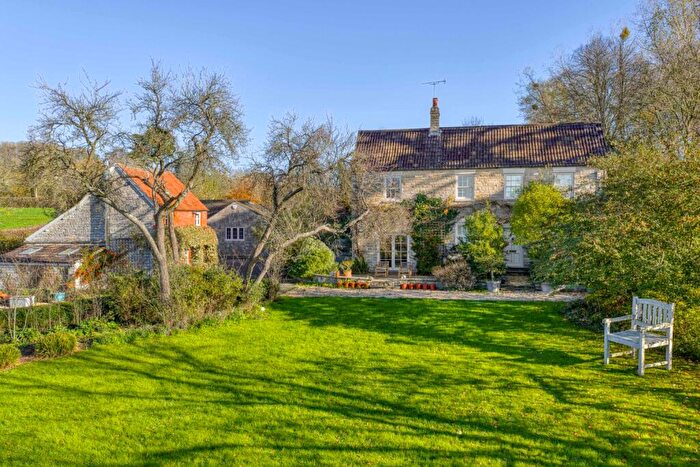
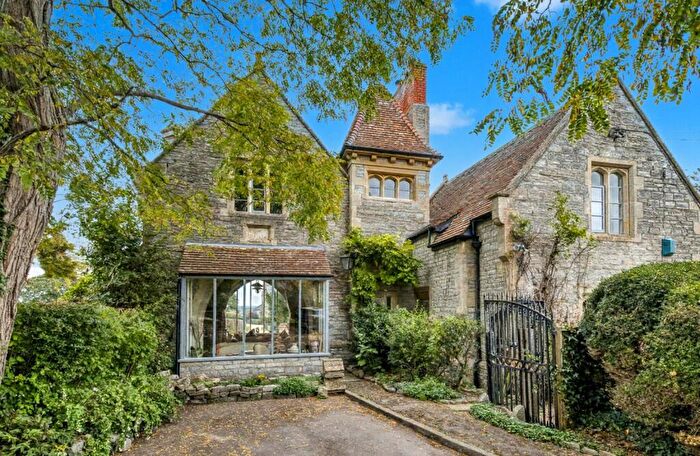
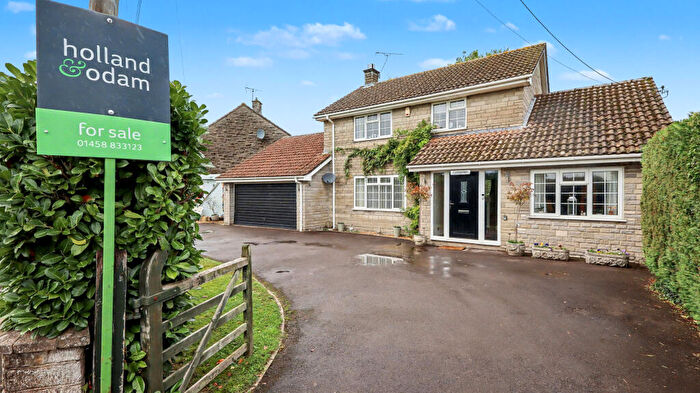
Properties for sale in Northstone
Roads and Postcodes in Northstone
Navigate through our locations to find the location of your next house in Northstone, Somerton for sale or to rent.
| Streets | Postcodes |
|---|---|
| Amberley Close | TA11 6EU |
| Barton Road | TA11 6BL TA11 6EA |
| Blind Lane | TA11 6BW |
| Broad Street | TA11 7AT TA11 7AY |
| Broadacres | TA11 7BA |
| Broadclose Way | TA11 6BS |
| Broadway | TA11 7BB |
| Broadway Road | TA11 7AU |
| Brook Lane | TA11 6DH |
| Castle Street | TA11 6DX |
| Chapel Close | TA11 6EY |
| Chessels Lane | TA11 7BJ |
| Chistles Lane | TA11 6DP TA11 6ES |
| Church Hill | TA11 7BW |
| Church Street | TA11 6BU TA11 6BX TA11 6ER |
| Collins Lane | TA11 7BG |
| Coombe Hill | TA11 6DQ |
| Cottons Lane | TA11 6DT |
| George Close | TA11 6DW |
| George Street | TA11 7AS |
| Gosling Street | TA11 6GS |
| High Lane | TA11 6BP |
| High Street | TA11 6DZ TA11 6ED TA11 6EF TA11 7AR |
| Hillway | TA11 6AN |
| Ilchester Road | TA11 6AB TA11 6AD TA11 7AW |
| Irving Road | TA11 6ET |
| Jarmany Hill | TA11 6DA |
| Kingweston Road | TA11 6AH |
| Lower Road | TA11 7DY |
| Main Street | TA11 6BZ |
| Manor Close | TA11 7LW |
| Manor Park | TA11 6EP |
| Manor Place | TA11 6EJ |
| Mill Lane | TA11 7BQ |
| Mill Road | TA11 6BY TA11 6DF |
| Mow Barton Road | TA11 7DX |
| Neville Close | TA11 7AZ |
| Orchard Way | TA11 6EX |
| Park Close | TA11 6DJ |
| Park Lane | TA11 6DE |
| Peddles Lane | TA11 6AQ |
| Primrose Hill | TA11 7AP |
| Queen Street | TA11 6EG TA11 6EH TA11 6EL |
| Rosebank | TA11 6EQ |
| Row Lane | TA11 6EE |
| Sandpit Lane | TA11 6AJ |
| Silver Street | TA11 6DB |
| Smalls Mead | TA11 7DD |
| Somerton Lane | TA11 6AE |
| Station Road | TA11 6AG |
| The Barton | TA11 7AX |
| Top Road | TA11 7BE |
| Tout Road | TA11 7AN |
| Underwood Road | TA11 7LQ |
| West Charlton | TA11 7AL |
| Withy Hays Road | TA11 7BL |
| Withy Lane | TA11 6DD |
| Woods Corner | TA11 6AF |
| TA11 6BD TA11 6BN TA11 6DY TA11 6EB TA11 6EN TA11 6EW TA11 7AJ TA11 7HU TA11 7JU TA11 7JX TA11 7JZ TA11 7LA TA11 7LE TA11 7LF TA11 7LG TA11 7LJ TA11 7LL TA11 7LN |
Transport near Northstone
- FAQ
- Price Paid By Year
- Property Type Price
Frequently asked questions about Northstone
What is the average price for a property for sale in Northstone?
The average price for a property for sale in Northstone is £457,779. This amount is 15% higher than the average price in Somerton. There are 490 property listings for sale in Northstone.
What streets have the most expensive properties for sale in Northstone?
The streets with the most expensive properties for sale in Northstone are Barton Road at an average of £857,500, Gosling Street at an average of £797,000 and George Street at an average of £635,600.
What streets have the most affordable properties for sale in Northstone?
The streets with the most affordable properties for sale in Northstone are Neville Close at an average of £148,000, Underwood Road at an average of £150,000 and Row Lane at an average of £182,500.
Which train stations are available in or near Northstone?
Some of the train stations available in or near Northstone are Castle Cary, Yeovil Pen Mill and Yeovil Junction.
Property Price Paid in Northstone by Year
The average sold property price by year was:
| Year | Average Sold Price | Price Change |
Sold Properties
|
|---|---|---|---|
| 2025 | £457,043 | 6% |
32 Properties |
| 2024 | £430,455 | -12% |
27 Properties |
| 2023 | £483,156 | -26% |
30 Properties |
| 2022 | £610,150 | 17% |
33 Properties |
| 2021 | £506,509 | 11% |
53 Properties |
| 2020 | £452,341 | 31% |
51 Properties |
| 2019 | £311,689 | -28% |
39 Properties |
| 2018 | £398,795 | 12% |
33 Properties |
| 2017 | £351,057 | 16% |
55 Properties |
| 2016 | £295,584 | -1% |
48 Properties |
| 2015 | £299,797 | -1% |
39 Properties |
| 2014 | £301,483 | 6% |
42 Properties |
| 2013 | £282,511 | 9% |
39 Properties |
| 2012 | £257,405 | -23% |
29 Properties |
| 2011 | £316,679 | 17% |
36 Properties |
| 2010 | £262,358 | -5% |
36 Properties |
| 2009 | £275,432 | -9% |
37 Properties |
| 2008 | £300,818 | -3% |
29 Properties |
| 2007 | £310,906 | 18% |
69 Properties |
| 2006 | £255,812 | -12% |
58 Properties |
| 2005 | £285,267 | 2% |
35 Properties |
| 2004 | £279,191 | 19% |
52 Properties |
| 2003 | £226,853 | 13% |
63 Properties |
| 2002 | £198,219 | 20% |
60 Properties |
| 2001 | £158,271 | -21% |
68 Properties |
| 2000 | £191,757 | 21% |
61 Properties |
| 1999 | £151,257 | 10% |
56 Properties |
| 1998 | £136,217 | 24% |
50 Properties |
| 1997 | £104,149 | 9% |
58 Properties |
| 1996 | £94,998 | 6% |
63 Properties |
| 1995 | £89,423 | - |
43 Properties |
Property Price per Property Type in Northstone
Here you can find historic sold price data in order to help with your property search.
The average Property Paid Price for specific property types in the last three years are:
| Property Type | Average Sold Price | Sold Properties |
|---|---|---|
| Semi Detached House | £389,048.00 | 29 Semi Detached Houses |
| Detached House | £538,755.00 | 47 Detached Houses |
| Terraced House | £318,346.00 | 13 Terraced Houses |

