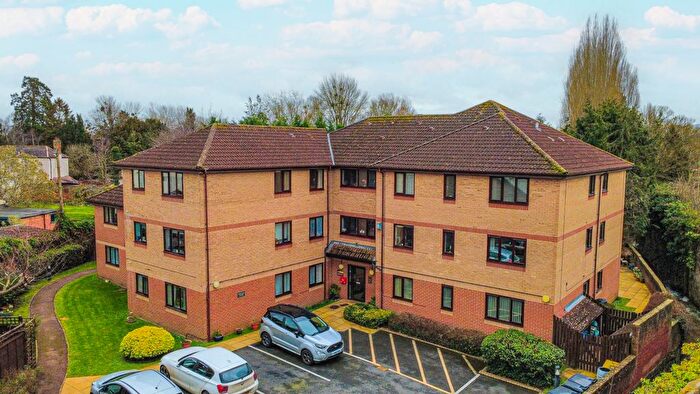
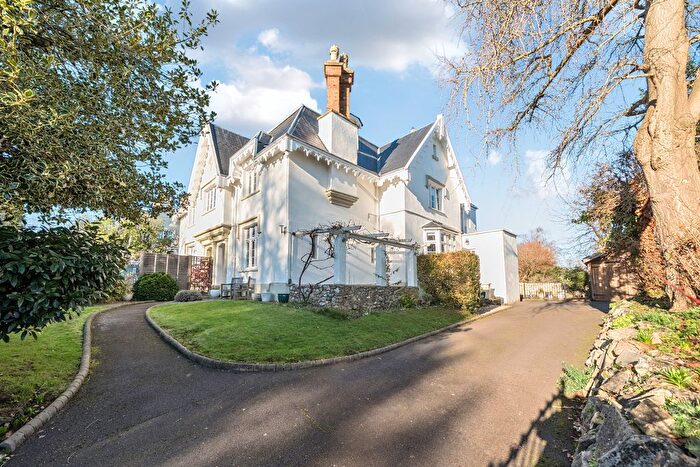
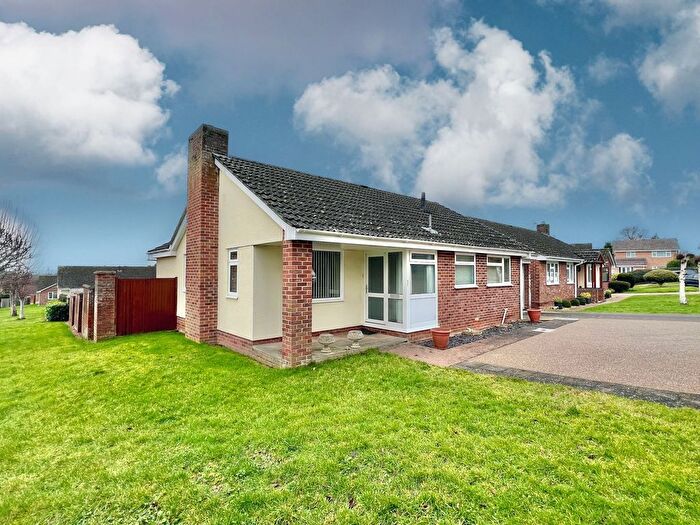
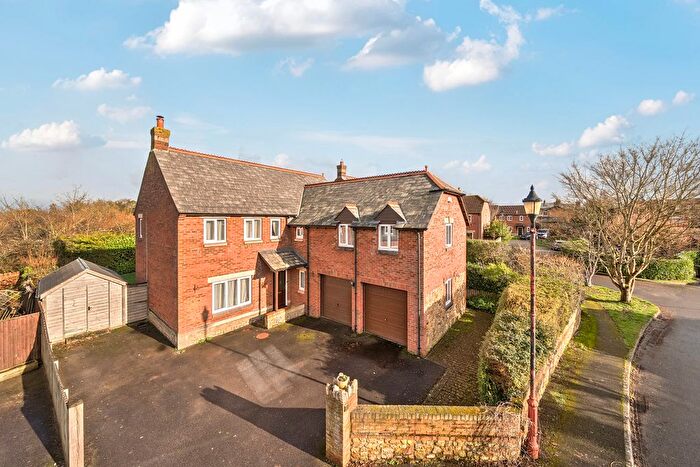
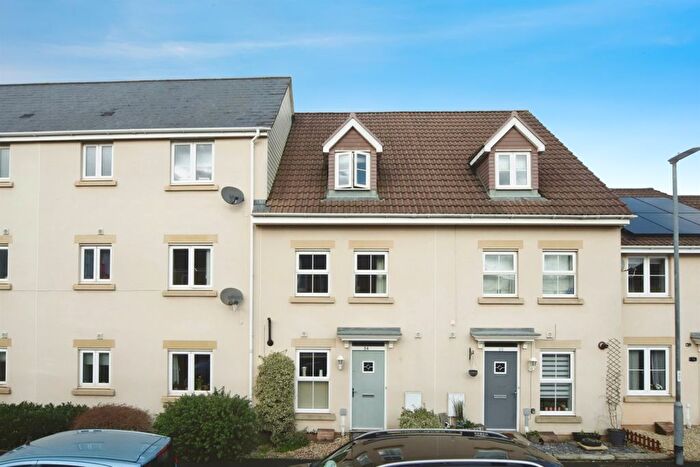
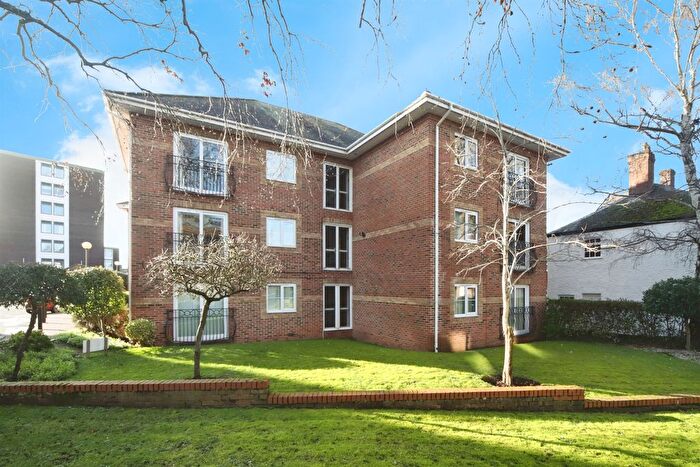
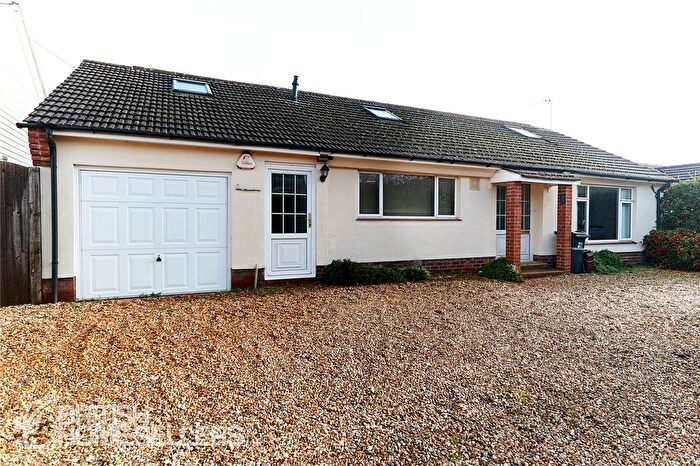
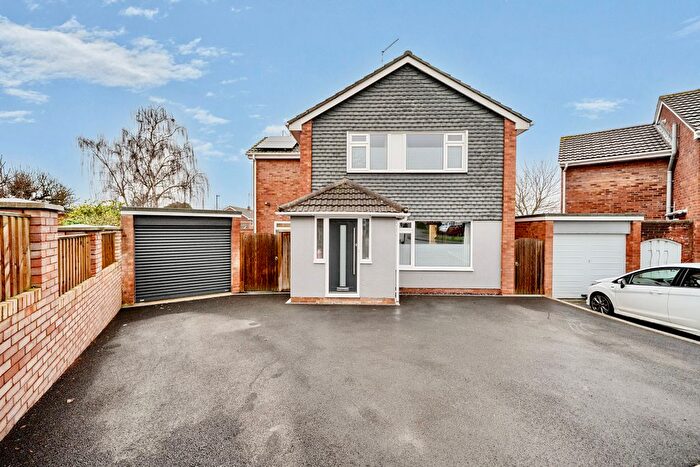
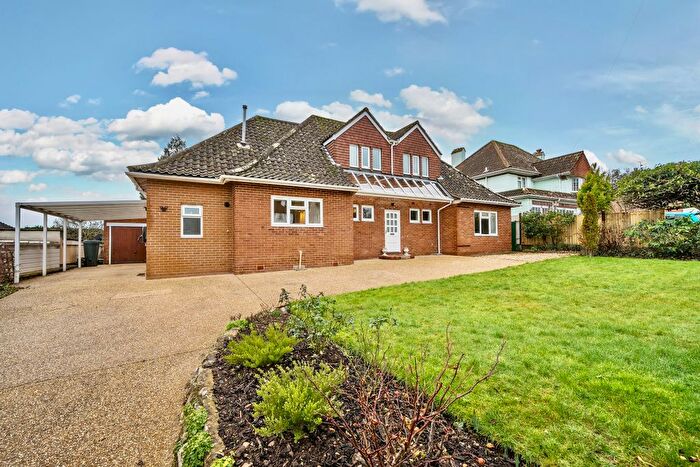
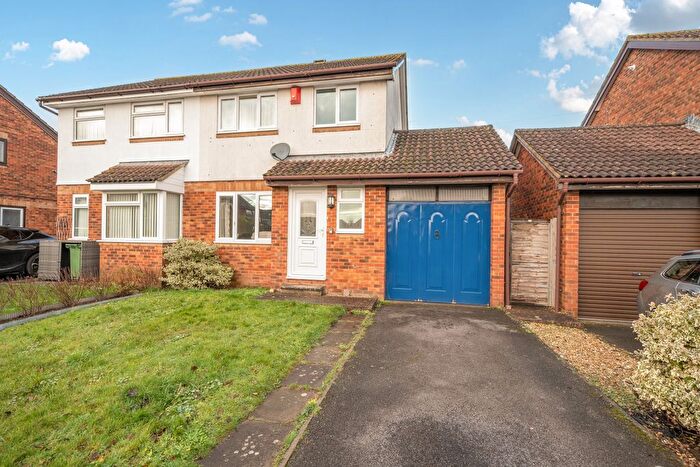
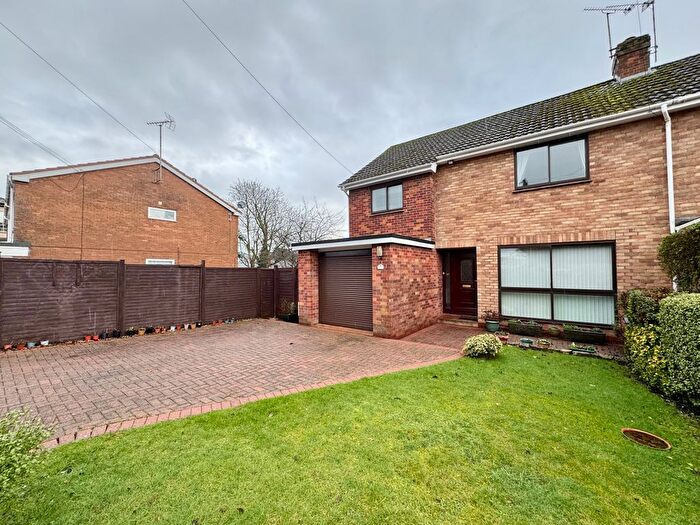
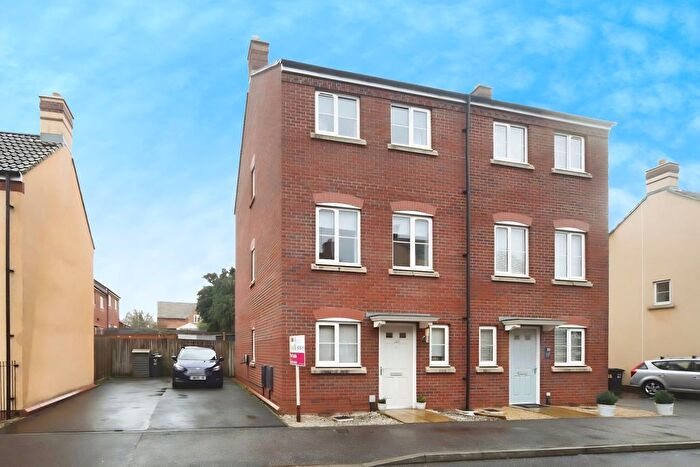
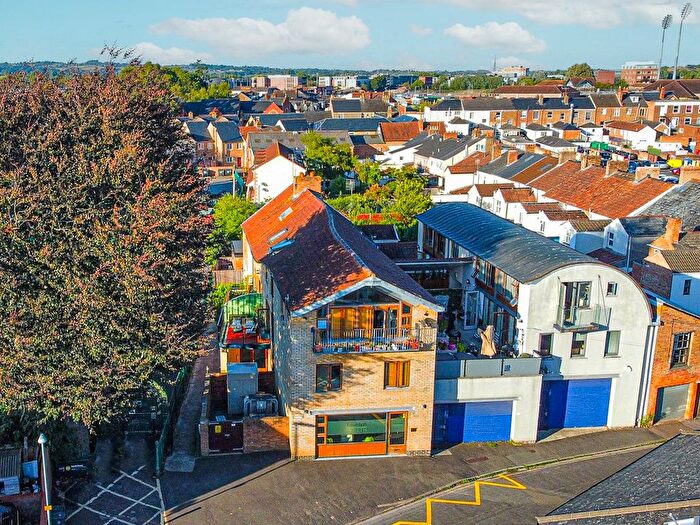
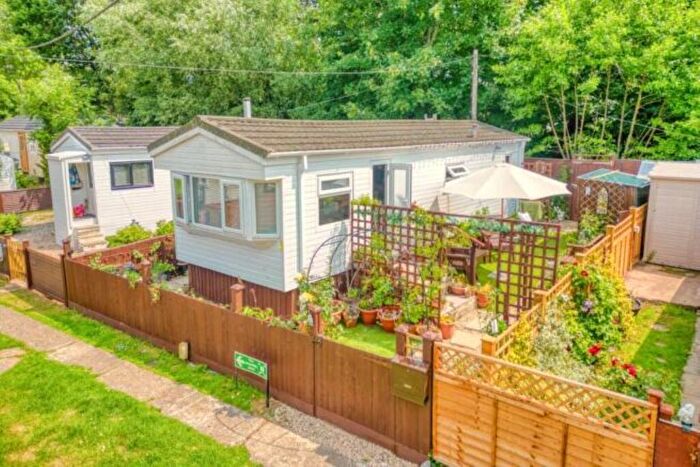
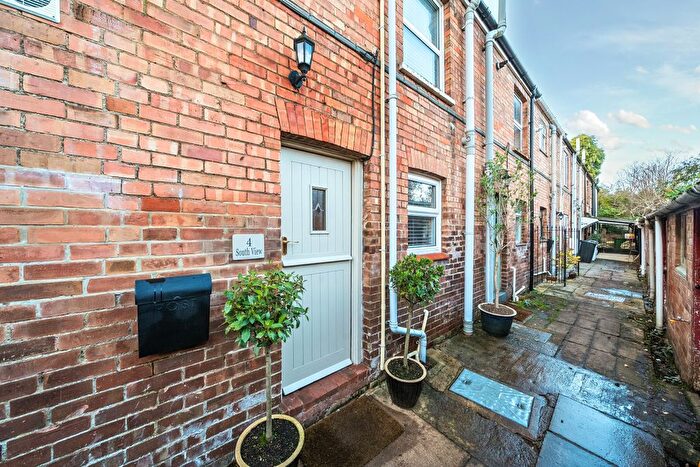
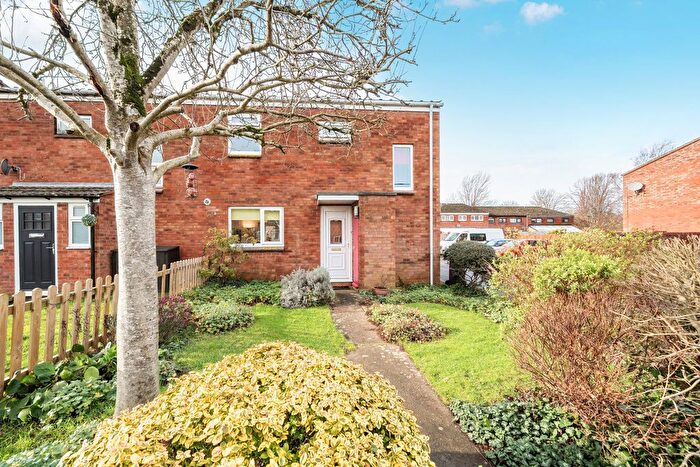
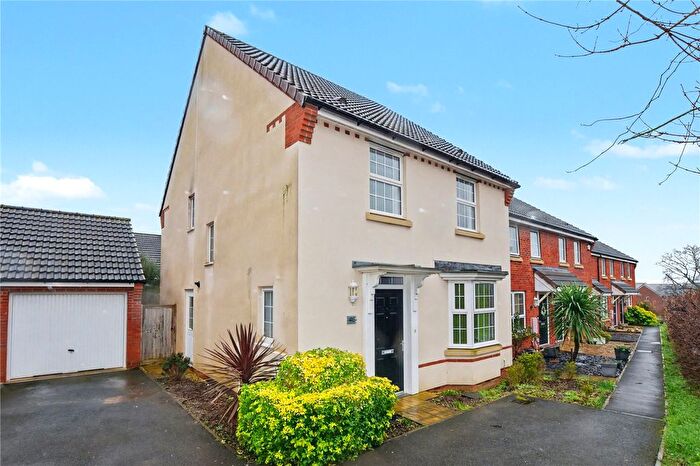
Houses for sale & to rent in Bishops Hull, Taunton
House Prices in Bishops Hull
Properties in Bishops Hull have an average house price of £330,509.00 and had 124 Property Transactions within the last 3 years¹.
Bishops Hull is an area in Taunton, Somerset with 1,498 households², where the most expensive property was sold for £1,240,000.00.
Properties for sale in Bishops Hull
Previously listed properties in Bishops Hull
Roads and Postcodes in Bishops Hull
Navigate through our locations to find the location of your next house in Bishops Hull, Taunton for sale or to rent.
| Streets | Postcodes |
|---|---|
| Ashley Road | TA1 5BP TA1 5BS |
| Badgers Close | TA1 5HL |
| Bakers Close | TA1 5HD |
| Barr | TA4 1AE |
| Belmont Road | TA1 5NS TA1 5NT TA1 5NU |
| Bishops Hull Road | TA1 5EG TA1 5EP TA1 5ER |
| Chaffinch Close | TA1 5EX |
| Church Row | TA1 5EB |
| Daws Mead | TA1 5HQ |
| Farrant Close | TA1 5EL TA1 5EN |
| Galmington Close | TA1 5NR |
| Galmington Road | TA1 5NH TA1 5NJ TA1 5NL TA1 5NN |
| Gillards | TA1 5HH TA1 5HJ |
| Gipsy Lane | TA1 5LQ |
| Great Mead | TA1 5HE |
| Gwyther Mead | TA1 5FD |
| Hamwood Cottages | TA1 5EA |
| Hamwood Terrace | TA1 5DZ |
| Haydon Close | TA1 5HF |
| Henley Road | TA1 5BJ TA1 5BL TA1 5BN TA1 5BW |
| Heron Drive | TA1 5HA TA1 5JX |
| Highfield | TA1 5LH |
| Hill Terrace | TA1 5EE |
| Jarmyns | TA1 5HG |
| Lavender Grove | TA1 5QA |
| Linnet Close | TA1 5EY |
| Lowlands Terrace | TA1 5DY |
| Manor Road | TA1 5BQ |
| Meadowside Close | TA1 5DX |
| Mill Cottages | TA4 1AD |
| Morgans Rise | TA1 5HW |
| Mountway Close | TA1 5LP |
| Mountway Lane | TA1 5GA TA1 5LW |
| Mountway Road | TA1 5DS TA1 5LR TA1 5LS TA1 5LT |
| Musgrove Road | TA1 5LB TA1 5LD TA1 5LE |
| Netherclay | TA1 5ED |
| Northfields | TA1 5DR |
| Orchard Drive | TA1 5ES |
| Parkfield Drive | TA1 5BU |
| Parsonage Court | TA1 5HR |
| Quartly Drive | TA1 5BF |
| Richmond Park | TA1 5LL TA1 5LN |
| Rumwell Cottages | TA4 1EL |
| Rumwell Park | TA4 1EH |
| Shutemead | TA1 5EJ |
| Shutewater Close | TA1 5EH |
| Shutewater Hill | TA1 5EQ |
| Shutewater Orchard | TA1 5FA TA1 5FB |
| Silkmills Road | TA1 5AA |
| Smithy | TA1 5DT TA1 5DU |
| Stonegallows | TA1 5JN TA1 5JP TA1 5JS |
| Upcott | TA4 1AG TA4 1AQ |
| Walnut Close | TA1 5HP |
| Waterfield Close | TA1 5HB |
| Wellington New Road | TA1 5LU TA1 5NF |
| Wellington Road | TA1 5AR TA1 5AS TA1 5LA TA1 5LF |
| Wren Close | TA1 5EZ |
| TA4 1EJ TA4 1EN |
Transport near Bishops Hull
- FAQ
- Price Paid By Year
- Property Type Price
Frequently asked questions about Bishops Hull
What is the average price for a property for sale in Bishops Hull?
The average price for a property for sale in Bishops Hull is £330,509. This amount is 7% higher than the average price in Taunton. There are 1,661 property listings for sale in Bishops Hull.
What streets have the most expensive properties for sale in Bishops Hull?
The streets with the most expensive properties for sale in Bishops Hull are Barr at an average of £975,000, Silkmills Road at an average of £715,000 and Stonegallows at an average of £663,000.
What streets have the most affordable properties for sale in Bishops Hull?
The streets with the most affordable properties for sale in Bishops Hull are Parsonage Court at an average of £110,125, Heron Drive at an average of £115,000 and Northfields at an average of £131,000.
Which train stations are available in or near Bishops Hull?
Some of the train stations available in or near Bishops Hull are Taunton, Bridgwater and Tiverton Parkway.
Property Price Paid in Bishops Hull by Year
The average sold property price by year was:
| Year | Average Sold Price | Price Change |
Sold Properties
|
|---|---|---|---|
| 2025 | £323,626 | -3% |
42 Properties |
| 2024 | £334,630 | 0,4% |
43 Properties |
| 2023 | £333,378 | 1% |
39 Properties |
| 2022 | £331,111 | 14% |
55 Properties |
| 2021 | £285,312 | 13% |
75 Properties |
| 2020 | £249,211 | 3% |
45 Properties |
| 2019 | £242,956 | -12% |
53 Properties |
| 2018 | £272,192 | 14% |
63 Properties |
| 2017 | £235,243 | 4% |
60 Properties |
| 2016 | £225,031 | -4% |
62 Properties |
| 2015 | £233,619 | 14% |
66 Properties |
| 2014 | £201,594 | -3% |
71 Properties |
| 2013 | £207,087 | -1% |
98 Properties |
| 2012 | £208,268 | -9% |
99 Properties |
| 2011 | £227,721 | -1% |
79 Properties |
| 2010 | £230,439 | 16% |
50 Properties |
| 2009 | £192,957 | -10% |
34 Properties |
| 2008 | £212,275 | -7% |
28 Properties |
| 2007 | £227,589 | 16% |
62 Properties |
| 2006 | £190,405 | -1% |
72 Properties |
| 2005 | £193,164 | 14% |
62 Properties |
| 2004 | £167,032 | 8% |
61 Properties |
| 2003 | £154,247 | 19% |
65 Properties |
| 2002 | £125,021 | 13% |
71 Properties |
| 2001 | £108,382 | 20% |
83 Properties |
| 2000 | £86,677 | 6% |
56 Properties |
| 1999 | £81,733 | 8% |
79 Properties |
| 1998 | £75,348 | 2% |
63 Properties |
| 1997 | £74,011 | 10% |
68 Properties |
| 1996 | £66,352 | 1% |
54 Properties |
| 1995 | £65,662 | - |
56 Properties |
Property Price per Property Type in Bishops Hull
Here you can find historic sold price data in order to help with your property search.
The average Property Paid Price for specific property types in the last three years are:
| Property Type | Average Sold Price | Sold Properties |
|---|---|---|
| Semi Detached House | £276,474.00 | 33 Semi Detached Houses |
| Detached House | £517,288.00 | 38 Detached Houses |
| Terraced House | £254,712.00 | 43 Terraced Houses |
| Flat | £124,992.00 | 10 Flats |

