
Houses for sale in Taunton, Somerset
House Prices in Taunton
Properties in Taunton have an average house price of £311k and had 4,687 Property Transactions within the last 3 years.¹
Taunton is an area in Somerset with 47,812 households², where the most expensive property was sold for £3M.
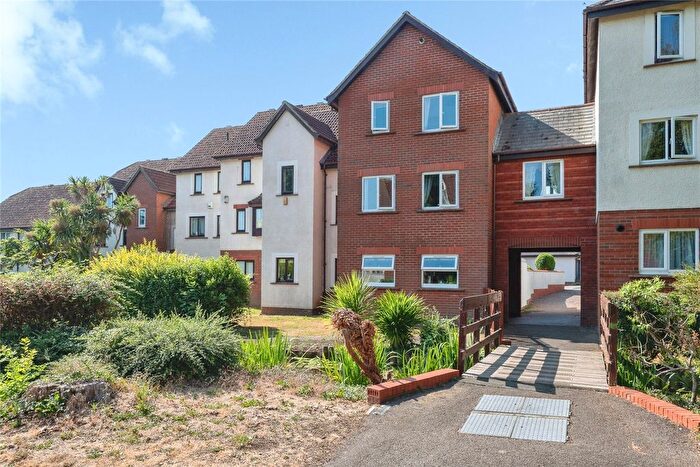
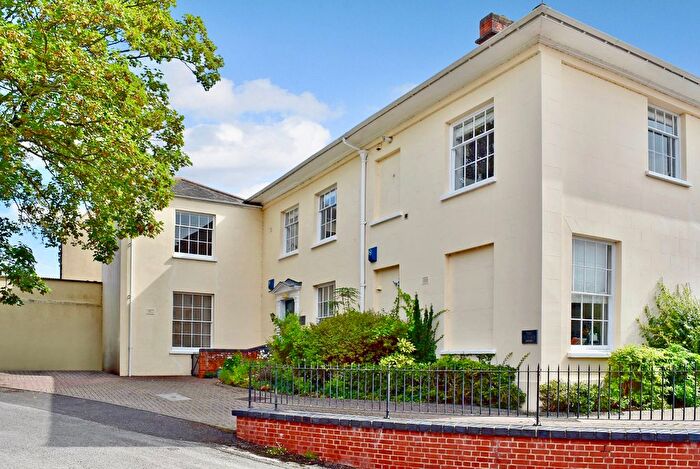
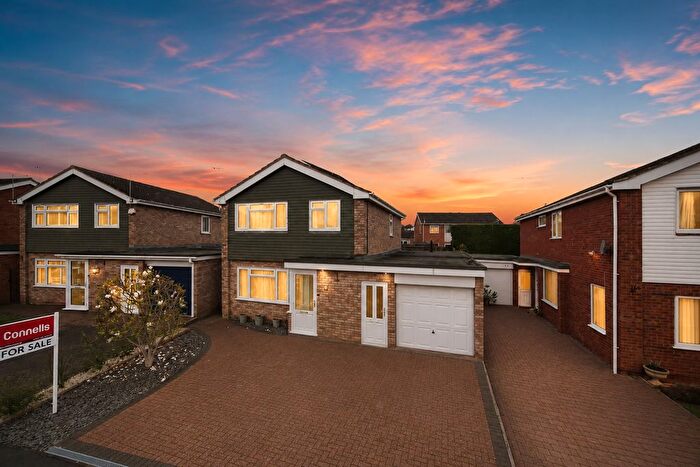
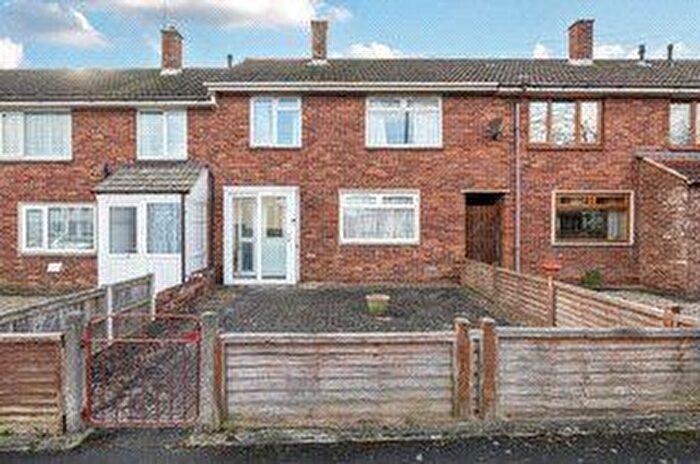
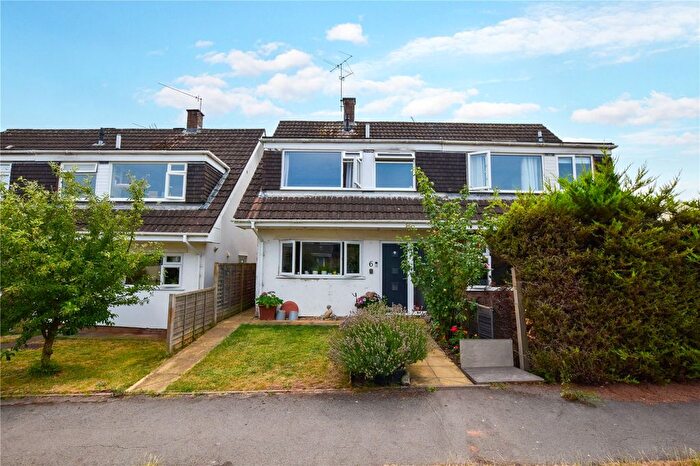
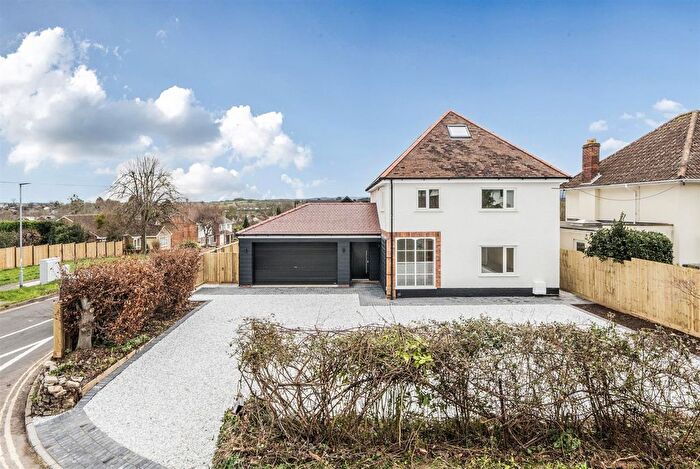
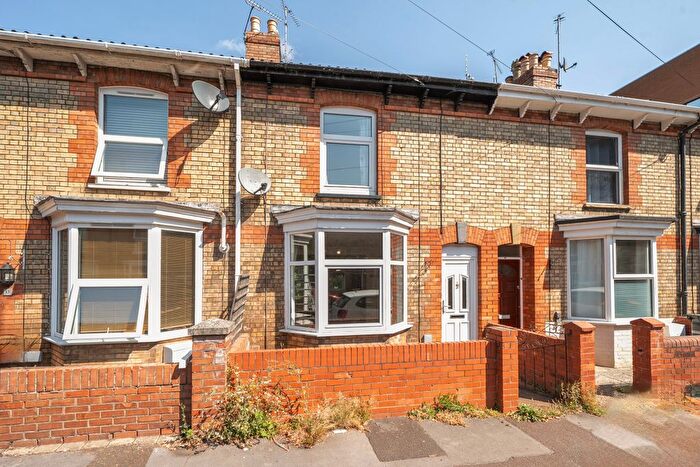
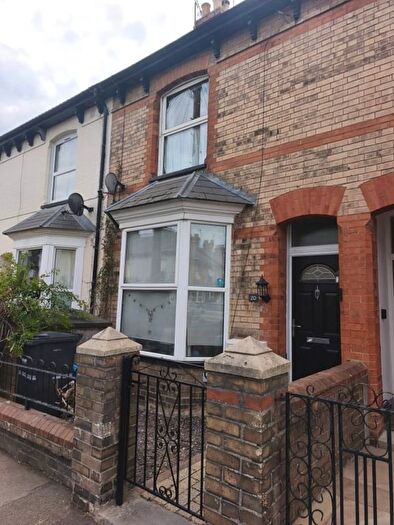
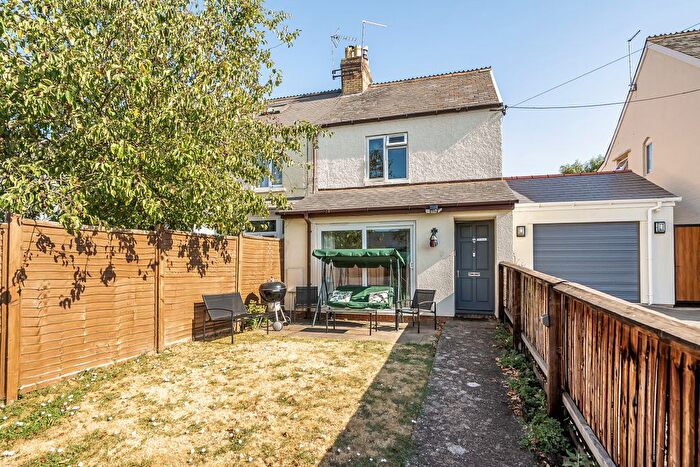
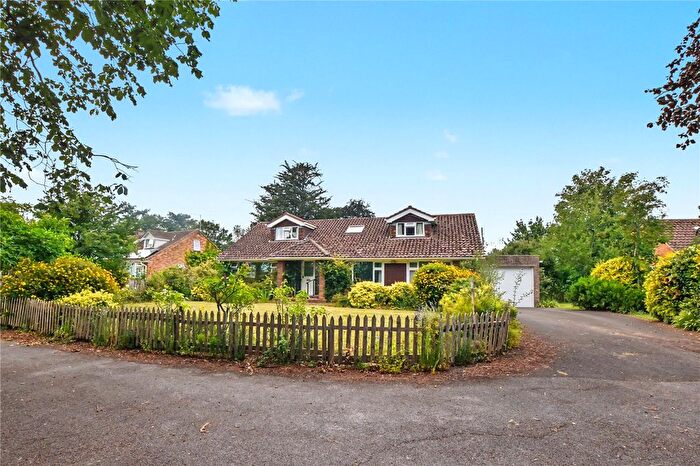
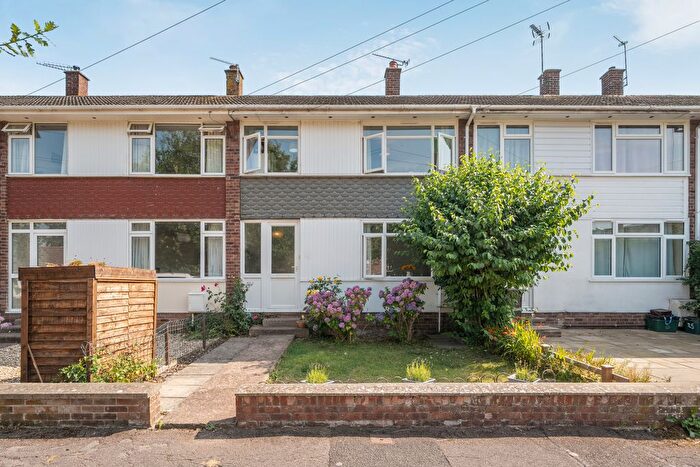
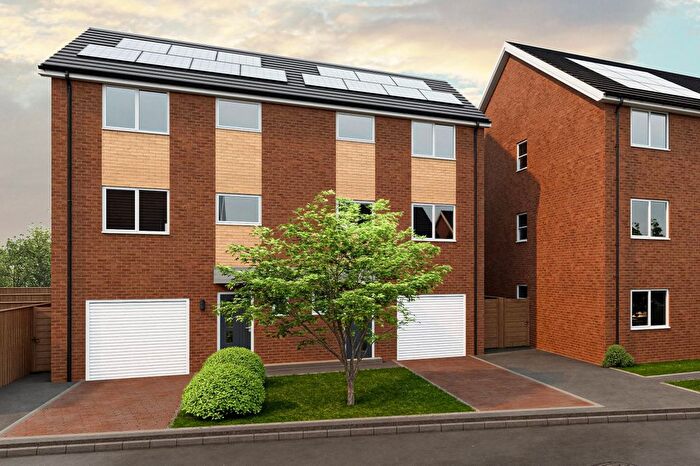
Properties for sale in Taunton
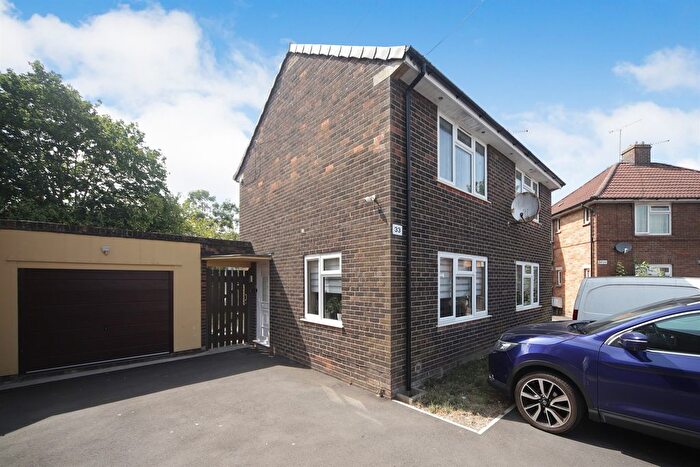
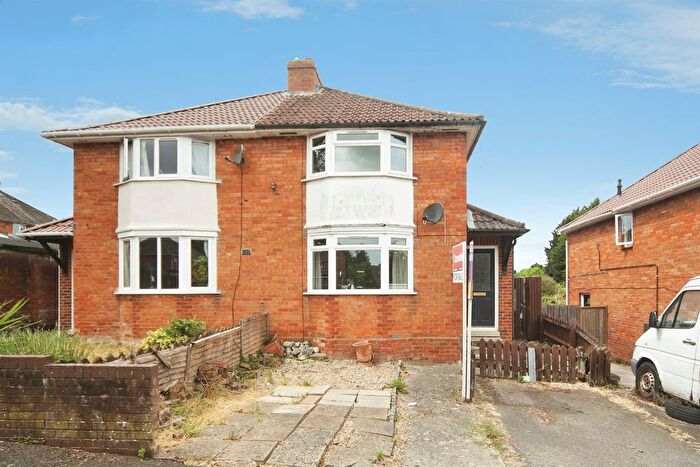
![]()
If you are looking to sell your house, let it out, or receive a property valuation, an expert can help you.
Click the button below to get started.

Neighbourhoods in Taunton
Navigate through our locations to find the location of your next house in Taunton, Somerset for sale or to rent.
- Bishops Hull
- Bishops Lydeard
- Blackdown
- Bradford-on-tone
- Brendon Hills
- Comeytrowe
- Crowcombe And Stogumber
- Islemoor
- Milverton And North Deane
- Neroche
- North Curry And Stoke St Gregory
- North Petherton
- Norton Fitzwarren
- Old Cleeve
- Ruishton And Creech
- Staplegrove
- Taunton Blackbrook And Holway
- Taunton Eastgate
- Taunton Fairwater
- Taunton Halcon
- Taunton Killams And Mountfield
- Taunton Lyngford
- Taunton Manor And Wilton
- Taunton Pyrland And Rowbarton
- Trull
- West Monkton
- West Quantock
- Williton
- Wiveliscombe And West Deane
- Priorswood
- Blackbrook & Holway
- Halcon & Lane
- West Monkton & Cheddon Fitzpaine
- Vivary
- Wilton & Sherford
- Manor & Tangier
- Comeytrowe & Bishop's Hull
- Norton Fitzwarren & Staplegrove
- Wellsprings & Rowbarton
- Creech St Michael
- North Curry & Ruishton
- Hatch & Blackdown
- Trull, Pitminster & Corfe
- Cotford St Luke & Oake
- Milverton & District
- Wiveliscombe & District
- Dulverton & District
- South Quantock
- Old Cleeve & District
- Watchet & Williton
- North Town
- Victoria
- Monkton & North Curry
- Taunton North
- Upper Tone
- Taunton East
- Bishop's Hull & Taunton West
- Taunton South
- Lydeard
- Blackdown & Neroche
- Comeytrowe & Trull
- Watchet & Stogursey
- Dunster
Property price trends in Taunton
According to the latest Land Registry data, the average home in Taunton sold for £291,603 in 2026. That figure comes from a substantial record of 60,531 sales logged over the past 31 years.
Prices have fallen back over the last three years. Compared with 2023, when the typical sale came in around £312,898, that's a fall of roughly 6.8%.
Looking back five years, average prices are down about 4.7% since 2021, a drop of around £14,226 in cash terms.
Zoom out to the past decade for the fuller picture. Back in 2016, homes here averaged £238,412, so the typical sold price has climbed about 22.3% since then, roughly 2% a year. Stretch the view to fifteen years and that annual pace holds at about 2.2%.
Frequently asked questions about Taunton
What is the average price for a property for sale in Taunton?
The average price for a property for sale in Taunton is £311,049. This amount is 2% lower than the average price in Somerset. There are more than 10,000 property listings for sale in Taunton.
What locations have the most expensive properties for sale in Taunton?
The locations with the most expensive properties for sale in Taunton are Old Cleeve & District at an average of £842,000, Brendon Hills at an average of £621,250 and South Quantock at an average of £598,600.
What locations have the most affordable properties for sale in Taunton?
The locations with the most affordable properties for sale in Taunton are Blackbrook & Holway at an average of £115,000, Taunton Eastgate at an average of £194,884 and Taunton Lyngford at an average of £222,814.
Which train stations are available in or near Taunton?
Some of the train stations available in or near Taunton are Taunton, Bridgwater and Tiverton Parkway.
Property Price Paid in Taunton by Year
The average sold property price by year was:
| Year | Average Sold Price | Price Change |
Sold Properties
|
|---|---|---|---|
| 2026 | £291,603 | -8% |
106 Properties |
| 2025 | £313,625 | 2% |
1,531 Properties |
| 2024 | £308,062 | -2% |
1,556 Properties |
| 2023 | £312,898 | -4% |
1,494 Properties |
| 2022 | £324,692 | 6% |
1,844 Properties |
| 2021 | £305,829 | 11% |
2,221 Properties |
| 2020 | £273,596 | 5% |
1,565 Properties |
| 2019 | £258,998 | - |
2,002 Properties |
| 2018 | £258,879 | 4% |
2,058 Properties |
| 2017 | £247,450 | 4% |
2,288 Properties |
Property Price per Property Type in Taunton
Here you can find historic sold price data in order to help with your property search.
The average Property Paid Price for specific property types in the last three years are:
| Property Type | Average Sold Price | Sold Properties |
|---|---|---|
| Semi Detached House | £291,076.00 | 1,180 Semi Detached Houses |
| Terraced House | £245,839.00 | 1,445 Terraced Houses |
| Detached House | £465,849.00 | 1,409 Detached Houses |
| Flat | £157,421.00 | 653 Flats |
Transport in Taunton
Please see below transportation links in this area:
