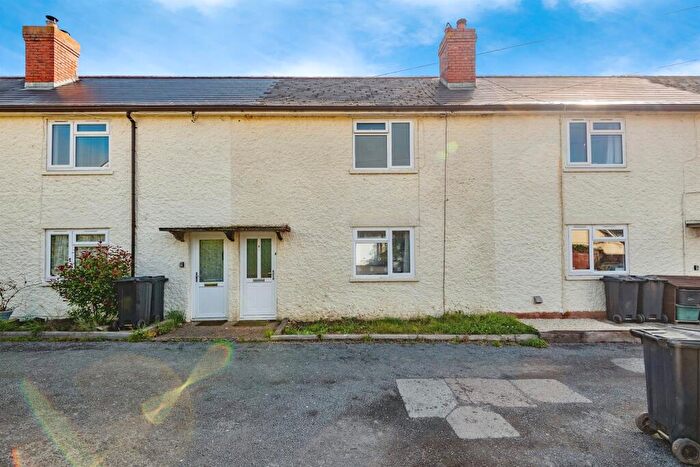
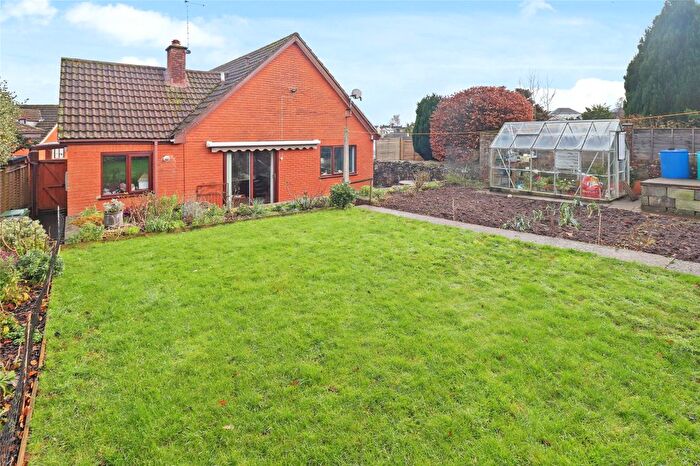
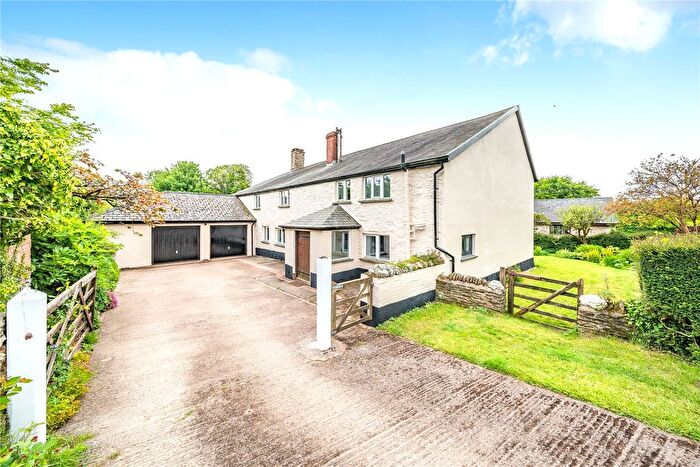
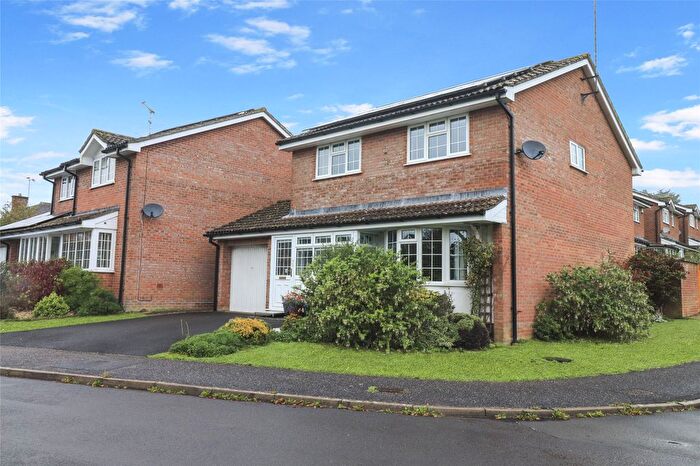
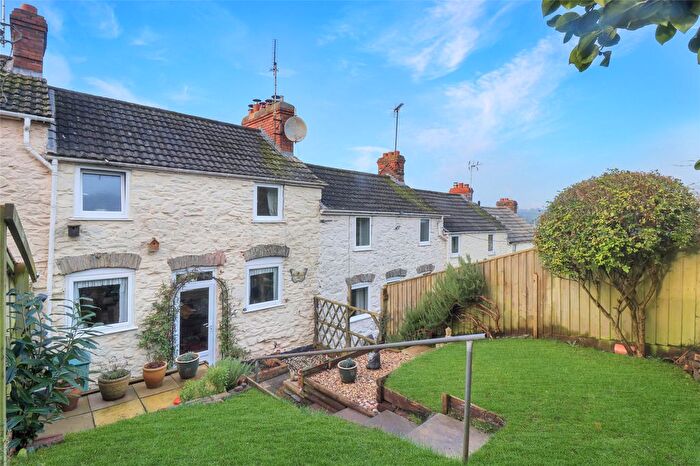
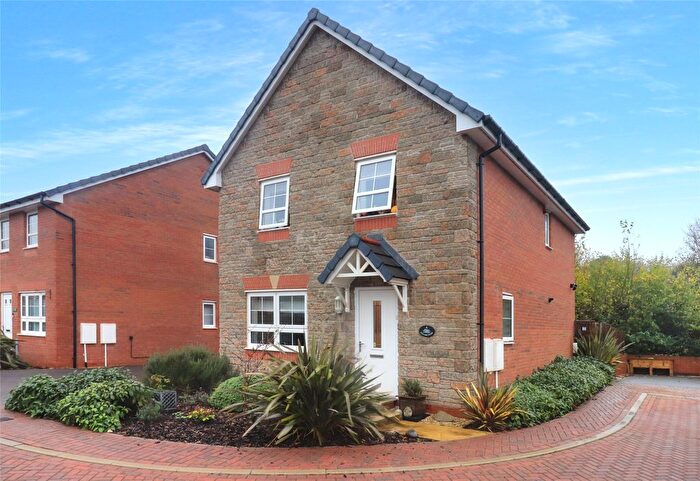
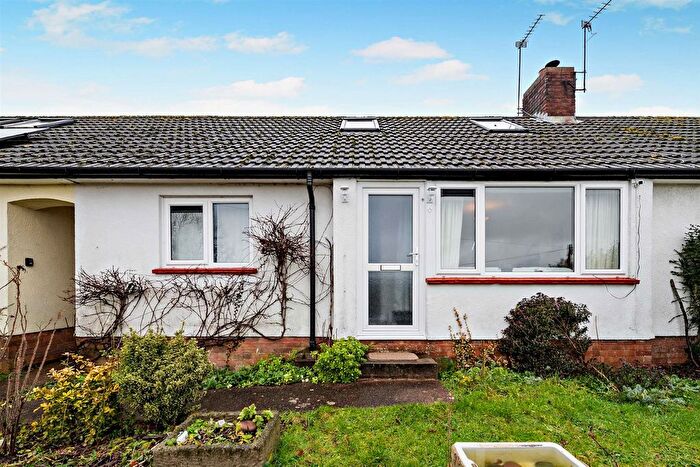
Houses for sale & to rent in Brendon Hills, Taunton
House Prices in Brendon Hills
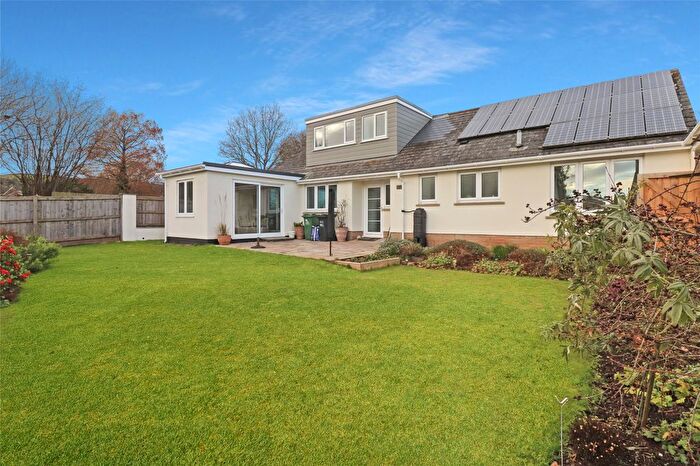
Properties in Brendon Hills have an average house price of £635,000.00 and had 11 Property Transactions within the last 3 years¹.
Brendon Hills is an area in Taunton, Somerset with 258 households², where the most expensive property was sold for £1,587,500.00.
Properties for sale in Brendon Hills
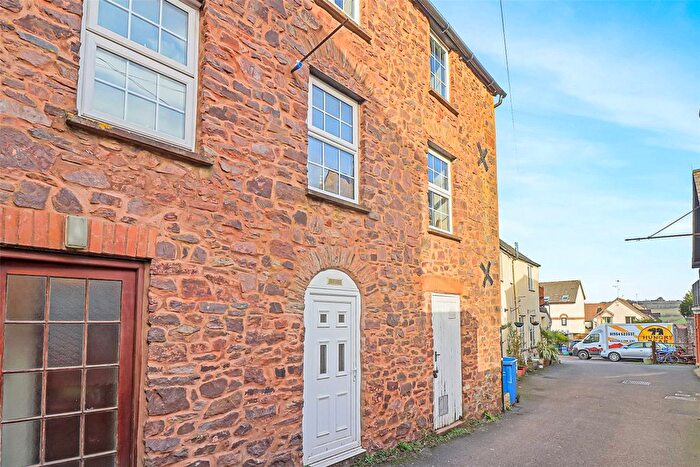
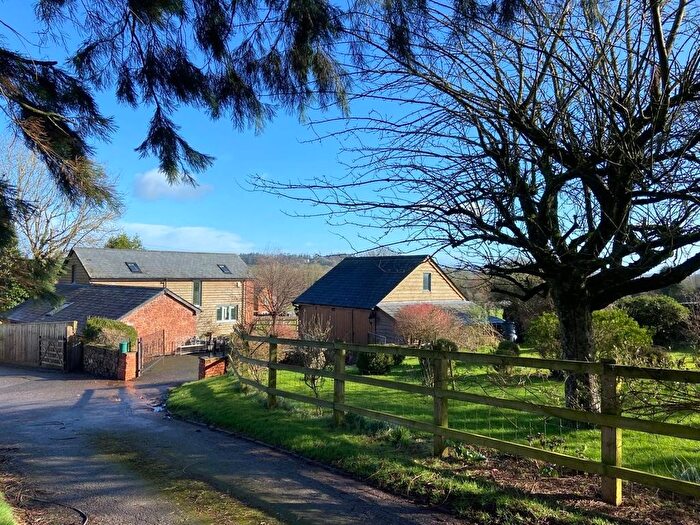
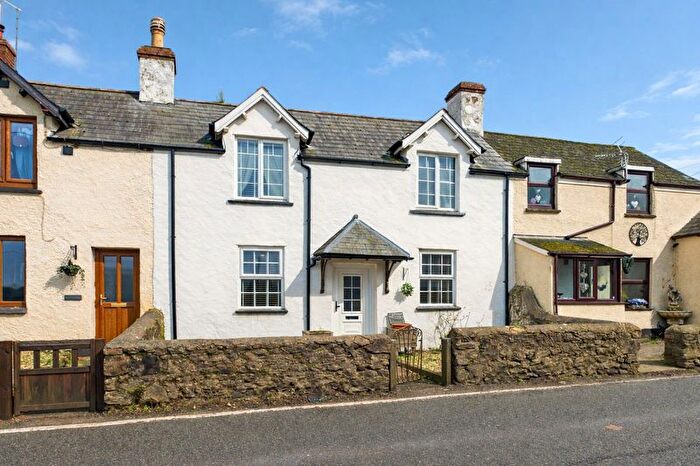
Previously listed properties in Brendon Hills
Roads and Postcodes in Brendon Hills
Navigate through our locations to find the location of your next house in Brendon Hills, Taunton for sale or to rent.
| Streets | Postcodes |
|---|---|
| Castle Cottages | TA4 2JQ |
| Haddon End Cottages | TA4 2DE |
| Longmead | TA4 2EA |
| Pitsford Hill | TA4 2RP |
| Rooks Nest | TA4 3PT |
| Skilgate | TA4 2DJ TA4 2DL TA4 2DP TA4 2DQ TA4 2DS |
| St Johns Close | TA4 2DH |
| The Barton | TA4 2HP |
| Tolland | TA4 3PS |
| Upton Farm Cottages | TA4 2JG |
| TA4 2BX TA4 2BY TA4 2BZ TA4 2DA TA4 2EE TA4 2EG TA4 2EH TA4 2EL TA4 2EN TA4 2EQ TA4 2EX TA4 2EY TA4 2EZ TA4 2HE TA4 2HG TA4 2HJ TA4 2HU TA4 2HX TA4 2JA TA4 2JE TA4 2JF TA4 2JH TA4 2QE TA4 2QG TA4 2QL TA4 2RS TA4 2RT TA4 2RU TA4 2RW TA4 2RY TA4 2RZ TA4 2SA TA4 2SG TA4 2SH TA4 2SJ TA4 3RG |
Transport near Brendon Hills
- FAQ
- Price Paid By Year
- Property Type Price
Frequently asked questions about Brendon Hills
What is the average price for a property for sale in Brendon Hills?
The average price for a property for sale in Brendon Hills is £635,000. This amount is 105% higher than the average price in Taunton. There are 301 property listings for sale in Brendon Hills.
What streets have the most expensive properties for sale in Brendon Hills?
The street with the most expensive properties for sale in Brendon Hills is Skilgate at an average of £590,000.
What streets have the most affordable properties for sale in Brendon Hills?
The street with the most affordable properties for sale in Brendon Hills is The Barton at an average of £310,000.
Which train stations are available in or near Brendon Hills?
Some of the train stations available in or near Brendon Hills are Tiverton Parkway, Taunton and Bridgwater.
Property Price Paid in Brendon Hills by Year
The average sold property price by year was:
| Year | Average Sold Price | Price Change |
Sold Properties
|
|---|---|---|---|
| 2025 | £511,250 | -8% |
4 Properties |
| 2024 | £550,000 | -66% |
4 Properties |
| 2023 | £913,333 | 19% |
3 Properties |
| 2022 | £736,600 | 32% |
9 Properties |
| 2021 | £501,930 | 17% |
15 Properties |
| 2020 | £416,750 | 27% |
6 Properties |
| 2019 | £304,000 | -149% |
7 Properties |
| 2018 | £756,375 | 47% |
4 Properties |
| 2017 | £402,650 | 17% |
10 Properties |
| 2016 | £334,000 | -62% |
7 Properties |
| 2015 | £540,785 | 31% |
7 Properties |
| 2014 | £371,785 | -170% |
7 Properties |
| 2013 | £1,004,850 | 68% |
7 Properties |
| 2012 | £325,746 | -16% |
8 Properties |
| 2011 | £378,636 | 34% |
11 Properties |
| 2010 | £250,000 | -63% |
1 Property |
| 2009 | £406,500 | 8% |
5 Properties |
| 2008 | £375,150 | -56% |
5 Properties |
| 2007 | £587,061 | 29% |
13 Properties |
| 2006 | £415,111 | -13% |
9 Properties |
| 2005 | £468,571 | 20% |
7 Properties |
| 2004 | £377,142 | 23% |
7 Properties |
| 2003 | £289,313 | 20% |
11 Properties |
| 2002 | £231,177 | 3% |
11 Properties |
| 2001 | £223,125 | 20% |
12 Properties |
| 2000 | £177,590 | 19% |
5 Properties |
| 1999 | £144,000 | 1% |
15 Properties |
| 1998 | £143,156 | 21% |
16 Properties |
| 1997 | £112,938 | -86% |
9 Properties |
| 1996 | £209,909 | 68% |
11 Properties |
| 1995 | £66,300 | - |
5 Properties |
Property Price per Property Type in Brendon Hills
Here you can find historic sold price data in order to help with your property search.
The average Property Paid Price for specific property types in the last three years are:
| Property Type | Average Sold Price | Sold Properties |
|---|---|---|
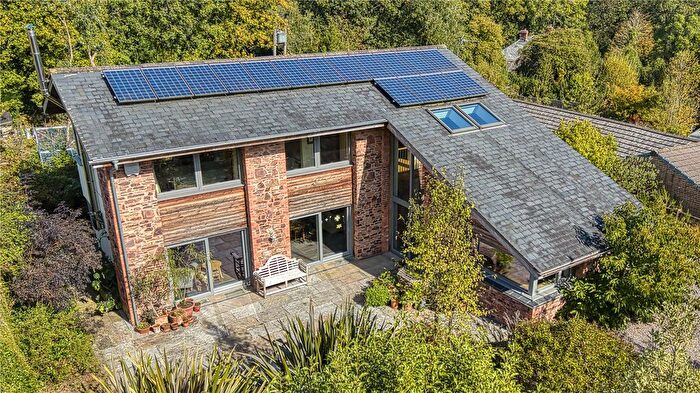
| Detached House | £667,500.00 | 10 Detached Houses |
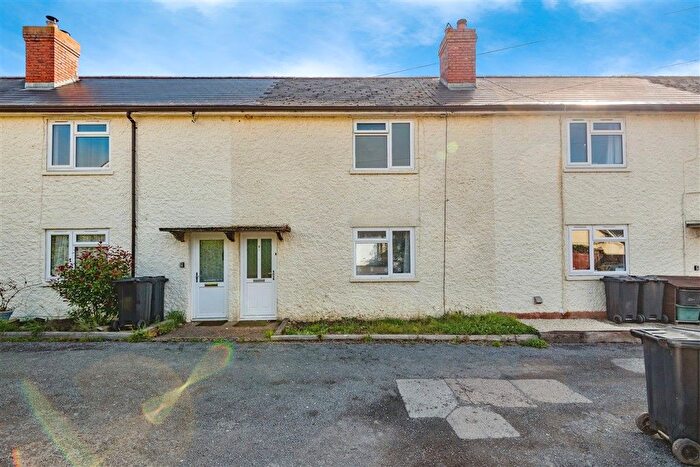
| Terraced House | £310,000.00 | 1 Terraced House |

