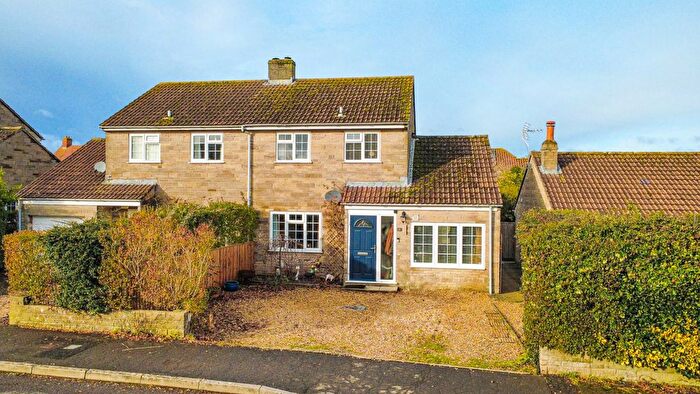
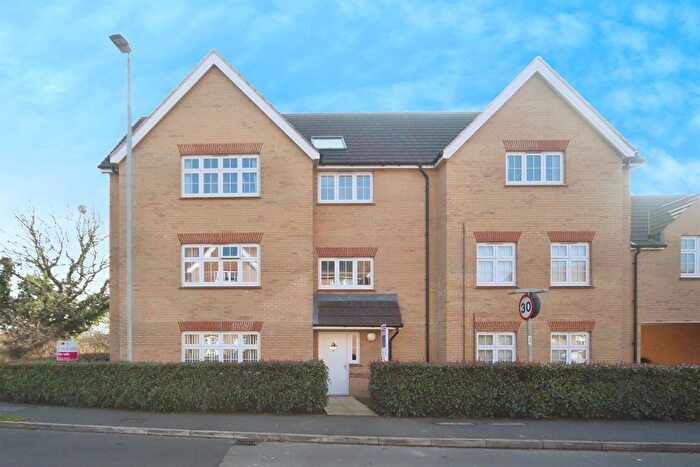
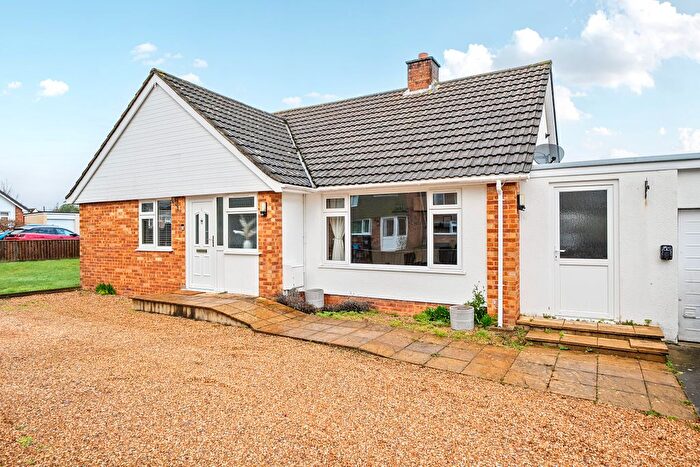
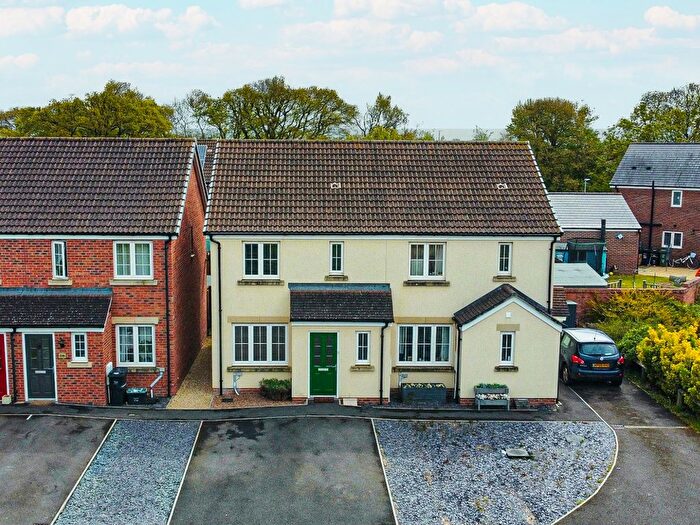
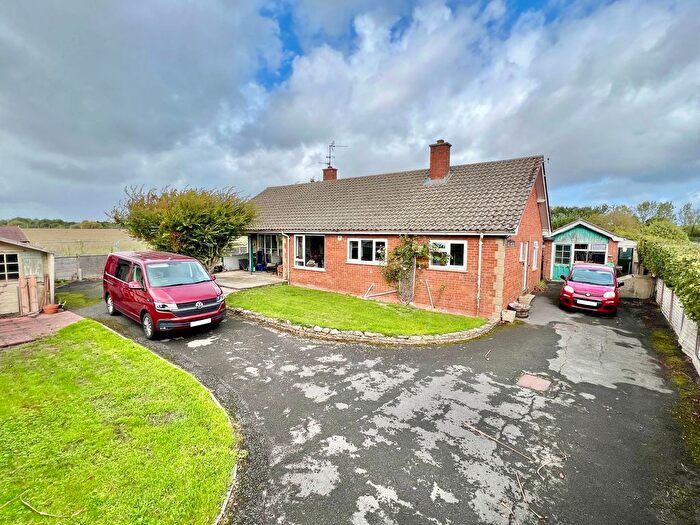
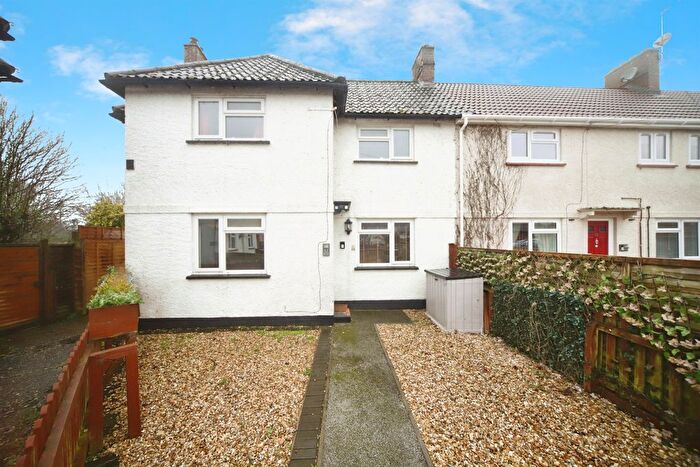
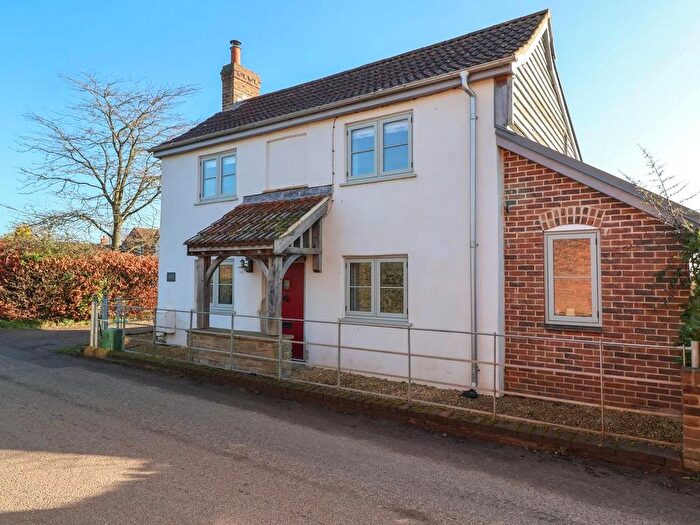
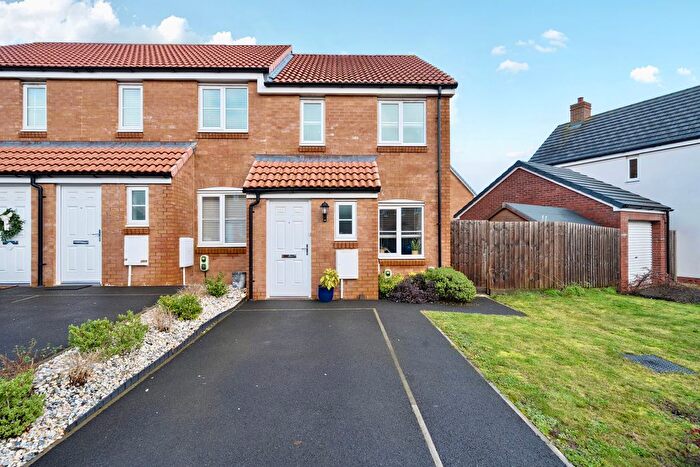
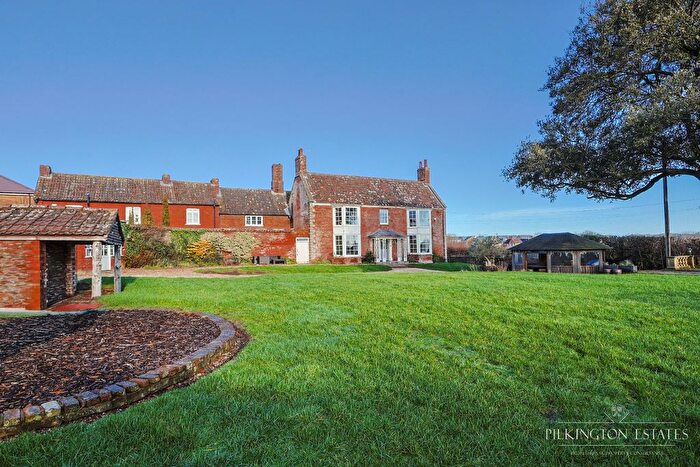
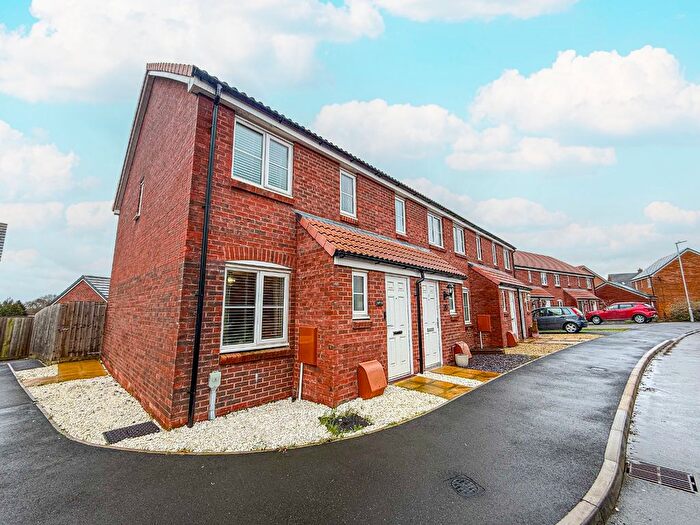
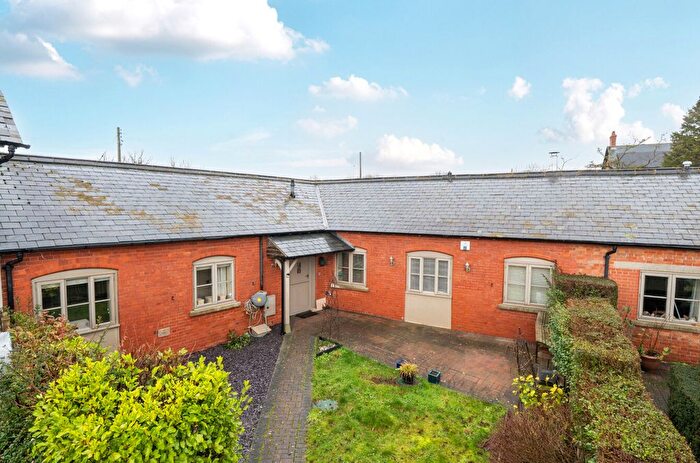
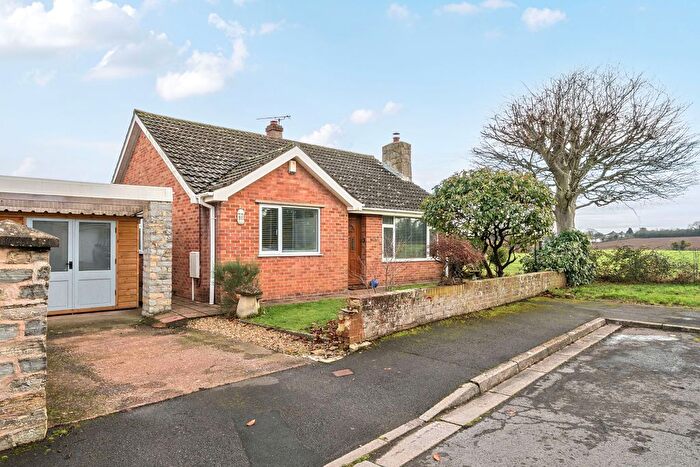
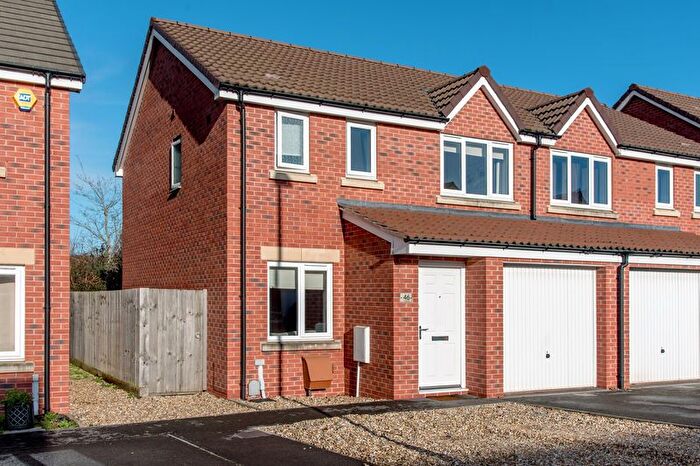
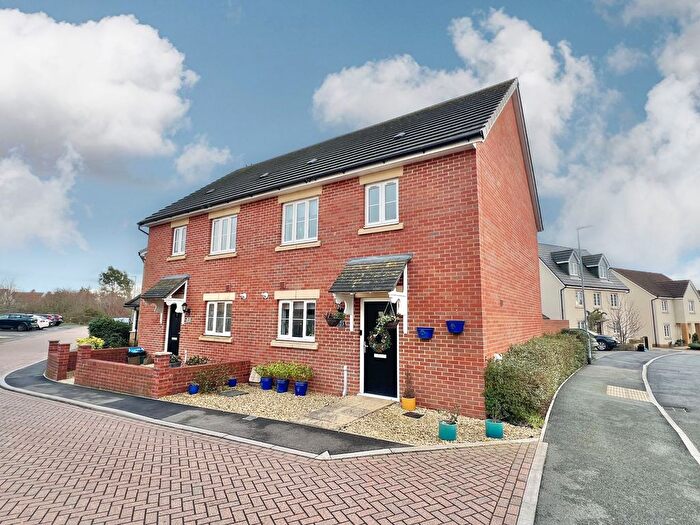
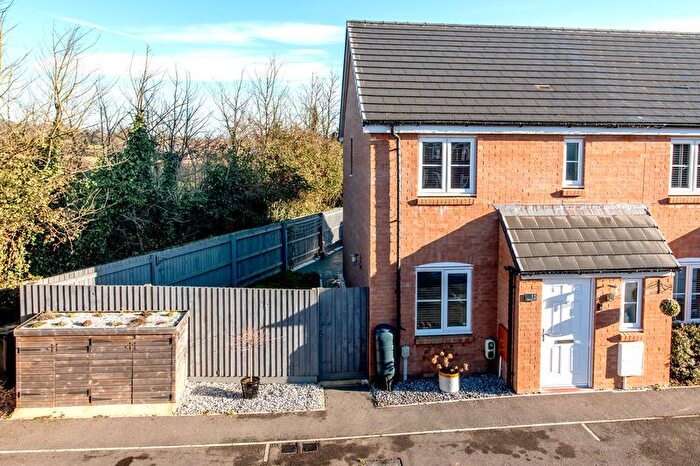
Houses for sale & to rent in North Curry & Ruishton, Taunton
House Prices in North Curry & Ruishton
Properties in North Curry & Ruishton have an average house price of £415,750.00 and had 10 Property Transactions within the last 3 years¹.
North Curry & Ruishton is an area in Taunton, Somerset with 226 households², where the most expensive property was sold for £795,000.00.
Properties for sale in North Curry & Ruishton
Previously listed properties in North Curry & Ruishton
Roads and Postcodes in North Curry & Ruishton
Navigate through our locations to find the location of your next house in North Curry & Ruishton, Taunton for sale or to rent.
| Streets | Postcodes |
|---|---|
| Alexevia Caravan Park | TA3 5LE |
| Barton Way | TA3 6JJ |
| Broughton Park | TA3 7BJ |
| Chelsea | TA3 5NJ |
| Church Road | TA3 6LH |
| Curload | TA3 6JB |
| Dinhams | TA3 5JG |
| Ham | TA3 5NT TA3 5NU |
| Henlade Close | TA3 5FF |
| Huntham | TA3 6EF |
| Ivy House Park | TA3 5HL TA3 5HR TA3 5HT |
| Knapp | TA3 6BA TA3 6BB TA3 6BE |
| Lillesdon Lane | TA3 6FD |
| Lillesdon Terrace | TA3 6BP |
| Lipe Lane | TA3 5JA |
| Lockyers Field | TA3 6FB |
| Loscombe Meadow | TA3 6AT |
| Lower Holway | TA3 5AA |
| Manor Lane | TA3 6FA |
| Meare Green | TA3 6HT |
| Moor Lane Close | TA3 6JX |
| Moredon | TA3 6HW |
| Pattons | TA3 5DB |
| Sedgemoor Drove | TA3 6DY |
| Stoke Road | TA3 6HP |
| The Shambles | TA3 6RE |
| TA3 5DN TA3 5LU TA3 5ND TA3 5NE TA3 5NF TA3 5NP TA3 6AW TA3 6BT TA3 6BU TA3 6BX TA3 6DG TA3 6DP TA3 6DR TA3 6DT TA3 6EH TA3 6EJ TA3 6JH TA3 6LB TA3 7BT |
Transport near North Curry & Ruishton
- FAQ
- Price Paid By Year
- Property Type Price
Frequently asked questions about North Curry & Ruishton
What is the average price for a property for sale in North Curry & Ruishton?
The average price for a property for sale in North Curry & Ruishton is £415,750. This amount is 34% higher than the average price in Taunton. There are 939 property listings for sale in North Curry & Ruishton.
What streets have the most expensive properties for sale in North Curry & Ruishton?
The streets with the most expensive properties for sale in North Curry & Ruishton are Loscombe Meadow at an average of £623,333 and Lockyers Field at an average of £511,250.
What streets have the most affordable properties for sale in North Curry & Ruishton?
The streets with the most affordable properties for sale in North Curry & Ruishton are Henlade Close at an average of £240,000 and Knapp at an average of £275,000.
Which train stations are available in or near North Curry & Ruishton?
Some of the train stations available in or near North Curry & Ruishton are Taunton, Bridgwater and Crewkerne.
Property Price Paid in North Curry & Ruishton by Year
The average sold property price by year was:
| Year | Average Sold Price | Price Change |
Sold Properties
|
|---|---|---|---|
| 2025 | £461,875 | 45% |
4 Properties |
| 2024 | £256,250 | -151% |
4 Properties |
| 2023 | £642,500 | 3% |
2 Properties |
| 2022 | £623,333 | 23% |
3 Properties |
| 2021 | £481,800 | 11% |
5 Properties |
| 2020 | £429,333 | 5% |
3 Properties |
| 2019 | £408,863 | -11% |
23 Properties |
| 2018 | £454,840 | 13% |
4 Properties |
| 2017 | £395,307 | 31% |
22 Properties |
| 2016 | £272,475 | -65% |
2 Properties |
| 2015 | £450,000 | 72% |
1 Property |
| 2014 | £125,000 | -182% |
1 Property |
| 2007 | £352,500 | -15% |
1 Property |
| 2006 | £406,159 | 34% |
1 Property |
| 2004 | £269,950 | 33% |
2 Properties |
| 2003 | £180,000 | -50% |
1 Property |
| 2002 | £270,000 | - |
1 Property |
Property Price per Property Type in North Curry & Ruishton
Here you can find historic sold price data in order to help with your property search.
The average Property Paid Price for specific property types in the last three years are:
| Property Type | Average Sold Price | Sold Properties |
|---|---|---|
| Detached House | £531,666.00 | 6 Detached Houses |
| Semi Detached House | £250,000.00 | 2 Semi Detached Houses |
| Terraced House | £233,750.00 | 2 Terraced Houses |

