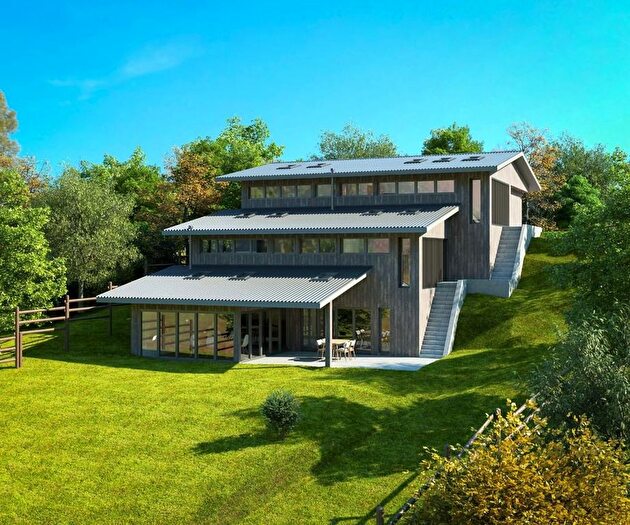
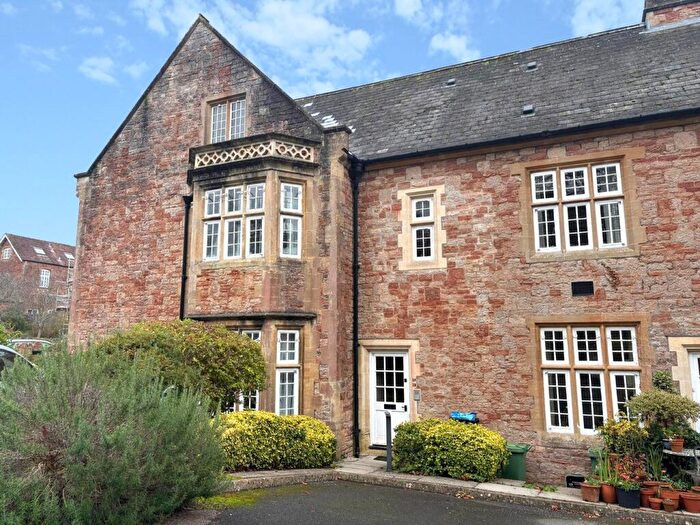
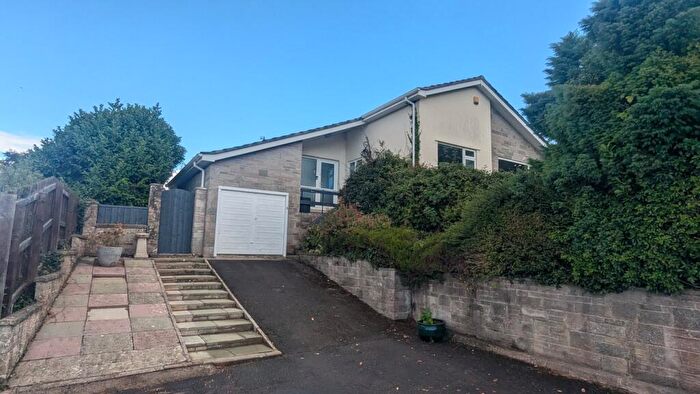
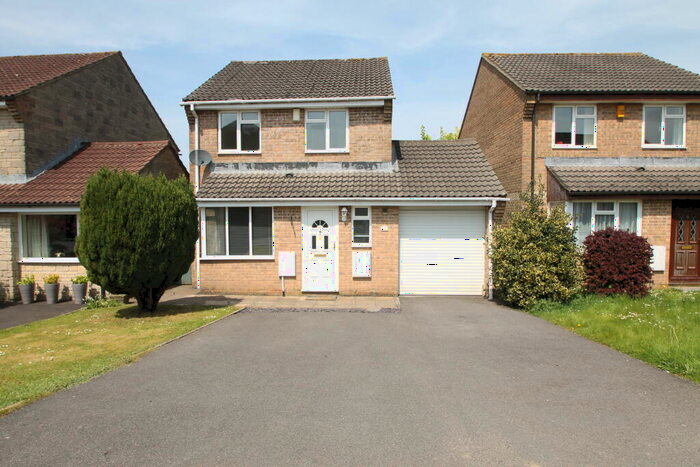
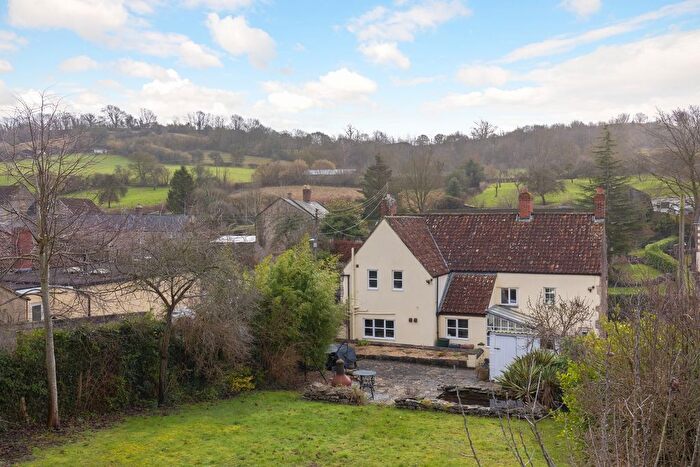
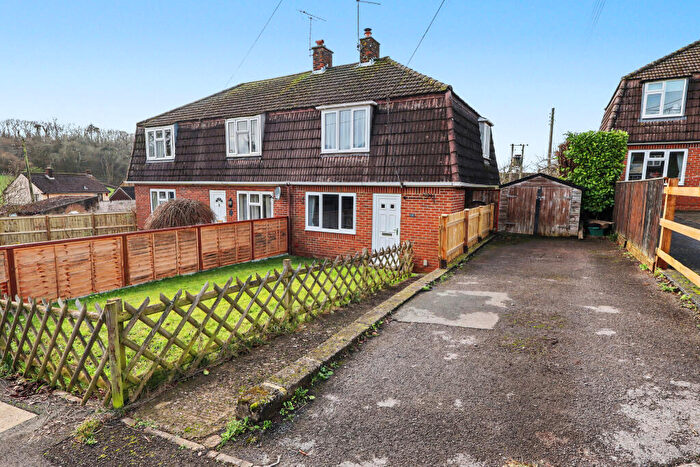
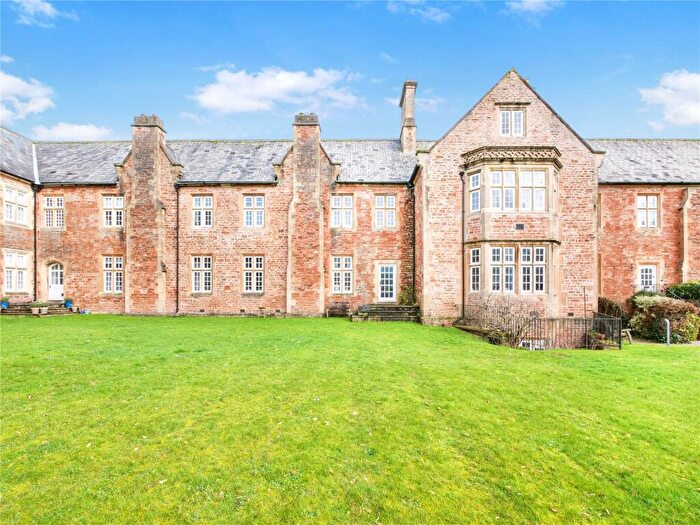
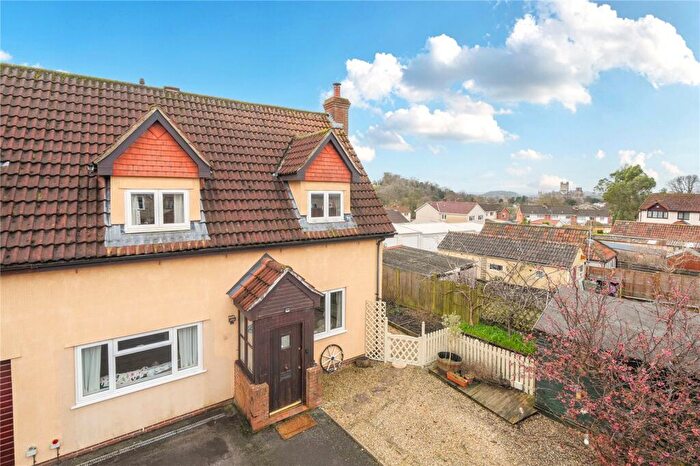
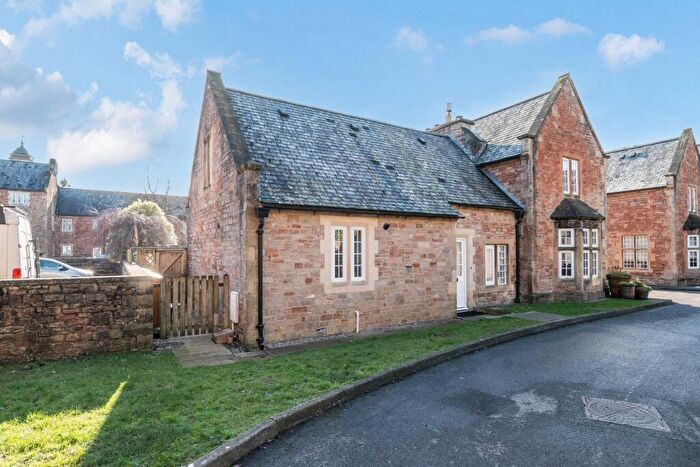
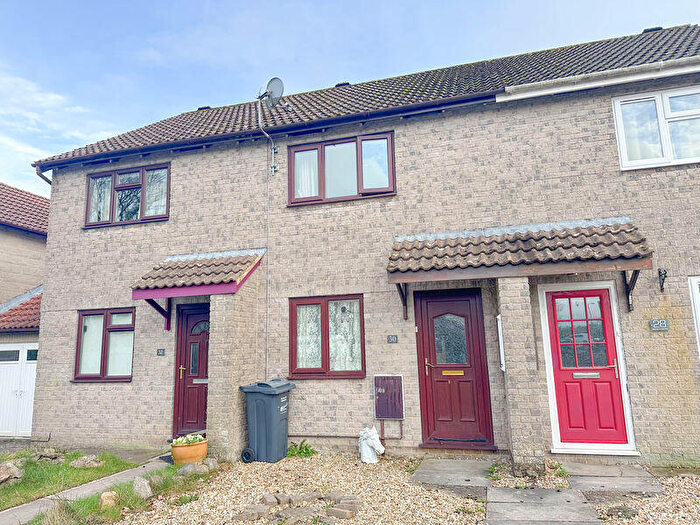
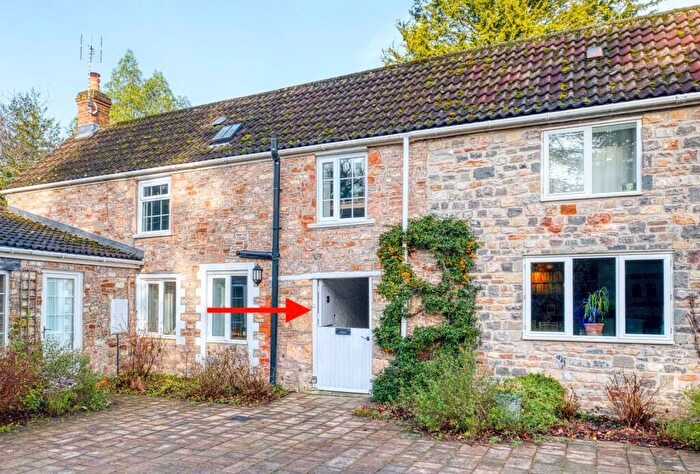
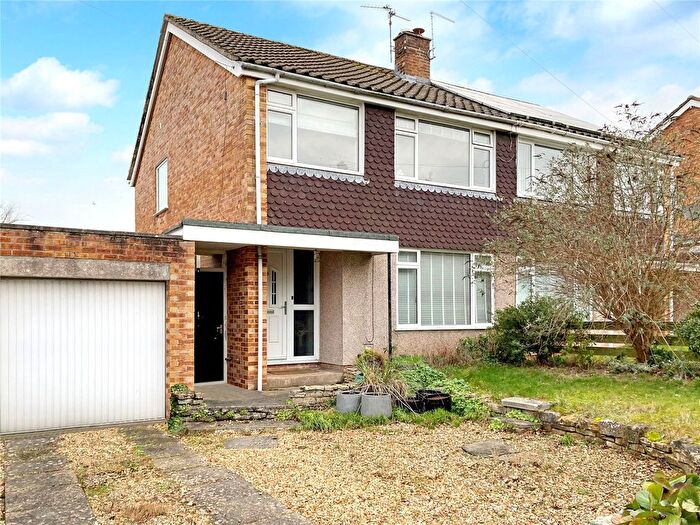
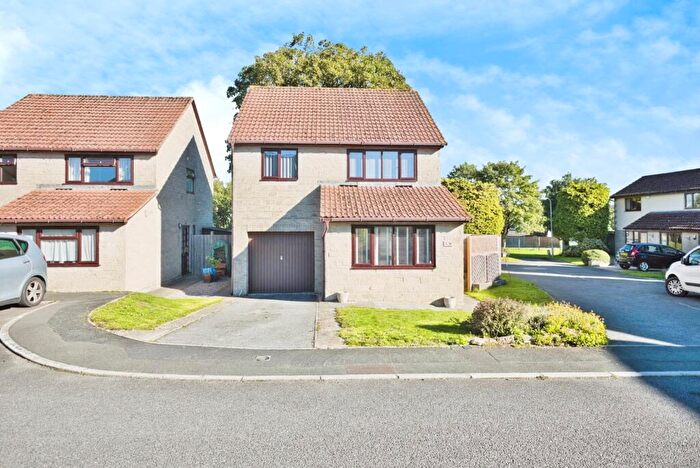
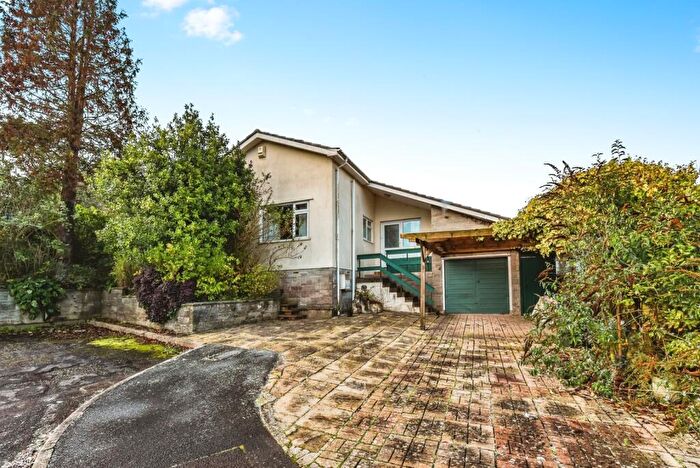
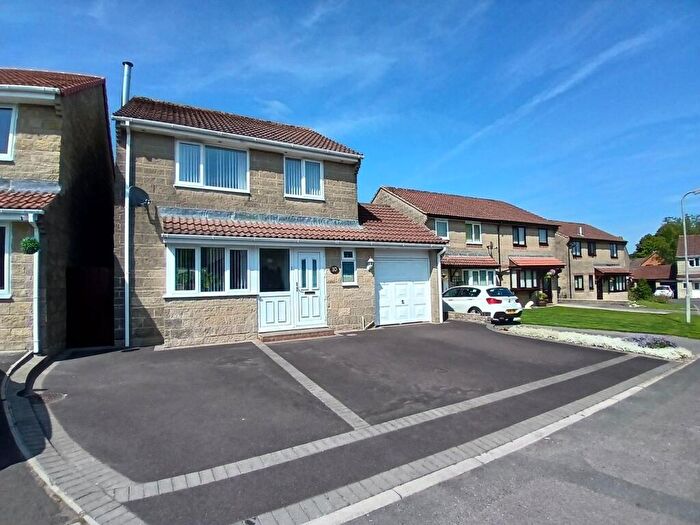
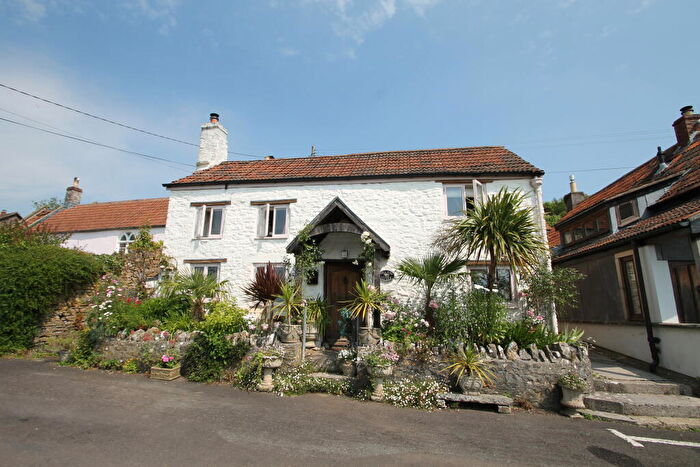
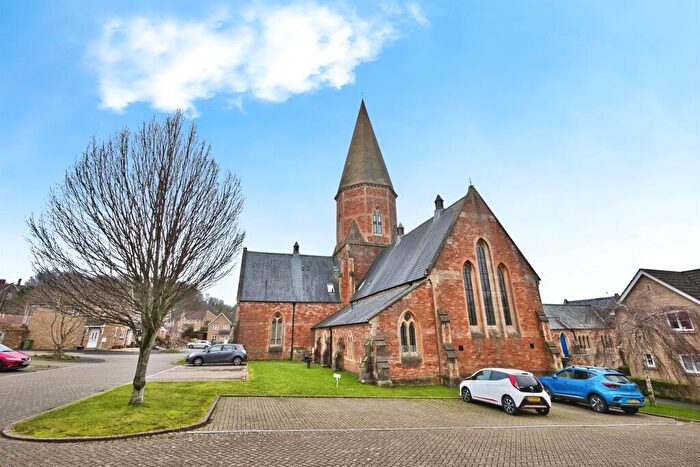
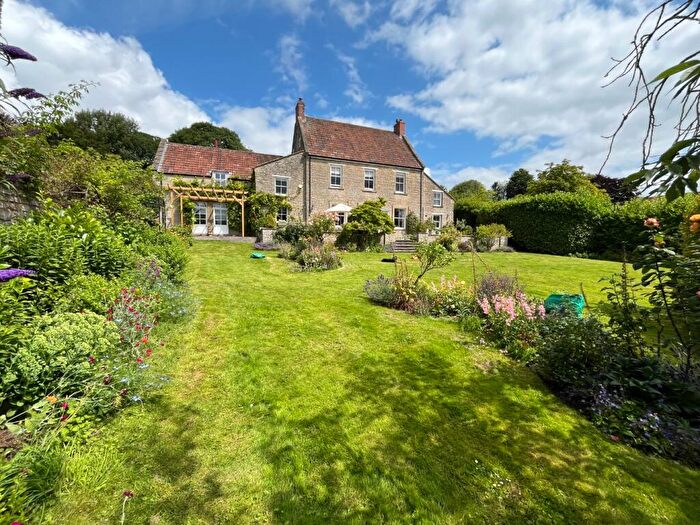
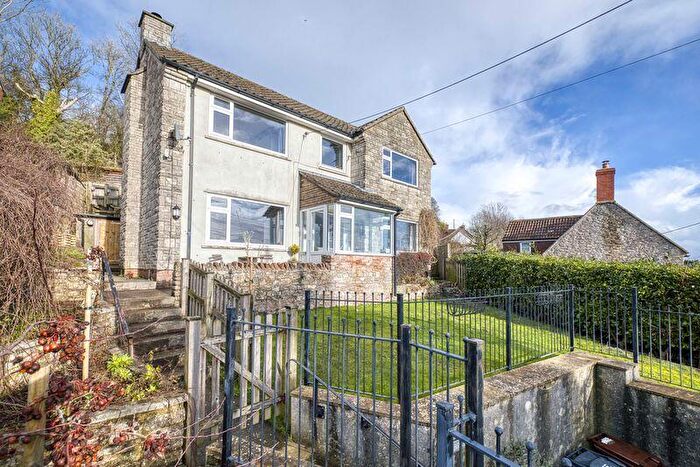
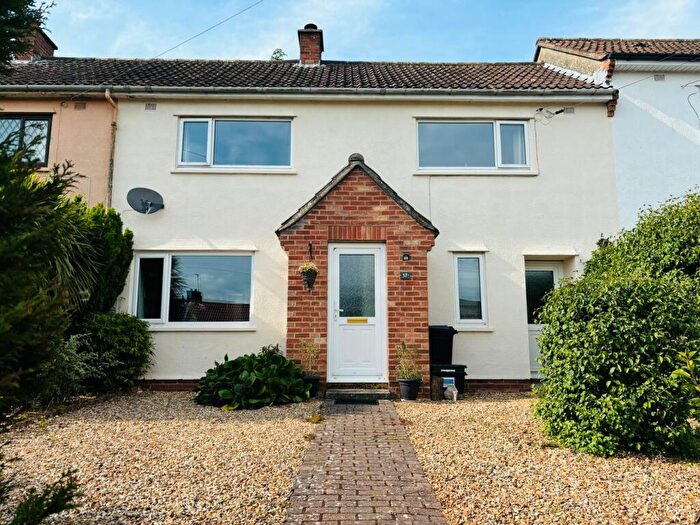
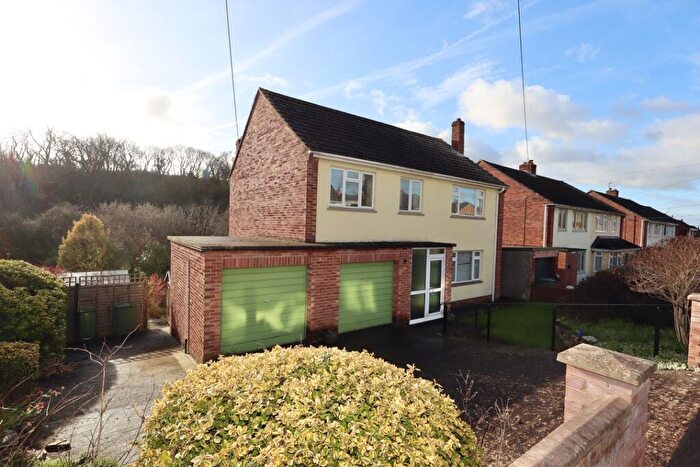
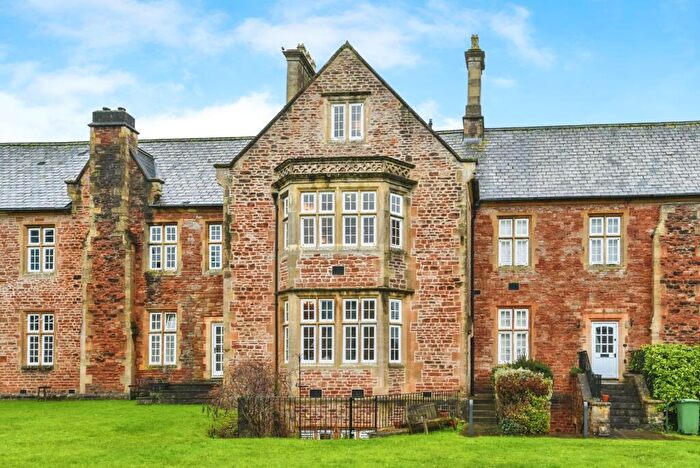
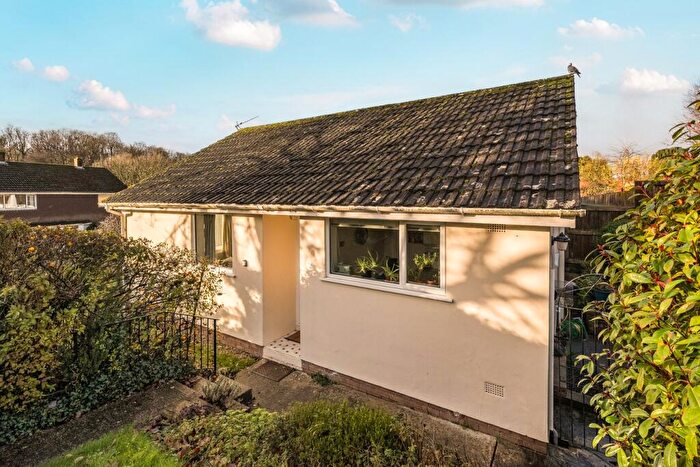
Houses for sale & to rent in Croscombe And Pilton, Wells
House Prices in Croscombe And Pilton
Properties in Croscombe And Pilton have an average house price of £519,736.00 and had 36 Property Transactions within the last 3 years¹.
Croscombe And Pilton is an area in Wells, Somerset with 379 households², where the most expensive property was sold for £2,330,000.00.
Properties for sale in Croscombe And Pilton
Roads and Postcodes in Croscombe And Pilton
Navigate through our locations to find the location of your next house in Croscombe And Pilton, Wells for sale or to rent.
| Streets | Postcodes |
|---|---|
| Bennetts Close | BA5 3RH |
| Boards Lane | BA5 3QX |
| Church Street | BA5 3PE BA5 3QS |
| Churchill Batch Lane | BA5 3RW |
| Combe Green | BA5 3QP |
| Constitution Hill | BA5 3NS |
| Coombe Cottages | BA5 3QU |
| Derricks Close | BA5 3PD |
| Dulcote Cottage | BA5 3NU |
| Dulcote Hill Lane | BA5 3FH |
| East View Cottages | BA5 3QR |
| Fayreway | BA5 3QZ BA5 3RA BA5 3RQ |
| Hay Hill | BA5 3RG |
| High Street | BA5 3PL |
| Highfield Cottages | BA5 3NX |
| Honeymead | BA5 3RF |
| Jacks Lane | BA5 3QD |
| Long Lane | BA5 3PQ |
| Long Street | BA5 3QH BA5 3QJ BA5 3QL BA5 3QQ |
| Old Street | BA5 3RL |
| Old Wells Road | BA5 3RR |
| Orchard Cottages | BA5 3RJ |
| Paradise Lane | BA5 3RN |
| Poundfold | BA5 3QY |
| Rock Street | BA5 3QT |
| Rookery Lane | BA5 3QW |
| Rose Cottages | BA5 3PH |
| Sleight Lane | BA5 3PP BA5 3HF |
| Somerville Cottages | BA5 3RE |
| The Court | BA5 3PJ |
| The Pound Court | BA5 3PR |
| Thrupe Lane | BA5 3HE BA5 3RB BA5 3HD |
| Wellesley Lane | BA5 3QB |
| West Lane | BA5 3RD |
| BA5 3PB BA5 3PF BA5 3PW BA5 3PZ BA5 3QN BA5 3FN BA5 3HB BA5 3PA BA5 3PG BA5 3PX BA5 3QA BA5 3RP |
Transport near Croscombe And Pilton
- FAQ
- Price Paid By Year
- Property Type Price
Frequently asked questions about Croscombe And Pilton
What is the average price for a property for sale in Croscombe And Pilton?
The average price for a property for sale in Croscombe And Pilton is £519,736. This amount is 39% higher than the average price in Wells. There are 805 property listings for sale in Croscombe And Pilton.
What streets have the most expensive properties for sale in Croscombe And Pilton?
The streets with the most expensive properties for sale in Croscombe And Pilton are Thrupe Lane at an average of £941,200, Church Street at an average of £829,881 and Long Lane at an average of £625,000.
What streets have the most affordable properties for sale in Croscombe And Pilton?
The streets with the most affordable properties for sale in Croscombe And Pilton are Honeymead at an average of £227,666, Bennetts Close at an average of £272,000 and Coombe Cottages at an average of £290,000.
Which train stations are available in or near Croscombe And Pilton?
Some of the train stations available in or near Croscombe And Pilton are Castle Cary, Bruton and Frome.
Property Price Paid in Croscombe And Pilton by Year
The average sold property price by year was:
| Year | Average Sold Price | Price Change |
Sold Properties
|
|---|---|---|---|
| 2025 | £520,562 | 19% |
8 Properties |
| 2024 | £422,000 | -46% |
14 Properties |
| 2023 | £617,000 | 16% |
14 Properties |
| 2022 | £519,919 | -1% |
13 Properties |
| 2021 | £522,642 | 14% |
28 Properties |
| 2020 | £447,857 | 4% |
14 Properties |
| 2019 | £430,015 | 22% |
16 Properties |
| 2018 | £335,200 | -9% |
10 Properties |
| 2017 | £365,461 | -2% |
13 Properties |
| 2016 | £372,779 | 22% |
17 Properties |
| 2015 | £290,700 | -55% |
10 Properties |
| 2014 | £449,760 | 15% |
19 Properties |
| 2013 | £380,750 | 17% |
10 Properties |
| 2012 | £316,234 | -11% |
19 Properties |
| 2011 | £349,450 | 16% |
21 Properties |
| 2010 | £295,136 | -60% |
11 Properties |
| 2009 | £472,055 | 51% |
9 Properties |
| 2008 | £231,954 | -26% |
11 Properties |
| 2007 | £292,880 | 14% |
21 Properties |
| 2006 | £251,730 | -7% |
13 Properties |
| 2005 | £269,245 | -5% |
12 Properties |
| 2004 | £282,100 | 23% |
10 Properties |
| 2003 | £216,136 | 16% |
15 Properties |
| 2002 | £181,714 | 13% |
21 Properties |
| 2001 | £158,099 | 22% |
21 Properties |
| 2000 | £122,896 | -13% |
13 Properties |
| 1999 | £138,651 | 27% |
28 Properties |
| 1998 | £101,402 | 8% |
20 Properties |
| 1997 | £93,547 | 4% |
17 Properties |
| 1996 | £89,666 | 23% |
15 Properties |
| 1995 | £69,000 | - |
7 Properties |
Property Price per Property Type in Croscombe And Pilton
Here you can find historic sold price data in order to help with your property search.
The average Property Paid Price for specific property types in the last three years are:
| Property Type | Average Sold Price | Sold Properties |
|---|---|---|
| Semi Detached House | £304,687.00 | 8 Semi Detached Houses |
| Detached House | £727,611.00 | 18 Detached Houses |
| Terraced House | £317,600.00 | 10 Terraced Houses |

