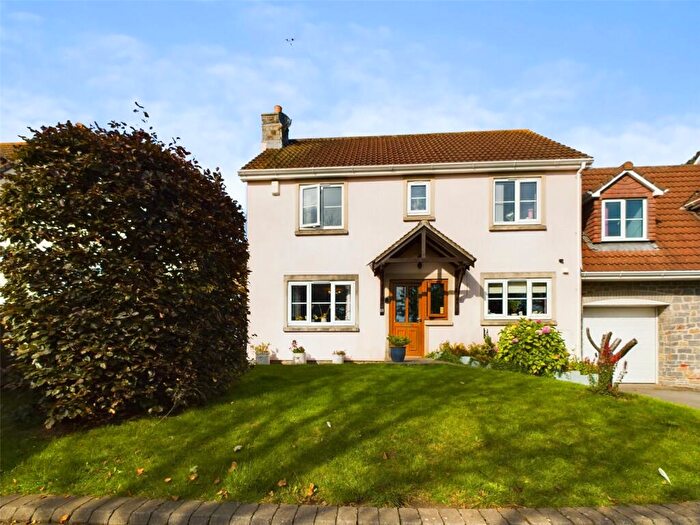
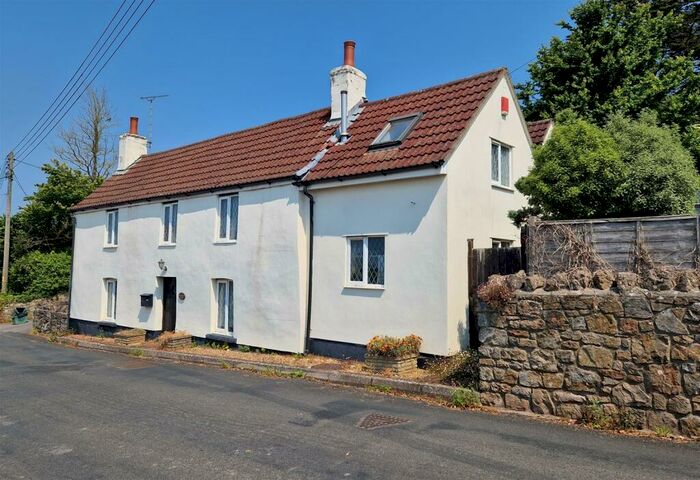
Houses for sale & to rent in Knoll, Weston-super-mare
House Prices in Knoll
Properties in Knoll have an average house price of £469,203.00 and had 27 Property Transactions within the last 3 years¹.
Knoll is an area in Weston-super-mare, Somerset with 373 households², where the most expensive property was sold for £805,000.00.
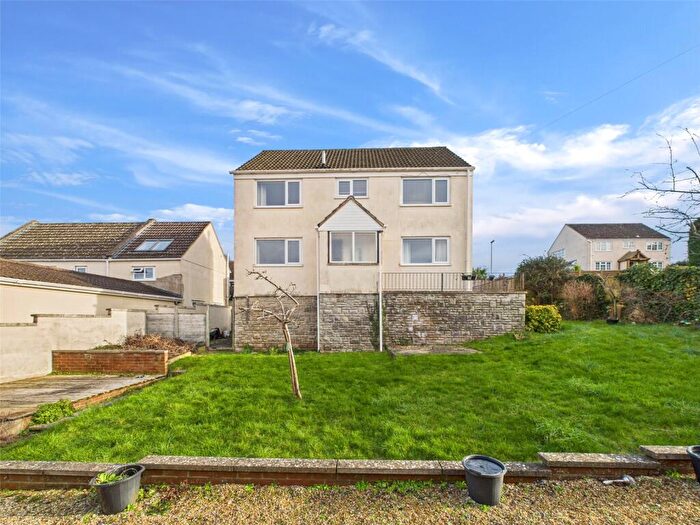
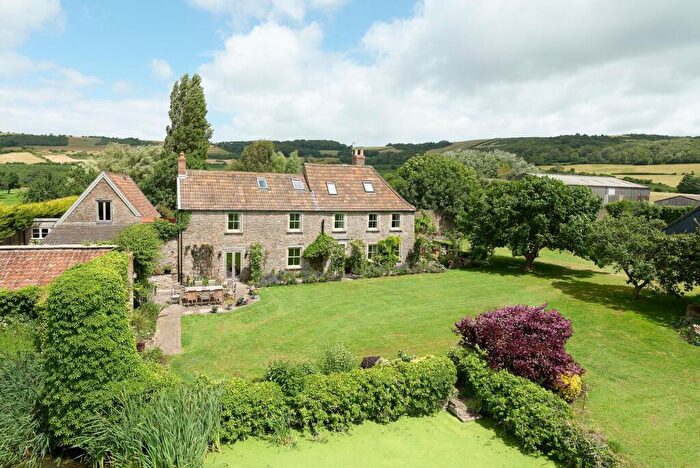
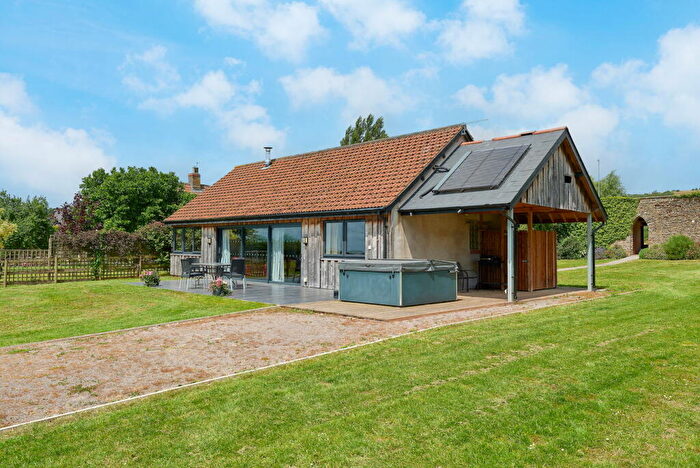
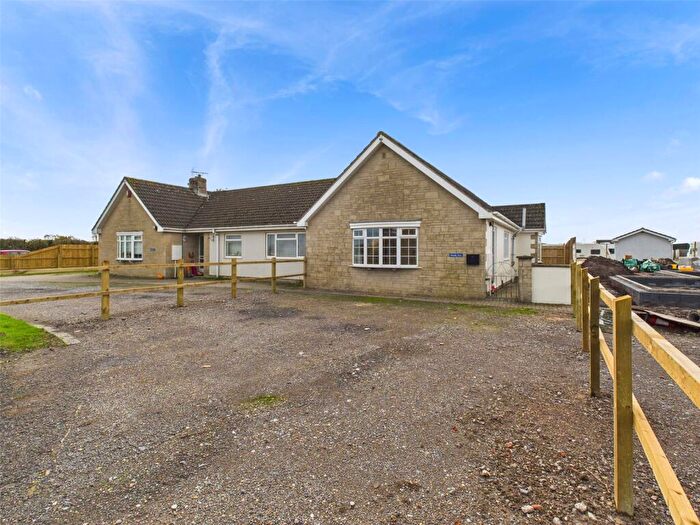
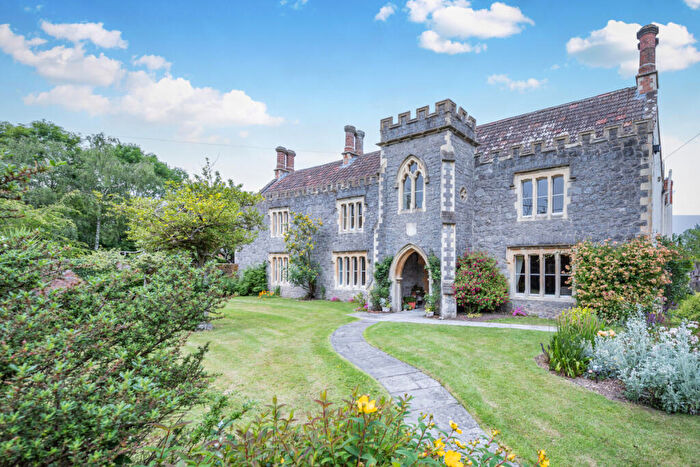
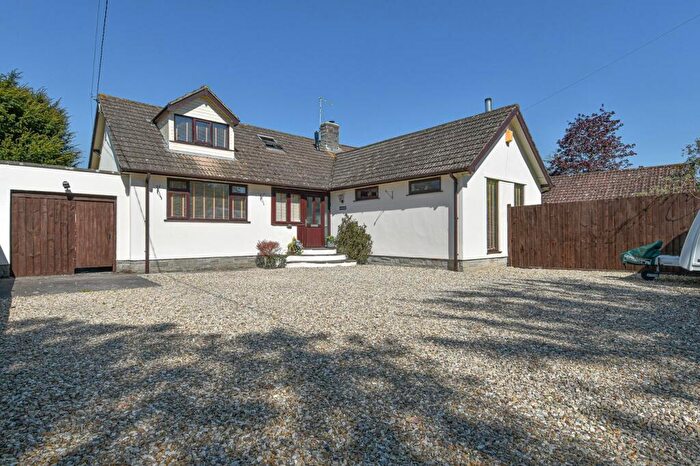
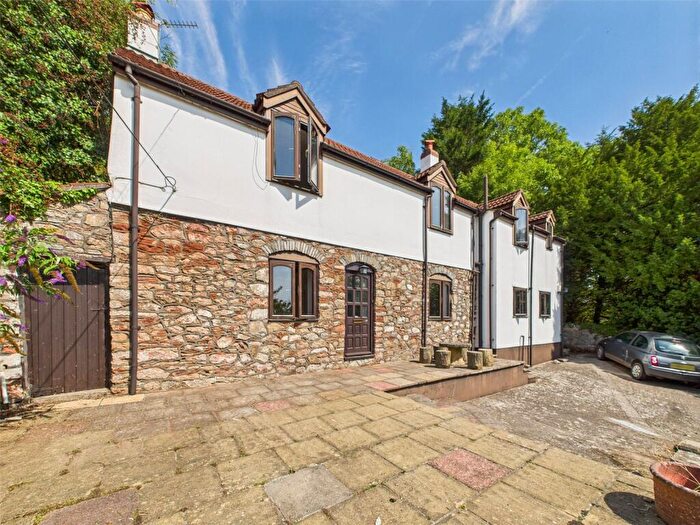
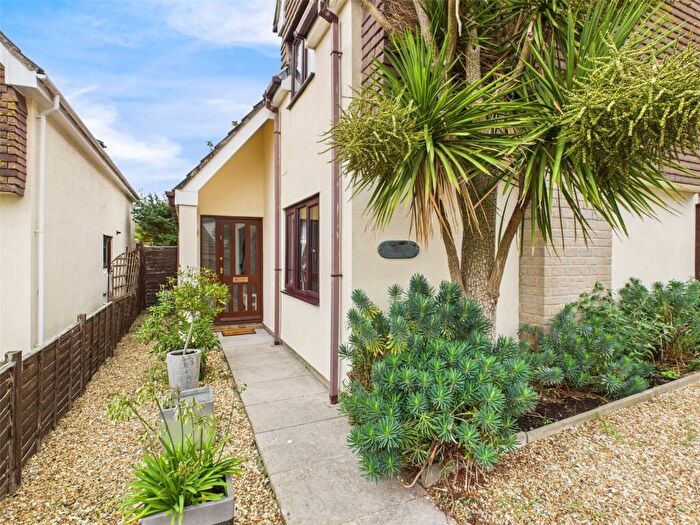
Properties for sale in Knoll
Roads and Postcodes in Knoll
Navigate through our locations to find the location of your next house in Knoll, Weston-super-mare for sale or to rent.
| Streets | Postcodes |
|---|---|
| Batch Lane | BS24 0EX |
| Boat Lane | BS24 0BL |
| Brean Road | BS24 0HA |
| Bridgwater Road | BS24 0BN BS24 0BP BS24 0BW BS24 0BZ BS24 0DB BS24 0JN BS24 0JT BS24 0JW |
| Church Corner | BS24 0DR |
| Church Lane | BS24 0DS |
| Church Road | BS24 0DT |
| Copse Corner | BS24 0DA |
| Delhorn Lane | BS24 0EB |
| Eastertown | BS24 0HL BS24 0HP BS24 0HT BS24 0HY |
| Edingworth Road | BS24 0JA BS24 0JB |
| Ferry Lane | BS24 0BT |
| Lympsham Road | BS24 0DE BS24 0DN |
| North Road | BS24 0HS |
| Purving Row | BS24 0ED BS24 0JR BS24 0HW |
| Rectory Way | BS24 0EN BS24 0ES BS24 0EU BS24 0EW |
| Rookery Cottages | BS24 0JD |
| Slade Lane | BS24 0DP |
| South Close | BS24 0DZ |
| South Road | BS24 0DX BS24 0DY |
| Stevens Lane | BS24 0BX BS24 0BY |
| Strowlands | BS24 0JJ |
| The Boundaries | BS24 0DF |
| The Crescent | BS24 0BH |
| The Worthings | BS24 0DJ |
| West Road | BS24 0EG BS24 0EQ |
| Weston Road | BS24 0JG BS24 0JQ BS24 0JH |
| Wharfside | BS24 0EZ |
| Wick Lane | BS24 0HG |
| Worthy Crescent | BS24 0DG BS24 0DQ |
| BS24 0JL |
Transport near Knoll
- FAQ
- Price Paid By Year
- Property Type Price
Frequently asked questions about Knoll
What is the average price for a property for sale in Knoll?
The average price for a property for sale in Knoll is £469,203. This amount is 0.01% lower than the average price in Weston-super-mare. There are 290 property listings for sale in Knoll.
What streets have the most expensive properties for sale in Knoll?
The streets with the most expensive properties for sale in Knoll are Slade Lane at an average of £805,000, Weston Road at an average of £740,000 and West Road at an average of £600,000.
What streets have the most affordable properties for sale in Knoll?
The streets with the most affordable properties for sale in Knoll are Copse Corner at an average of £270,000, Bridgwater Road at an average of £303,333 and The Crescent at an average of £385,000.
Which train stations are available in or near Knoll?
Some of the train stations available in or near Knoll are Weston-Super-Mare, Weston Milton and Highbridge and Burnham.
Property Price Paid in Knoll by Year
The average sold property price by year was:
| Year | Average Sold Price | Price Change |
Sold Properties
|
|---|---|---|---|
| 2025 | £412,000 | -17% |
6 Properties |
| 2024 | £483,428 | -1% |
14 Properties |
| 2023 | £489,785 | -10% |
7 Properties |
| 2022 | £537,000 | 16% |
6 Properties |
| 2021 | £449,067 | 9% |
14 Properties |
| 2020 | £406,636 | 1% |
11 Properties |
| 2019 | £401,444 | 3% |
9 Properties |
| 2018 | £390,000 | 4% |
6 Properties |
| 2017 | £374,300 | -1% |
10 Properties |
| 2016 | £376,782 | 11% |
14 Properties |
| 2015 | £334,853 | 9% |
14 Properties |
| 2014 | £304,722 | -6% |
9 Properties |
| 2013 | £323,700 | 9% |
5 Properties |
| 2012 | £295,990 | 15% |
5 Properties |
| 2011 | £250,900 | -12% |
5 Properties |
| 2010 | £280,384 | -2% |
13 Properties |
| 2009 | £285,307 | -17% |
13 Properties |
| 2008 | £333,000 | -0,1% |
8 Properties |
| 2007 | £333,309 | 10% |
21 Properties |
| 2006 | £299,738 | 16% |
18 Properties |
| 2005 | £252,041 | 8% |
12 Properties |
| 2004 | £231,820 | -21% |
15 Properties |
| 2003 | £281,156 | 12% |
16 Properties |
| 2002 | £247,352 | 31% |
17 Properties |
| 2001 | £170,686 | 11% |
31 Properties |
| 2000 | £151,556 | 8% |
13 Properties |
| 1999 | £140,097 | 20% |
20 Properties |
| 1998 | £111,833 | 10% |
15 Properties |
| 1997 | £100,542 | -16% |
13 Properties |
| 1996 | £116,565 | 20% |
22 Properties |
| 1995 | £92,821 | - |
12 Properties |
Property Price per Property Type in Knoll
Here you can find historic sold price data in order to help with your property search.
The average Property Paid Price for specific property types in the last three years are:
| Property Type | Average Sold Price | Sold Properties |
|---|---|---|
| Semi Detached House | £336,944.00 | 9 Semi Detached Houses |
| Detached House | £545,117.00 | 17 Detached Houses |
| Terraced House | £369,000.00 | 1 Terraced House |

