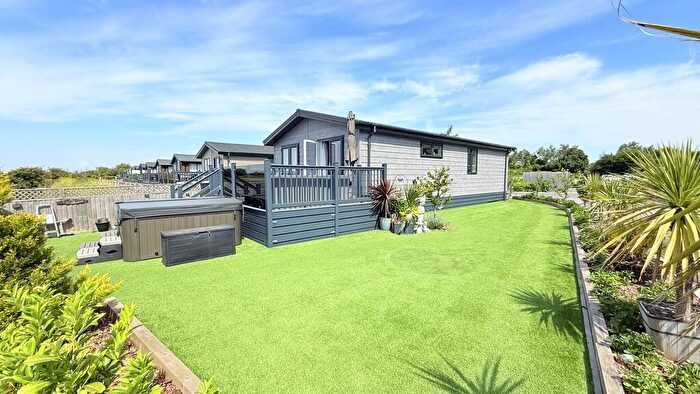
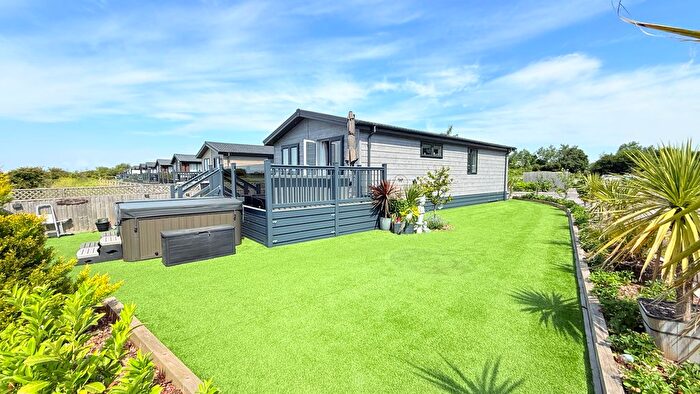
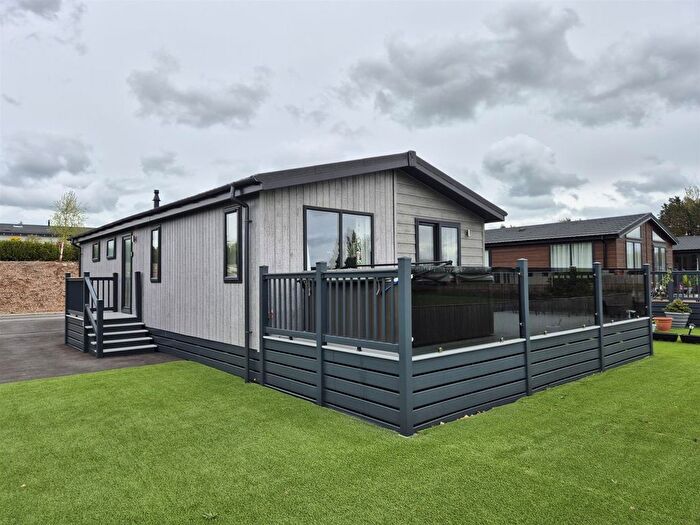
Houses for sale & to rent in Knoll, Axbridge
House Prices in Knoll
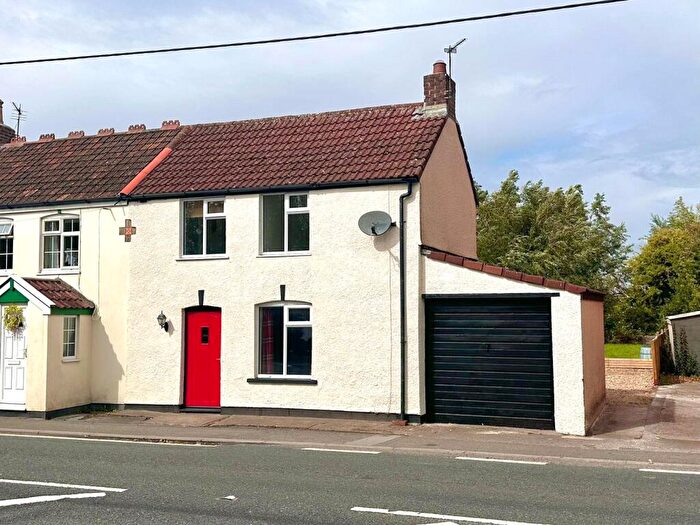
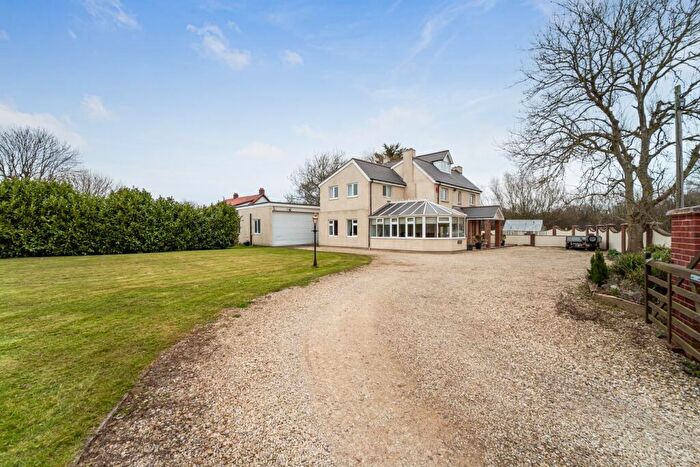
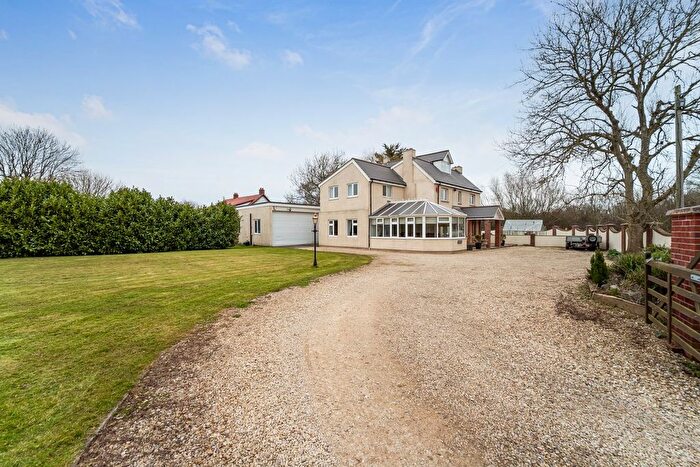
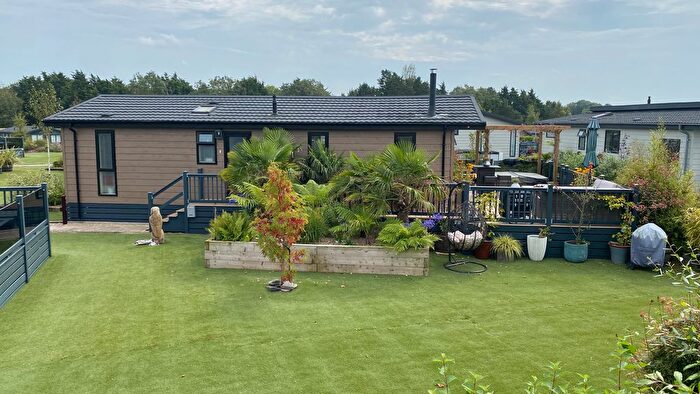
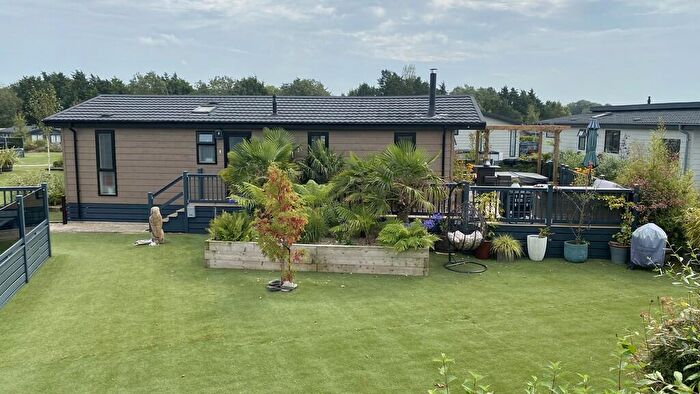
Properties in Knoll have an average house price of £332,083.00 and had 18 Property Transactions within the last 3 years¹.
Knoll is an area in Axbridge, Somerset with 190 households², where the most expensive property was sold for £750,000.00.
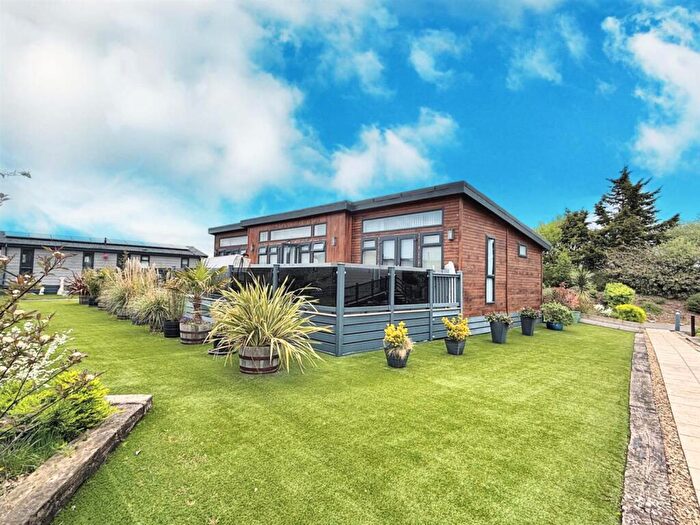
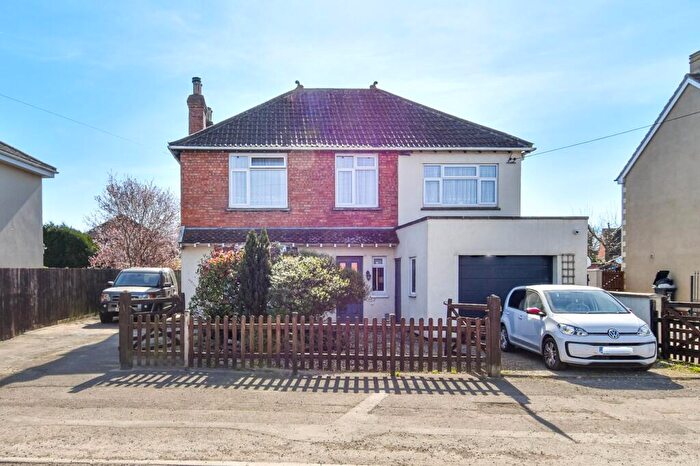
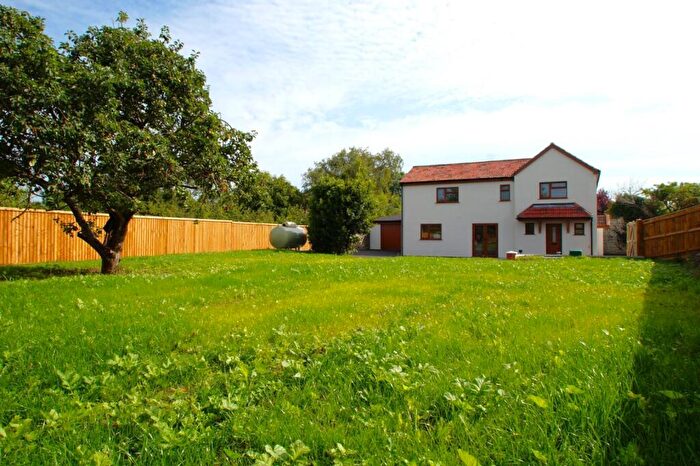
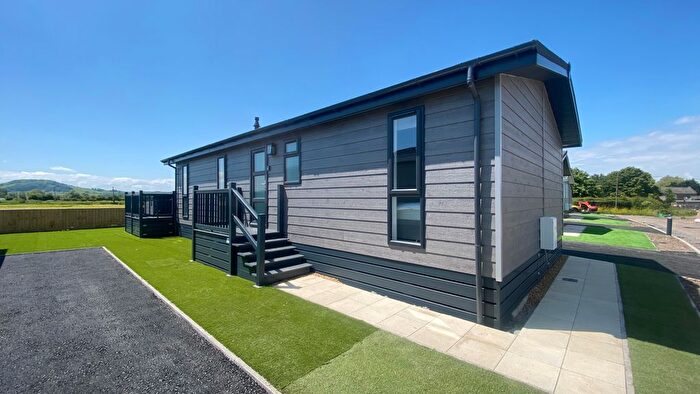
Properties for sale in Knoll
Previously listed properties in Knoll
Roads and Postcodes in Knoll
Navigate through our locations to find the location of your next house in Knoll, Axbridge for sale or to rent.
| Streets | Postcodes |
|---|---|
| Brent Knoll Picnic Area | BS26 2UF |
| Bristol Road | BS26 2FN BS26 2TA BS26 2TE BS26 2TG BS26 2TF BS26 2TQ BS26 2TT |
| Chapel Road | BS26 2TB BS26 2TD |
| Clare Court | BS26 2FP |
| Gills Lane | BS26 2TU BS26 2TY BS26 2TZ |
| Josephs Pound | BS26 2TP |
| Mendip Road | BS26 2UG BS26 2UL |
| Monks Close | BS26 2TJ |
| Mudgley Road | BS26 2TH BS26 2TL |
| Oldmead Lane | BS26 2TX |
| Pill Road | BS26 2TN BS26 2TS |
| Rookery Close | BS26 2UQ |
| Rooksbridge Road | BS26 2UD |
| Stone Cottages | BS26 2UP |
| The Chantry | BS26 2TR |
| Watersmeet Close | BS26 2UA |
| White House Lane | BS26 2US BS26 2UU |
Transport near Knoll
-
Highbridge and Burnham Station
-
Weston Milton Station
-
Weston-Super-Mare Station
-
Worle Station
-
Yatton Station
- FAQ
- Price Paid By Year
- Property Type Price
Frequently asked questions about Knoll
What is the average price for a property for sale in Knoll?
The average price for a property for sale in Knoll is £332,083. This amount is 19% lower than the average price in Axbridge. There are 104 property listings for sale in Knoll.
What streets have the most expensive properties for sale in Knoll?
The streets with the most expensive properties for sale in Knoll are White House Lane at an average of £471,250, Chapel Road at an average of £429,000 and Rookery Close at an average of £283,333.
What streets have the most affordable properties for sale in Knoll?
The streets with the most affordable properties for sale in Knoll are Watersmeet Close at an average of £88,750 and Bristol Road at an average of £230,000.
Which train stations are available in or near Knoll?
Some of the train stations available in or near Knoll are Highbridge and Burnham, Weston Milton and Weston-Super-Mare.
Property Price Paid in Knoll by Year
The average sold property price by year was:
| Year | Average Sold Price | Price Change |
Sold Properties
|
|---|---|---|---|
| 2025 | £417,500 | 42% |
4 Properties |
| 2024 | £241,875 | -38% |
4 Properties |
| 2023 | £334,000 | -28% |
10 Properties |
| 2022 | £426,666 | 20% |
3 Properties |
| 2021 | £341,444 | -30% |
9 Properties |
| 2020 | £443,991 | 48% |
6 Properties |
| 2019 | £231,500 | -25% |
4 Properties |
| 2018 | £288,333 | 21% |
3 Properties |
| 2017 | £227,500 | -4% |
11 Properties |
| 2016 | £236,333 | -3% |
3 Properties |
| 2015 | £244,187 | 14% |
8 Properties |
| 2014 | £210,100 | -26% |
5 Properties |
| 2013 | £264,000 | 9% |
5 Properties |
| 2012 | £239,868 | 2% |
8 Properties |
| 2011 | £236,250 | -40% |
2 Properties |
| 2010 | £331,666 | 42% |
6 Properties |
| 2009 | £193,000 | 8% |
1 Property |
| 2008 | £178,333 | -54% |
3 Properties |
| 2007 | £274,036 | 14% |
11 Properties |
| 2006 | £236,745 | 10% |
12 Properties |
| 2005 | £213,900 | -32% |
3 Properties |
| 2004 | £282,500 | 34% |
1 Property |
| 2003 | £186,445 | 2% |
10 Properties |
| 2002 | £182,600 | 23% |
5 Properties |
| 2001 | £140,929 | 20% |
12 Properties |
| 2000 | £112,991 | -14% |
6 Properties |
| 1999 | £129,303 | 12% |
13 Properties |
| 1998 | £114,300 | 18% |
5 Properties |
| 1997 | £93,416 | 21% |
6 Properties |
| 1996 | £73,590 | 23% |
11 Properties |
| 1995 | £56,833 | - |
6 Properties |
Property Price per Property Type in Knoll
Here you can find historic sold price data in order to help with your property search.
The average Property Paid Price for specific property types in the last three years are:
| Property Type | Average Sold Price | Sold Properties |
|---|---|---|
| Semi Detached House | £279,000.00 | 5 Semi Detached Houses |
| Terraced House | £173,500.00 | 5 Terraced Houses |
| Detached House | £464,375.00 | 8 Detached Houses |

