Houses for sale & to rent in Siston, Bristol
House Prices in Siston
Properties in Siston have an average house price of £331,081.00 and had 186 Property Transactions within the last 3 years¹.
Siston is an area in Bristol, South Gloucestershire with 1,829 households², where the most expensive property was sold for £680,000.00.
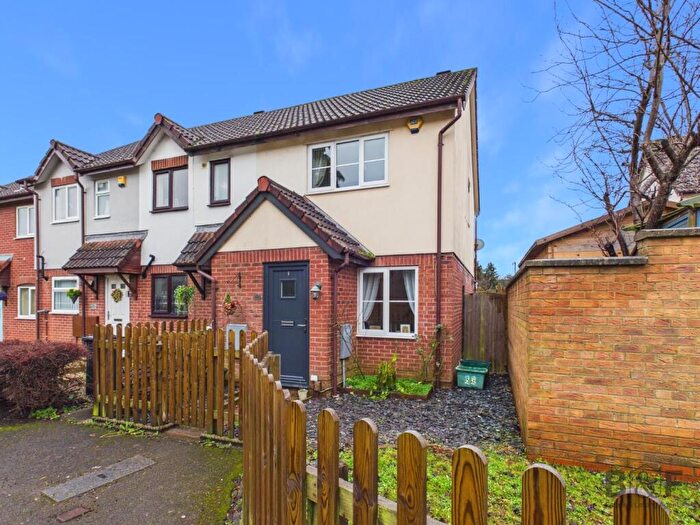
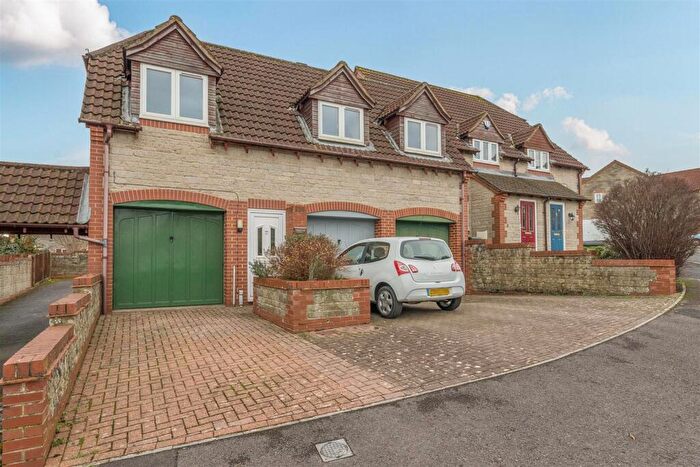
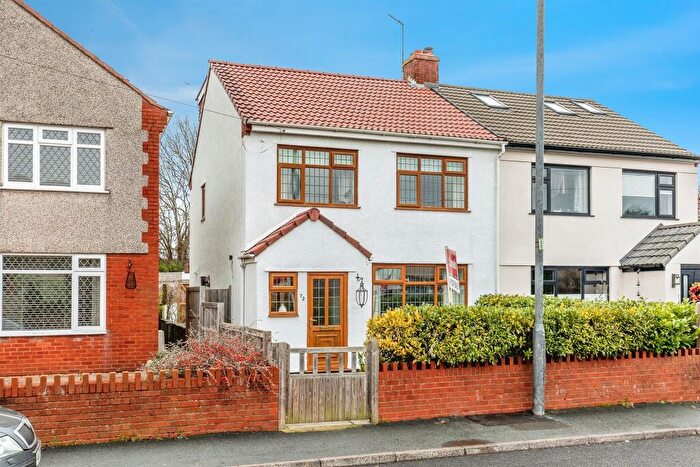
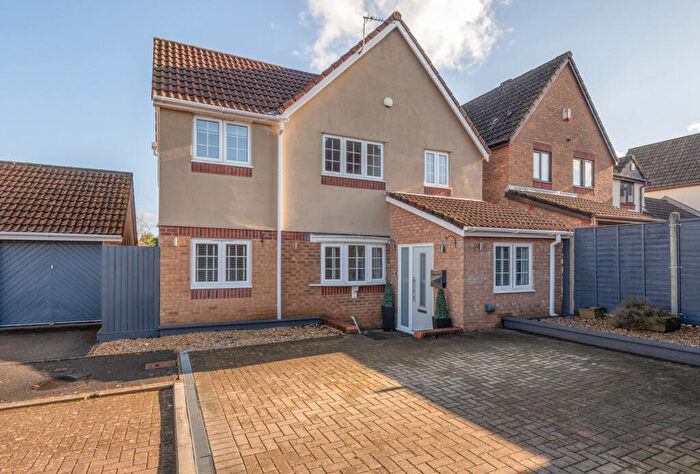
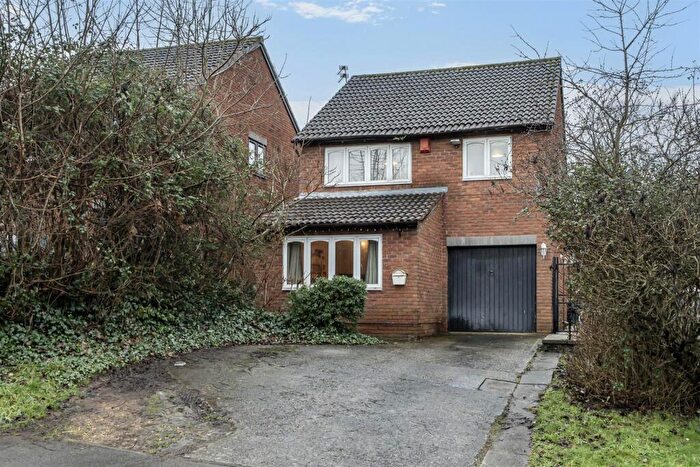
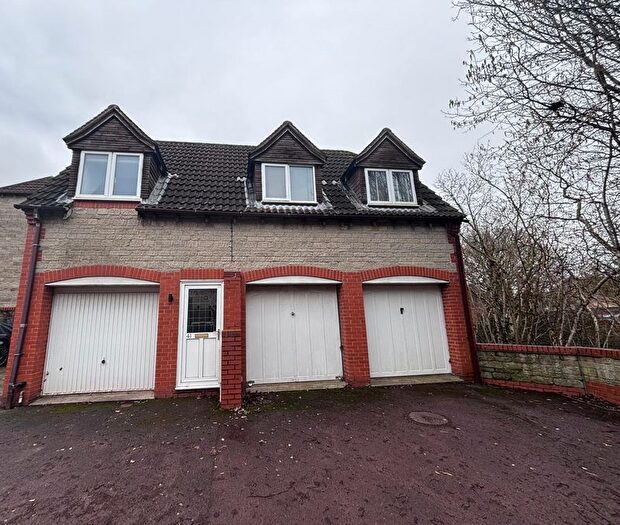
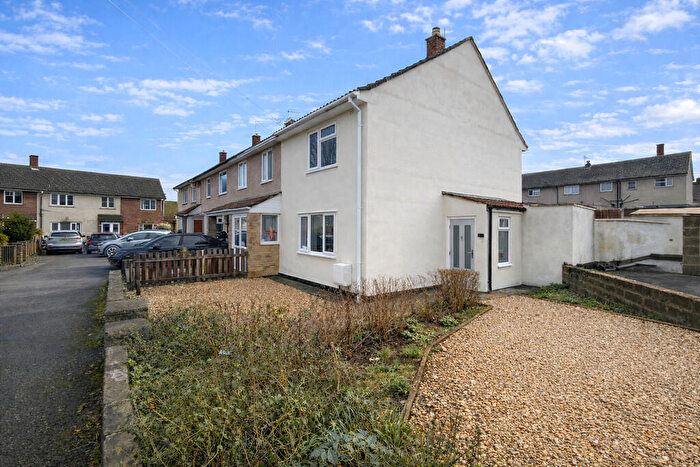
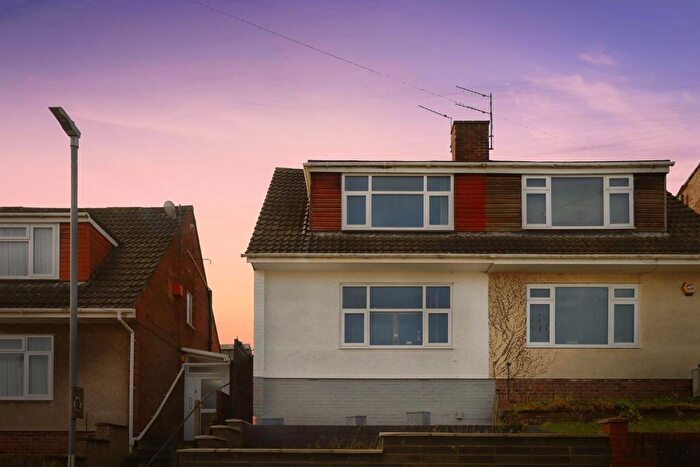
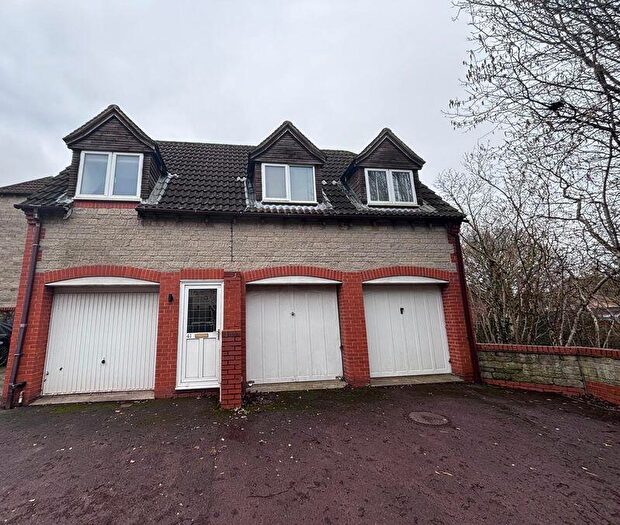
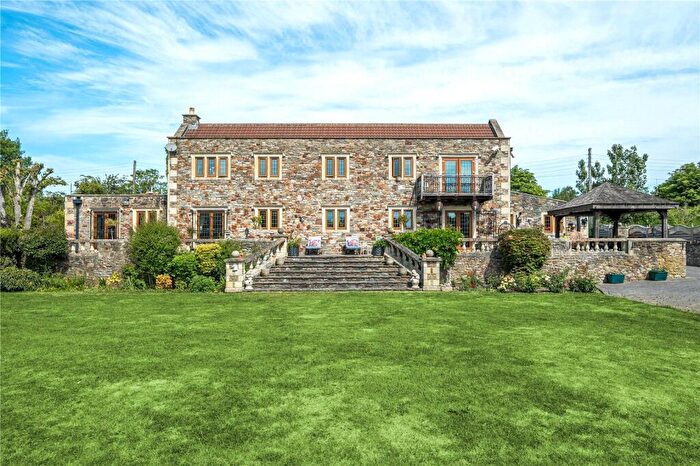
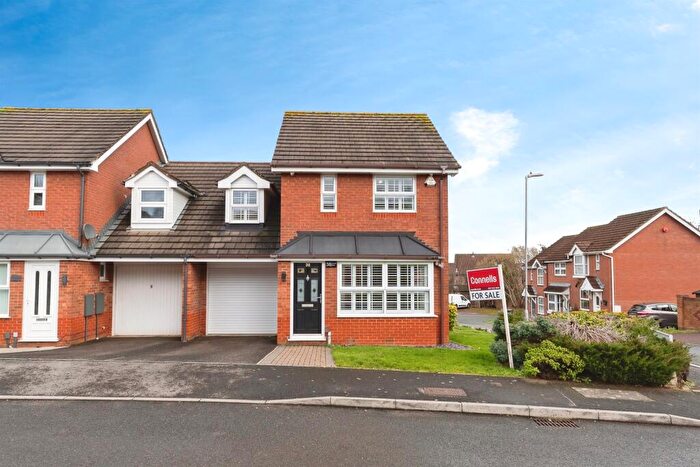
Properties for sale in Siston
Roads and Postcodes in Siston
Navigate through our locations to find the location of your next house in Siston, Bristol for sale or to rent.
| Streets | Postcodes |
|---|---|
| Arnold Road | BS16 9LB BS16 9LZ |
| Bath Road | BS30 5JW |
| Bridge Farm Walk | BS16 9LY |
| Brunel Close | BS30 5BB |
| Cann Lane | BS30 5NQ |
| Capel Close | BS15 4LS |
| Carsons Road | BS16 9LL BS16 9LP BS16 9LW |
| Chapel Close | BS15 4NH |
| Chapel Lane | BS15 4NG |
| Church Avenue | BS30 5JJ |
| Crane Close | BS15 4NT |
| Crown Gardens | BS30 8YG |
| Crown Industrial Estate | BS30 8JJ |
| Deanery Road | BS15 9JB |
| Elizabeth Way | BS16 9LN BS16 9LX |
| Fawkes Close | BS15 4LR |
| Firework Close | BS15 4LT BS15 4LU |
| Francis Way | BS30 5FW BS30 5WJ BS30 5WL |
| Goldney Avenue | BS30 5JG |
| High Street | BS15 4ND BS15 4NE BS15 4NF |
| Hinton Drive | BS30 8TZ |
| Homeapple Hill | BS30 5QF |
| Howard Walk | BS30 5WE |
| Jinty Lane | BS16 9QZ |
| Junction Way | BS16 9LA |
| Lawrence Close | BS15 4AH |
| Lodge Road | BS30 5TX |
| London Road | BS30 5JB BS30 5JH BS30 5JL BS30 5JN BS30 5NA BS30 5ND |
| Loop Road | BS16 9QS |
| Merritt Way | BS16 9QR |
| Mitchell Walk | BS30 5XY |
| Norman Road | BS30 5JA |
| Old School Close | BS30 5HX |
| Parsons Walk | BS30 5WA |
| Ridley Avenue | BS16 9QN |
| Rogers Walk | BS30 5WF |
| Roseland Gardens | BS15 4HD |
| Say Walk | BS30 5WD |
| Scott Walk | BS30 5WB |
| Shaw Close | BS16 9LD |
| Siston | BS16 9LR BS16 9LT |
| Siston Close | BS15 4NW |
| Siston Common | BS15 4NY BS15 4NZ BS15 4PA BS15 4PB BS30 5LP |
| Siston Court | BS16 9LU |
| Siston Hill | BS30 5LT BS30 5LU |
| Siston Lane | BS30 5LX BS30 5LY |
| Siston Park | BS15 4PE |
| Stanier Road | BS16 9QP |
| Stanley Road | BS15 4NS BS15 4NU BS15 4NX |
| Station Close | BS15 4NJ |
| Station Road | BS30 8XH |
| Summer House Way | BS30 8ZH |
| The Pines | BS16 9QY |
| The Sidings | BS16 9QW |
| Tower Road North | BS30 8XL BS30 8XN BS30 8XU BS30 8YE |
| Turner Walk | BS30 5WH |
| Vine Cottages | BS16 9LS |
| Wakeford Way | BS30 5HU |
| Webbs Heath | BS30 5LZ |
| Whistle Road | BS16 9QX |
| Winfield Road | BS30 5JQ |
Transport near Siston
-
Keynsham Station
-
Lawrence Hill Station
-
Stapleton Road Station
-
Bristol Parkway Station
-
Bristol Temple Meads Station
-
Filton Abbey Wood Station
- FAQ
- Price Paid By Year
- Property Type Price
Frequently asked questions about Siston
What is the average price for a property for sale in Siston?
The average price for a property for sale in Siston is £331,081. This amount is 6% lower than the average price in Bristol. There are 3,812 property listings for sale in Siston.
What streets have the most expensive properties for sale in Siston?
The streets with the most expensive properties for sale in Siston are Howard Walk at an average of £640,000, Rogers Walk at an average of £625,000 and Francis Way at an average of £571,000.
What streets have the most affordable properties for sale in Siston?
The streets with the most affordable properties for sale in Siston are Whistle Road at an average of £162,333, Old School Close at an average of £202,500 and The Sidings at an average of £206,500.
Which train stations are available in or near Siston?
Some of the train stations available in or near Siston are Keynsham, Lawrence Hill and Stapleton Road.
Property Price Paid in Siston by Year
The average sold property price by year was:
| Year | Average Sold Price | Price Change |
Sold Properties
|
|---|---|---|---|
| 2025 | £347,721 | 5% |
56 Properties |
| 2024 | £328,810 | 3% |
69 Properties |
| 2023 | £318,373 | -6% |
61 Properties |
| 2022 | £336,965 | 11% |
73 Properties |
| 2021 | £299,154 | 4% |
92 Properties |
| 2020 | £286,605 | 9% |
61 Properties |
| 2019 | £260,305 | 4% |
67 Properties |
| 2018 | £248,830 | -12% |
82 Properties |
| 2017 | £278,813 | 4% |
95 Properties |
| 2016 | £267,590 | 8% |
83 Properties |
| 2015 | £245,029 | 9% |
90 Properties |
| 2014 | £223,709 | 9% |
84 Properties |
| 2013 | £203,895 | -12% |
67 Properties |
| 2012 | £228,755 | 6% |
42 Properties |
| 2011 | £215,578 | -2% |
38 Properties |
| 2010 | £220,792 | 3% |
121 Properties |
| 2009 | £215,153 | 7% |
120 Properties |
| 2008 | £200,717 | -13% |
117 Properties |
| 2007 | £227,104 | 5% |
167 Properties |
| 2006 | £214,987 | -14% |
107 Properties |
| 2005 | £244,366 | 10% |
73 Properties |
| 2004 | £219,634 | 6% |
86 Properties |
| 2003 | £207,479 | -3% |
89 Properties |
| 2002 | £213,347 | 32% |
77 Properties |
| 2001 | £145,561 | 22% |
112 Properties |
| 2000 | £113,004 | 2% |
86 Properties |
| 1999 | £111,080 | 9% |
55 Properties |
| 1998 | £101,266 | 8% |
85 Properties |
| 1997 | £92,869 | 7% |
85 Properties |
| 1996 | £86,365 | -7% |
44 Properties |
| 1995 | £92,606 | - |
44 Properties |
Property Price per Property Type in Siston
Here you can find historic sold price data in order to help with your property search.
The average Property Paid Price for specific property types in the last three years are:
| Property Type | Average Sold Price | Sold Properties |
|---|---|---|
| Semi Detached House | £375,366.00 | 43 Semi Detached Houses |
| Detached House | £518,666.00 | 40 Detached Houses |
| Terraced House | £306,803.00 | 48 Terraced Houses |
| Flat | £181,220.00 | 55 Flats |

