
Houses for sale in Bristol, South Gloucestershire
House Prices in Bristol
Properties in Bristol have an average house price of £353k and had 11,348 Property Transactions within the last 3 years.¹
Bristol is an area in South Gloucestershire with 112,935 households², where the most expensive property was sold for £11.1M.
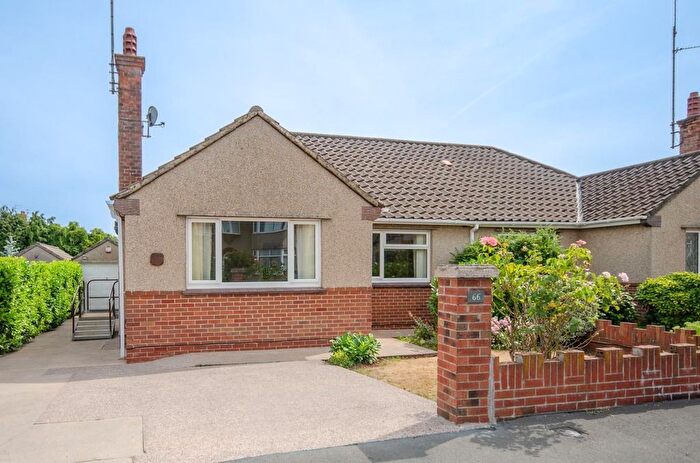
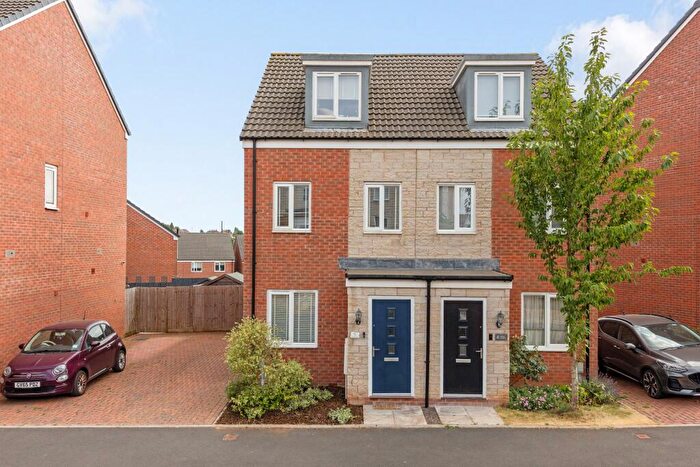
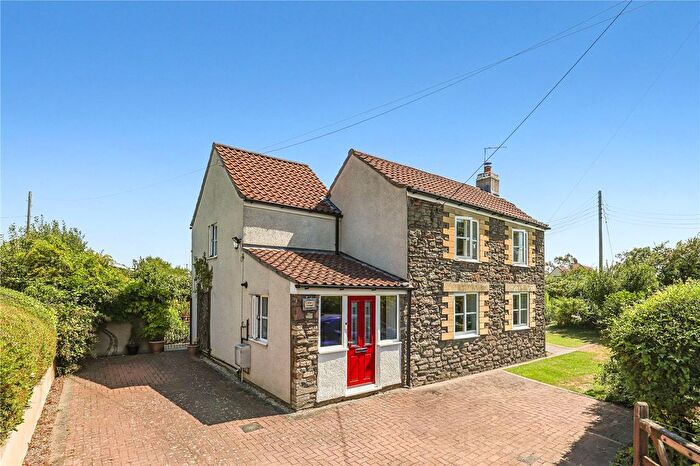
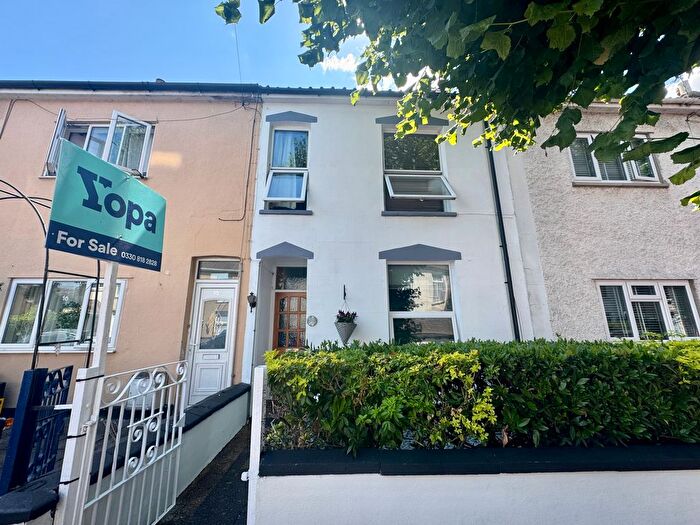
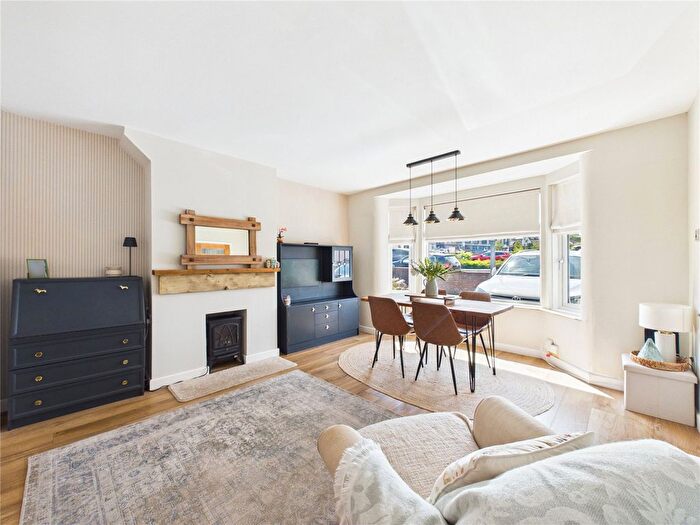
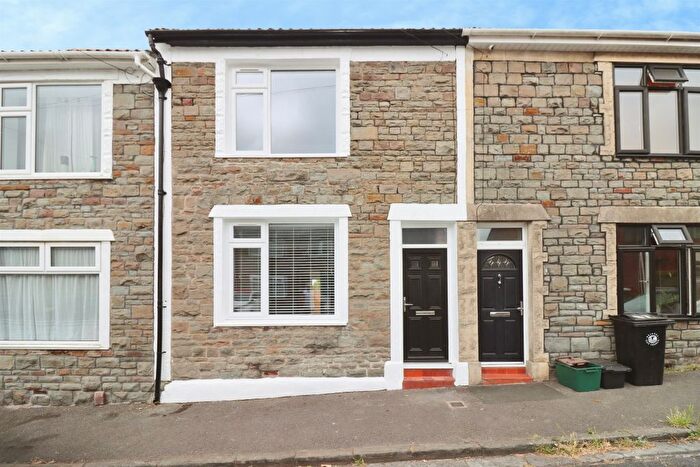
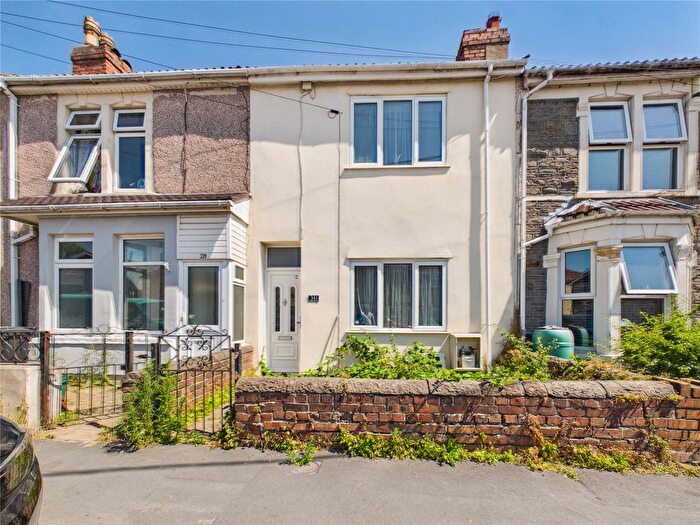
Properties for sale in Bristol
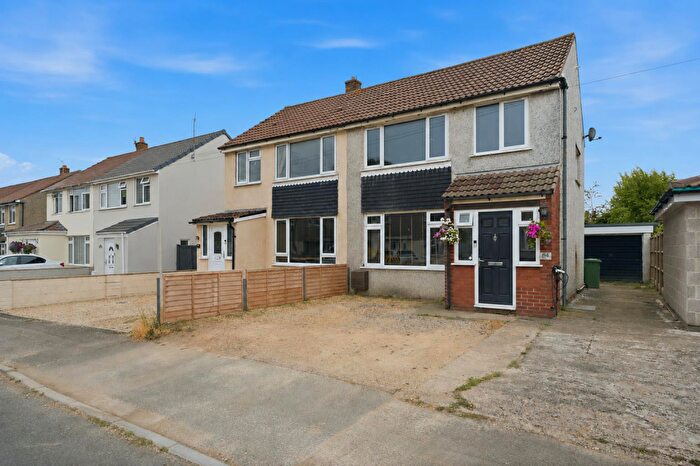

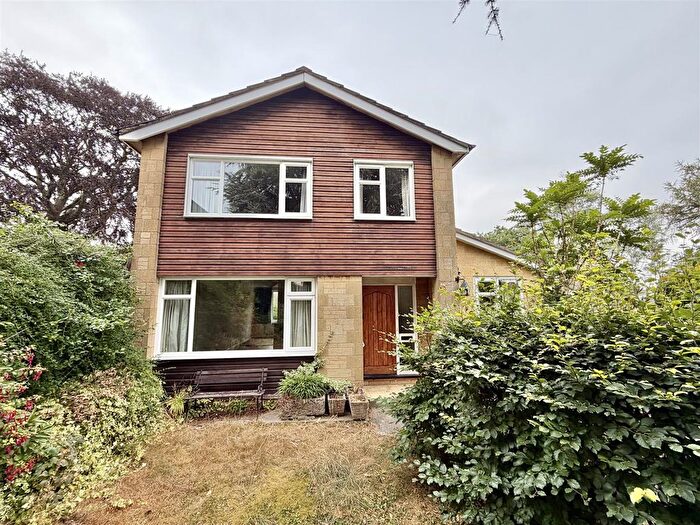
![]()
If you are looking to sell your house, let it out, or receive a property valuation, an expert can help you.
Click the button below to get started.
Neighbourhoods in Bristol
Navigate through our locations to find the location of your next house in Bristol, South Gloucestershire for sale or to rent.
- Henbury and Brentry
- Almondsbury
- Bitton
- Boyd Valley
- Bradley Stoke Central And Stoke Lodge
- Bradley Stoke North
- Bradley Stoke South
- Chipping Sodbury
- Cotswold Edge
- Dodington
- Downend
- Emersons Green
- Filton
- Frampton Cotterell
- Frenchay And Stoke Park
- Hanham
- Kings Chase
- Ladden Brook
- Longwell Green
- Oldland Common
- Parkwall
- Patchway
- Pilning And Severn Beach
- Rodway
- Severn
- Siston
- Staple Hill
- Stoke Gifford
- Thornbury North
- Thornbury South And Alveston
- Westerleigh
- Winterbourne
- Woodstock
- Yate Central
- Yate North
- Charlton & Cribbs
- Pilning & Severn Beach
- New Cheltenham
- Parkwall & Warmley
- Stoke Park & Cheswick
- Frenchay & Downend
- Staple Hill & Mangotsfield
- Bitton & Oldland Common
- Patchway Coniston
- Severn Vale
- Thornbury
- Chipping Sodbury & Cotswold Edge
- Kingswood
Property price trends in Bristol
According to the latest Land Registry data, the average home in Bristol sold for £360,620 in 2026. That figure comes from a substantial record of 149,725 sales logged over the past 31 years.
Prices have moved up over the last three years. Compared with 2023, when the typical sale came in around £350,745, that's a rise of roughly 2.8%.
Looking back five years, average prices are up about 11.8% since 2021, a gain of around £38,157 in cash terms.
Zoom out to the past decade for the fuller picture. Back in 2016, homes here averaged £261,697, so the typical sold price has climbed about 37.8% since then, roughly 3.3% a year. Stretch the view to fifteen years and that annual pace edges up closer to 3.9%.
Frequently asked questions about Bristol
What is the average price for a property for sale in Bristol?
The average price for a property for sale in Bristol is £352,561. This amount is 1% lower than the average price in South Gloucestershire. There are more than 10,000 property listings for sale in Bristol.
What locations have the most expensive properties for sale in Bristol?
The locations with the most expensive properties for sale in Bristol are Cotswold Edge at an average of £685,000, Severn at an average of £583,950 and Almondsbury at an average of £571,294.
What locations have the most affordable properties for sale in Bristol?
The locations with the most affordable properties for sale in Bristol are Kingswood at an average of £178,722, Staple Hill & Mangotsfield at an average of £221,588 and New Cheltenham at an average of £241,500.
Which train stations are available in or near Bristol?
Some of the train stations available in or near Bristol are Bristol Parkway, Filton Abbey Wood and Patchway.
Property Price Paid in Bristol by Year
The average sold property price by year was:
| Year | Average Sold Price | Price Change |
Sold Properties
|
|---|---|---|---|
| 2026 | £360,620 | 2% |
297 Properties |
| 2025 | £353,749 | 0,4% |
3,686 Properties |
| 2024 | £352,453 | 0,5% |
3,863 Properties |
| 2023 | £350,745 | 0,3% |
3,502 Properties |
| 2022 | £349,669 | 8% |
4,331 Properties |
| 2021 | £322,463 | 3% |
5,455 Properties |
| 2020 | £313,396 | 3% |
3,981 Properties |
| 2019 | £303,443 | 4% |
5,009 Properties |
| 2018 | £290,734 | 3% |
4,938 Properties |
| 2017 | £280,706 | 7% |
5,078 Properties |
Property Price per Property Type in Bristol
Here you can find historic sold price data in order to help with your property search.
The average Property Paid Price for specific property types in the last three years are:
| Property Type | Average Sold Price | Sold Properties |
|---|---|---|
| Semi Detached House | £357,122.00 | 3,589 Semi Detached Houses |
| Terraced House | £302,577.00 | 3,637 Terraced Houses |
| Detached House | £523,372.00 | 2,449 Detached Houses |
| Flat | £201,399.00 | 1,673 Flats |
Transport in Bristol
Please see below transportation links in this area:
