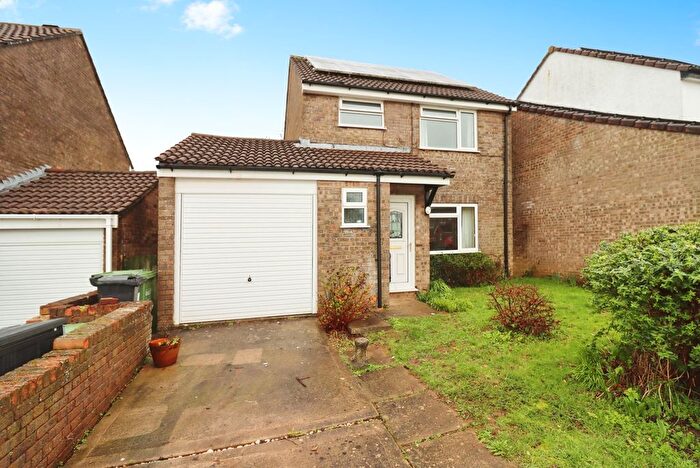
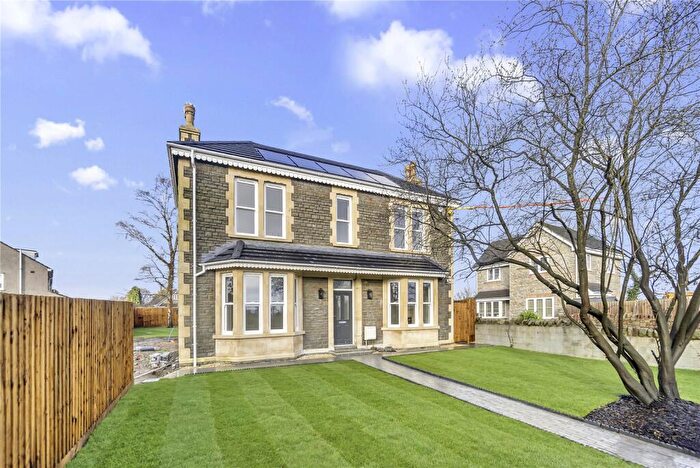
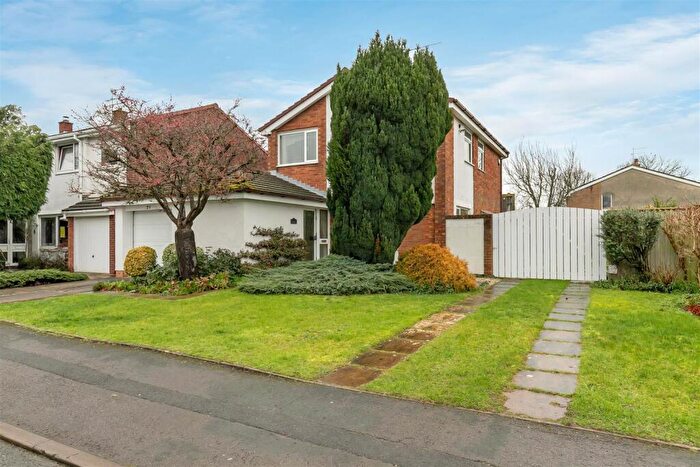
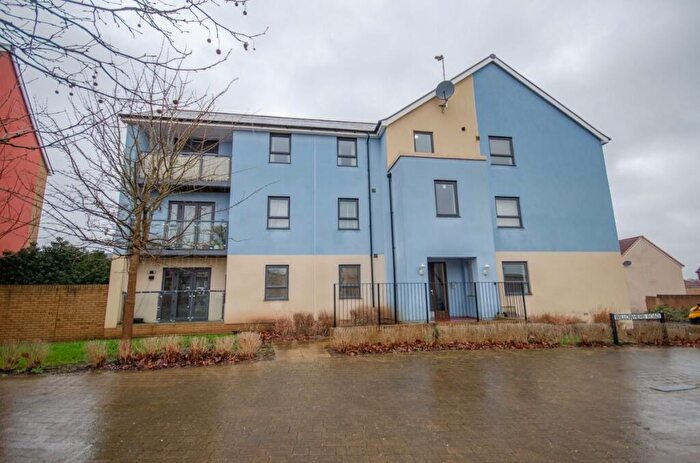
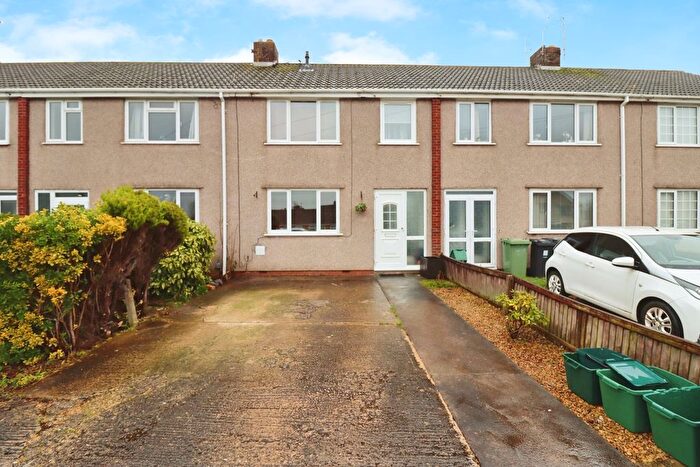
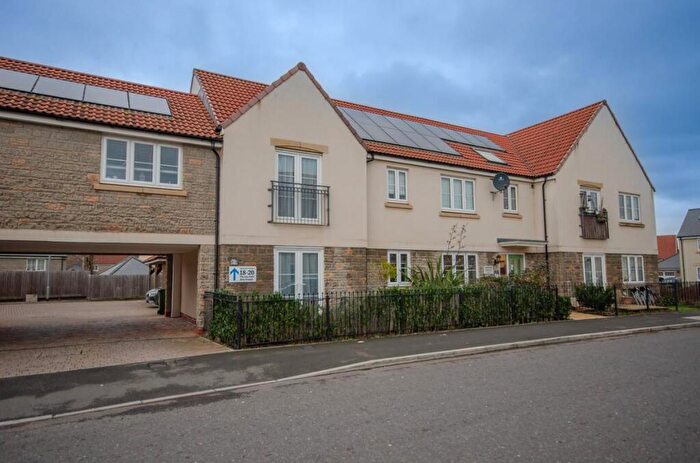
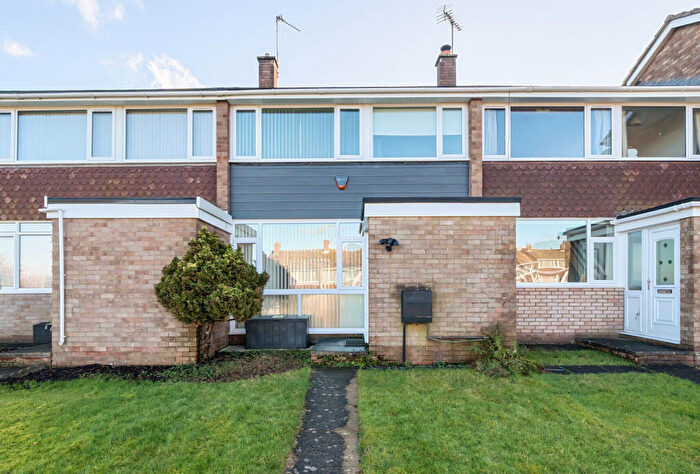
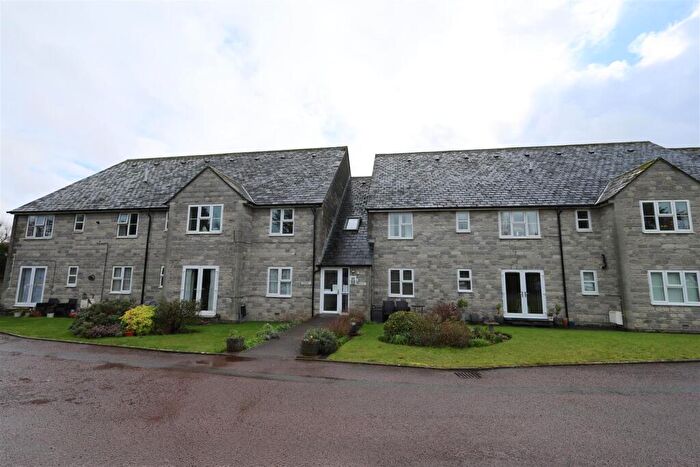
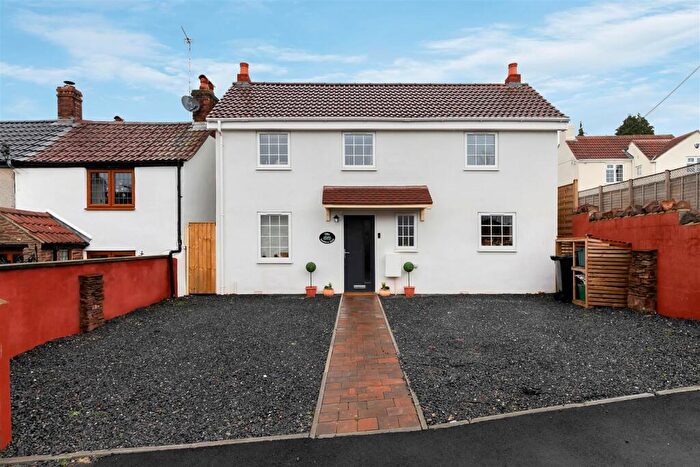
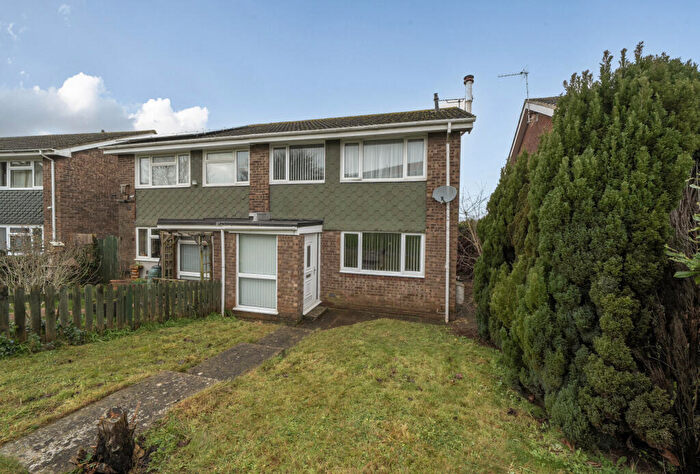
Houses for sale & to rent in Westerleigh, Bristol
House Prices in Westerleigh
Properties in Westerleigh have an average house price of £480,739.00 and had 115 Property Transactions within the last 3 years¹.
Westerleigh is an area in Bristol, South Gloucestershire with 1,381 households², where the most expensive property was sold for £1,375,000.00.
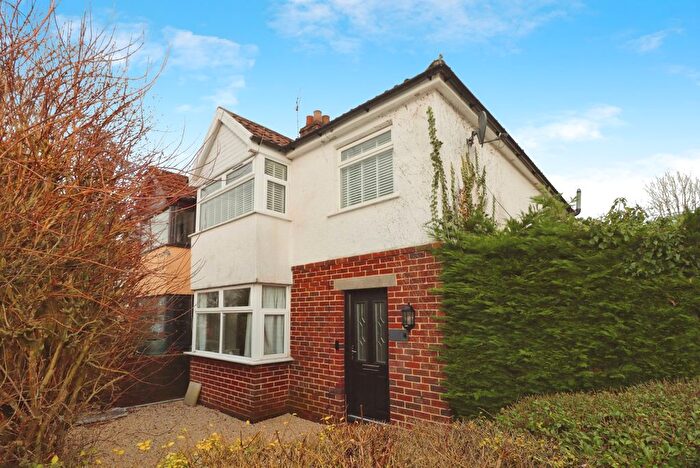
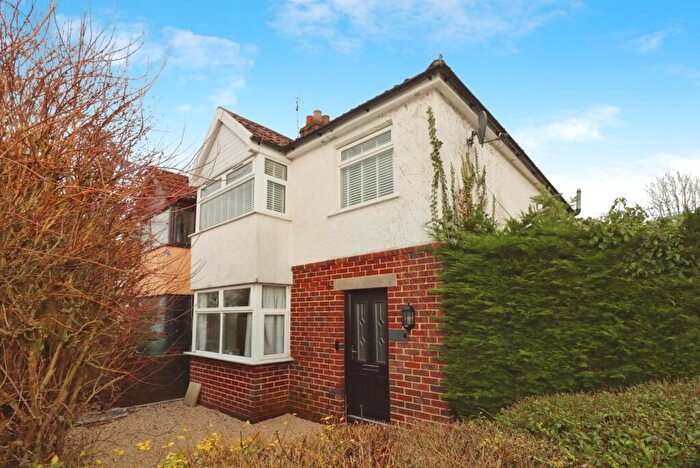
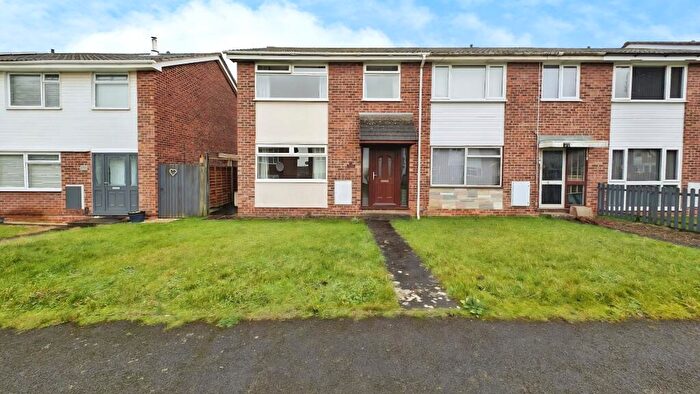
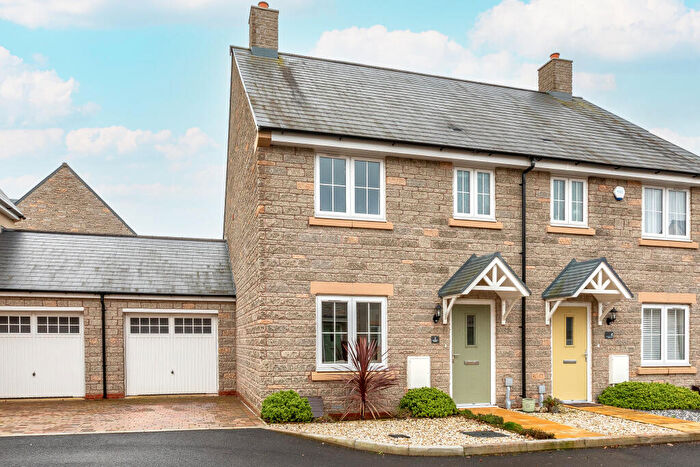
Properties for sale in Westerleigh
Roads and Postcodes in Westerleigh
Navigate through our locations to find the location of your next house in Westerleigh, Bristol for sale or to rent.
| Streets | Postcodes |
|---|---|
| Badminton Road | BS36 1AL BS36 2NL BS36 2NN BS36 2NR BS36 2NT BS36 2NU BS36 2QA BS36 2QB BS36 2QD BS36 2QE BS36 2QF BS36 2QG BS36 2QH BS36 2QJ BS36 2QL BS36 2QQ BS36 2QW BS36 2ST BS36 2SU BS36 2SX BS36 2SY BS36 2SZ BS36 2TB BS36 2TD BS37 5HX BS37 5JE BS37 5JF |
| Beesmoor Road | BS36 2RP BS36 2RS |
| Bell Road | BS36 2SA |
| Besom Lane | BS37 8RW |
| Bitterwell Close | BS36 2UQ |
| Box Hedge Lane | BS36 2UW |
| Broad Lane | BS36 2TY BS37 8QX |
| Burcombe Close | BS36 2JU |
| Catchpot Lane | BS37 6SP |
| Chapel Orchard | BS37 7PL |
| Church Road | BS36 2NA |
| Coalsack Lane | BS36 1AX |
| Coalville Road | BS36 2QS |
| Codrington | BS37 6RZ BS37 6SA |
| Codrington Road | BS37 8RG BS37 8RQ |
| Cooks Lane | BS36 2UR |
| Dodington | BS37 6SE BS37 6SG |
| Dodington Lane | BS37 6SB BS37 6SD |
| Dodington Road | BS37 6HS BS37 6HU |
| Dormer Close | BS36 2LX |
| Down Road | BS36 1AU |
| Frampton End Road | BS37 9TD |
| Heath Gardens | BS36 2TQ |
| Henfield Road | BS36 2TE BS36 2TF BS36 2TG BS36 2UH BS36 2UJ BS36 2UL |
| Homestead Close | BS36 2FB |
| Huckford Lane | BS36 1AP |
| Ivy Terrace | BS37 8QP |
| Kidney Hill | BS37 8QY |
| Manor Close | BS36 2RR |
| Mays Hill | BS36 2NS |
| Mill Crescent | BS37 8QS |
| Newman Close | BS37 8QT |
| Nibley Lane | BS37 5HL |
| North Road | BS37 7PR BS37 7PW |
| Oakley Green | BS37 8QZ |
| Oakwood Gardens | BS36 2NB |
| Old Mill Close | BS37 8QD |
| Park Lane | BS36 1AS BS36 1AT |
| Ram Hill | BS36 2TX BS36 2TZ BS36 2UA BS36 2UF BS36 2UG |
| Rathbone Close | BS36 2TN BS36 2TW |
| Rose Oak Drive | BS36 2AS |
| Rose Oak Lane | BS36 2QX BS36 2QZ |
| Roundways | BS36 2LF BS36 2LT BS36 2LU BS36 2LY BS36 2QY BS36 2RA |
| Ruffet Road | BS36 1AN |
| Short Hill Road | BS37 8QN |
| South Avenue | BS37 5JA |
| South View Crescent | BS36 2LP BS36 2LR BS36 2LW |
| South View Rise | BS36 2LS |
| St Annes Drive | BS36 2TH |
| Station Road | BS36 2TJ |
| Stover Road | BS37 5JN |
| Sunnybank | BS37 8RA |
| The Barton | BS37 8QR |
| The Brake | BS36 2TL |
| The Causeway | BS36 2PG |
| The Hollows | BS36 2US BS36 2UT BS36 2UU |
| The Quadrangle | BS37 8QL |
| The Willows | BS36 2NW |
| Vicarage Road | BS36 2RT BS36 2RU |
| Walnut Close | BS36 2DL |
| Wapley Hill | BS37 8RJ |
| Wapley Road | BS37 6RY |
| Watters Close | BS36 2LZ |
| Wayleaze | BS36 2PL |
| Westerleigh Hill | BS37 8RD |
| Westerleigh Road | BS37 8QG BS37 8QQ |
| Woodside Road | BS36 2QP BS36 2QR BS36 2QU |
| BS37 8QF BS37 8QH BS37 8QU |
Transport near Westerleigh
- FAQ
- Price Paid By Year
- Property Type Price
Frequently asked questions about Westerleigh
What is the average price for a property for sale in Westerleigh?
The average price for a property for sale in Westerleigh is £480,739. This amount is 37% higher than the average price in Bristol. There are 7,798 property listings for sale in Westerleigh.
What streets have the most expensive properties for sale in Westerleigh?
The streets with the most expensive properties for sale in Westerleigh are Ram Hill at an average of £902,500, Mays Hill at an average of £787,500 and Wapley Road at an average of £717,500.
What streets have the most affordable properties for sale in Westerleigh?
The streets with the most affordable properties for sale in Westerleigh are Newman Close at an average of £217,500, Chapel Orchard at an average of £239,000 and Homestead Close at an average of £246,500.
Which train stations are available in or near Westerleigh?
Some of the train stations available in or near Westerleigh are Yate, Bristol Parkway and Patchway.
Property Price Paid in Westerleigh by Year
The average sold property price by year was:
| Year | Average Sold Price | Price Change |
Sold Properties
|
|---|---|---|---|
| 2025 | £515,396 | 9% |
29 Properties |
| 2024 | £467,810 | -1% |
50 Properties |
| 2023 | £470,780 | 10% |
36 Properties |
| 2022 | £422,527 | 1% |
44 Properties |
| 2021 | £419,707 | 7% |
57 Properties |
| 2020 | £390,679 | -1% |
44 Properties |
| 2019 | £392,914 | 7% |
45 Properties |
| 2018 | £364,385 | 10% |
49 Properties |
| 2017 | £329,262 | -1% |
44 Properties |
| 2016 | £331,351 | 0,4% |
37 Properties |
| 2015 | £330,004 | 18% |
44 Properties |
| 2014 | £271,169 | 12% |
46 Properties |
| 2013 | £237,331 | -1% |
40 Properties |
| 2012 | £239,642 | -10% |
35 Properties |
| 2011 | £264,723 | -5% |
38 Properties |
| 2010 | £277,122 | 5% |
40 Properties |
| 2009 | £262,873 | 3% |
34 Properties |
| 2008 | £254,652 | -17% |
36 Properties |
| 2007 | £298,464 | 15% |
64 Properties |
| 2006 | £252,843 | 7% |
64 Properties |
| 2005 | £235,478 | -4% |
56 Properties |
| 2004 | £245,793 | 14% |
51 Properties |
| 2003 | £210,840 | 7% |
50 Properties |
| 2002 | £196,857 | 19% |
83 Properties |
| 2001 | £160,193 | -8% |
66 Properties |
| 2000 | £172,626 | 35% |
66 Properties |
| 1999 | £112,090 | -9% |
58 Properties |
| 1998 | £122,500 | 22% |
94 Properties |
| 1997 | £95,155 | 10% |
44 Properties |
| 1996 | £85,739 | -16% |
56 Properties |
| 1995 | £99,781 | - |
32 Properties |
Property Price per Property Type in Westerleigh
Here you can find historic sold price data in order to help with your property search.
The average Property Paid Price for specific property types in the last three years are:
| Property Type | Average Sold Price | Sold Properties |
|---|---|---|
| Semi Detached House | £385,089.00 | 56 Semi Detached Houses |
| Detached House | £614,041.00 | 50 Detached Houses |
| Terraced House | £352,937.00 | 8 Terraced Houses |
| Flat | £194,500.00 | 1 Flat |

