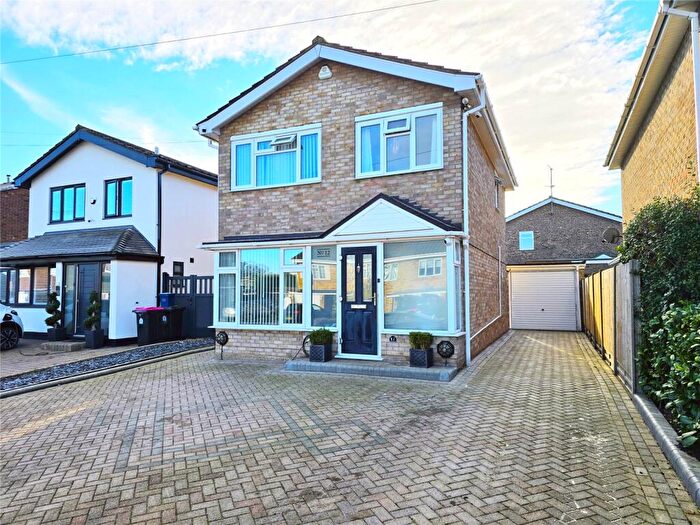
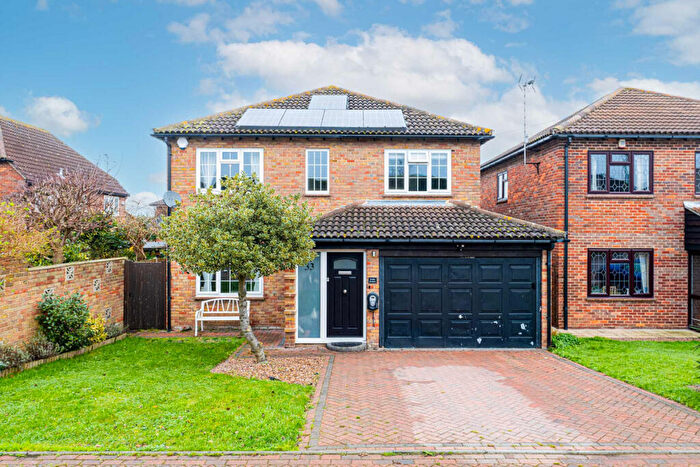
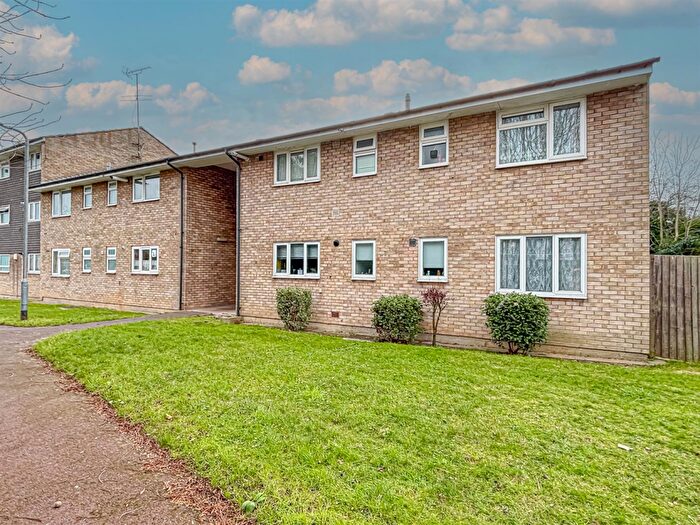
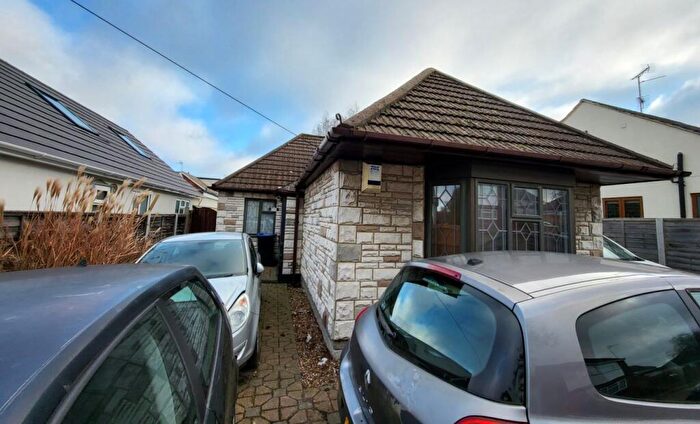
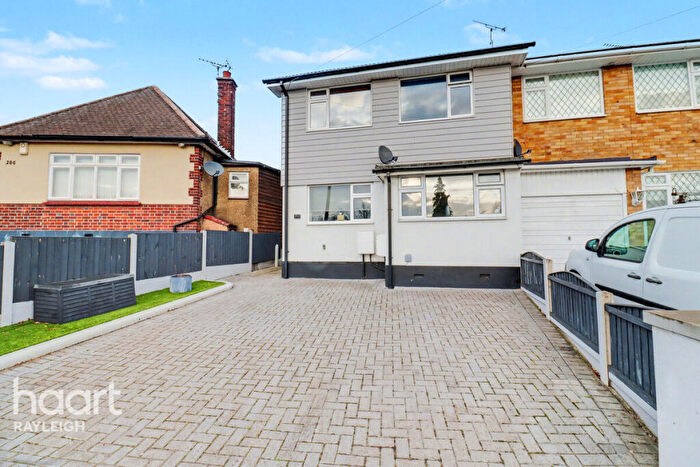
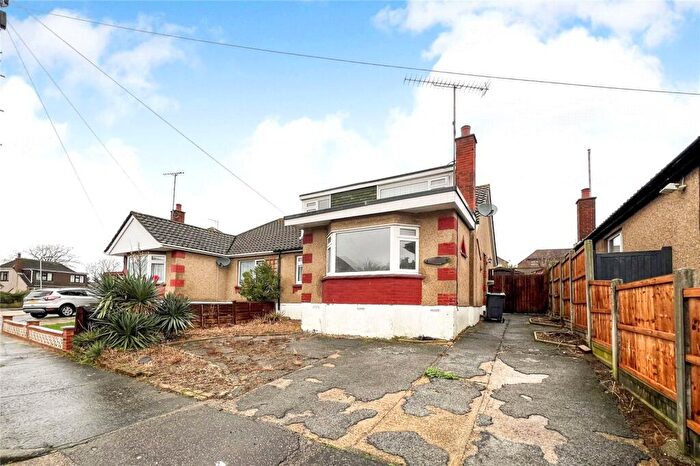
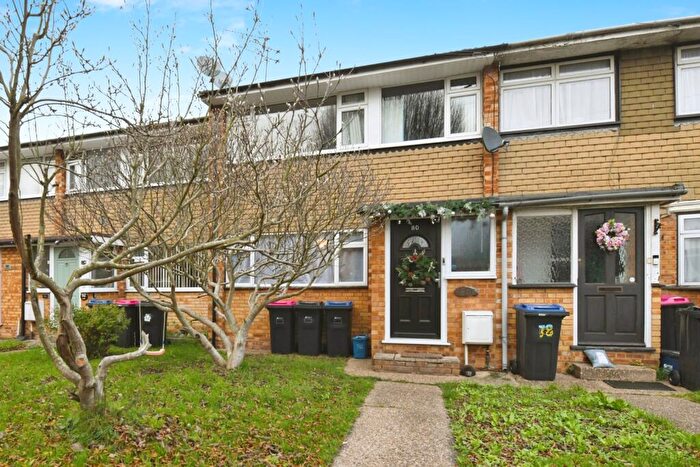
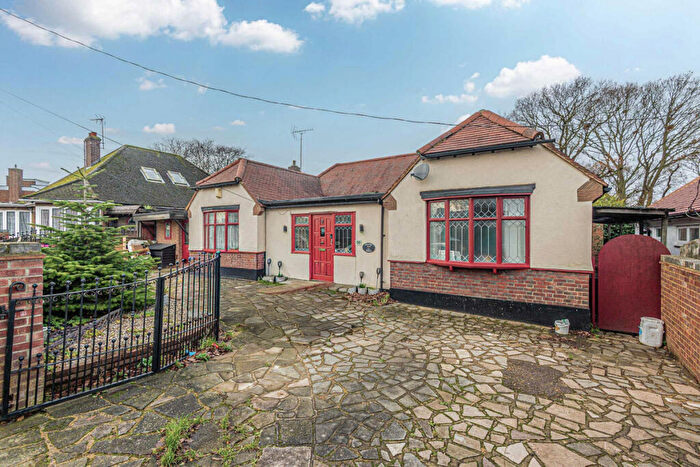
Houses for sale & to rent in Eastwood Park, Leigh-on-sea
House Prices in Eastwood Park
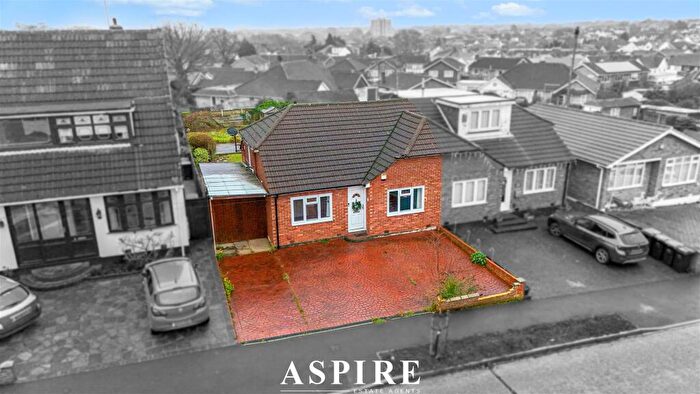
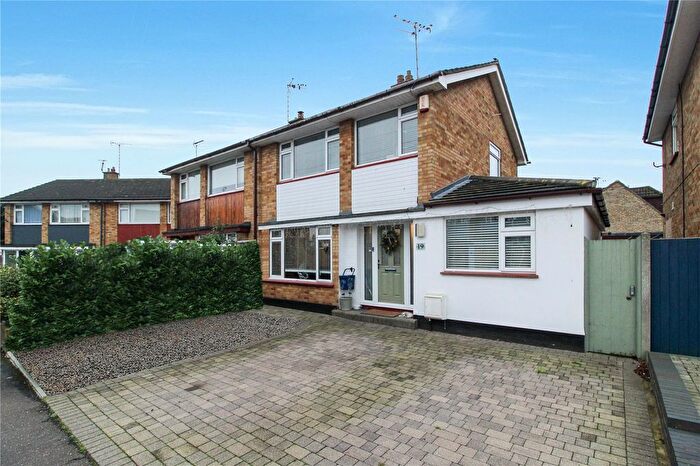
Properties in Eastwood Park have an average house price of £364,148.00 and had 518 Property Transactions within the last 3 years¹.
Eastwood Park is an area in Leigh-on-sea, Southend-on-Sea with 4,003 households², where the most expensive property was sold for £960,000.00.
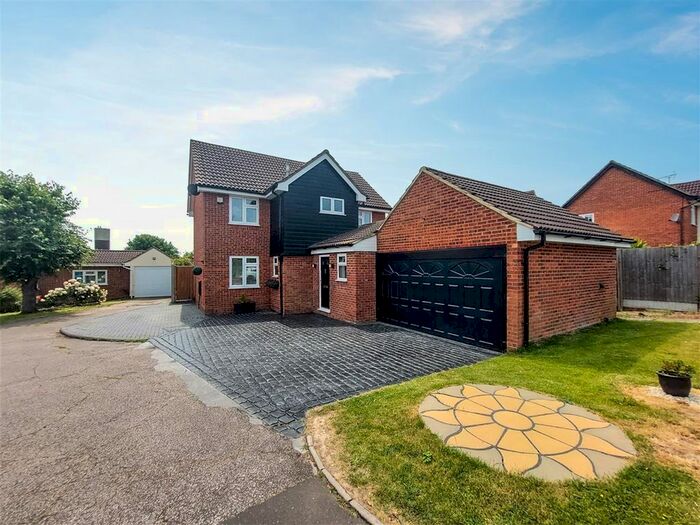
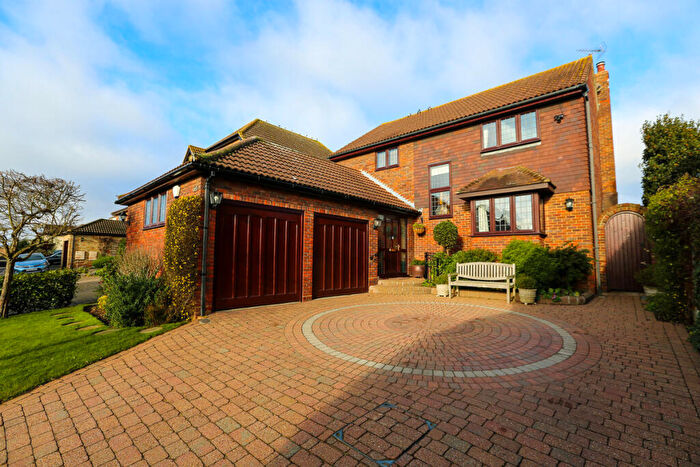
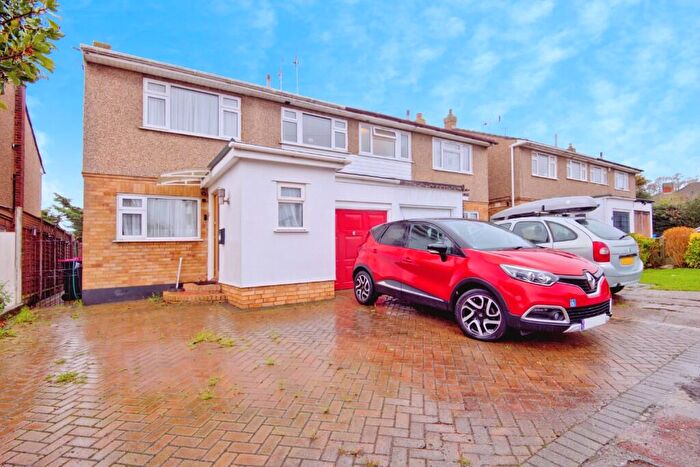
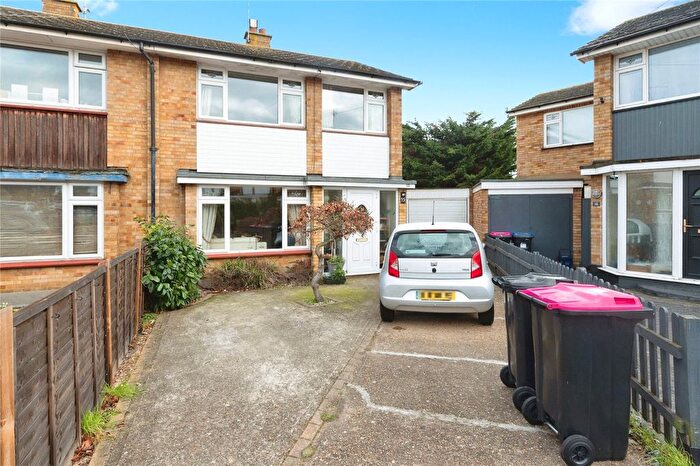
Properties for sale in Eastwood Park
Roads and Postcodes in Eastwood Park
Navigate through our locations to find the location of your next house in Eastwood Park, Leigh-on-sea for sale or to rent.
| Streets | Postcodes |
|---|---|
| Airborne Close | SS9 4EN |
| Airborne Industrial Estate | SS9 4EX |
| Alan Close | SS9 5RX |
| Alan Grove | SS9 5RU |
| Anstey Close | SS9 5AW |
| Arterial Road | SS9 4DH SS9 4DL SS9 4DY SS9 4DZ SS9 4XX |
| Belgrave Close | SS9 5EU |
| Belgrave Road | SS9 5EL SS9 5ET SS9 5HE |
| Bellhouse Road | SS9 5NG SS9 5NH SS9 5NL SS9 5NQ |
| Benvenue Avenue | SS9 5SJ |
| Blatches Chase | SS9 5SY |
| Boleyn Close | SS9 5AY |
| Bolney Drive | SS9 5HQ |
| Bosworth Road | SS9 5AA SS9 5AB SS9 5AD |
| Boundary Road | SS9 5BP |
| Bowman Avenue | SS9 5EP |
| Bramble Close | SS9 5HD |
| Bramble Road | SS9 5HA SS9 5HB |
| Brookfields | SS9 5PG |
| Brookfields Close | SS9 5PQ |
| Brooklands Avenue | SS9 5XA |
| Brunel Road | SS9 5JL |
| Byfield | SS9 5TG |
| Cabinet Way | SS9 5LF SS9 5LP |
| Chanton Close | SS9 5RB |
| Chesterfield Crescent | SS9 5PD |
| Cornec Avenue | SS9 5EN |
| Cornec Chase | SS9 5EW |
| Dandies Chase | SS9 5RF |
| Dandies Close | SS9 5RQ |
| Dandies Drive | SS9 5RA SS9 5RG |
| Dering Crescent | SS9 5RD SS9 5RE |
| Eastwood Park Close | SS9 5RS |
| Eastwood Park Drive | SS9 5RP SS9 5RR |
| Eastwood Rise | SS9 5BS SS9 5BT |
| Epping Close | SS9 5QB |
| Fairfield Crescent | SS9 5SG SS9 5SQ |
| Fairfield Gardens | SS9 5SD SS9 5SF |
| Fairfield Road | SS9 5RY SS9 5RZ SS9 5SB |
| Faraday Road | SS9 5JU |
| Flamboro Close | SS9 5NT |
| Flamboro Walk | SS9 5NU |
| Gipson Park Close | SS9 5PW |
| Glenwood Avenue | SS9 5EA SS9 5EB |
| Gravel Road | SS9 5AS SS9 5AT |
| Green Lane | SS9 5AP SS9 5QJ SS9 5QL SS9 5QN SS9 5QU SS9 5QW SS9 5QX SS9 5RJ |
| Grove Hill | SS9 5EH |
| Grovewood Avenue | SS9 5EG SS9 5EQ SS9 5EF |
| Grovewood Close | SS9 5EJ |
| Hartland Close | SS9 5RH |
| Hazelwood Grove | SS9 4DE |
| Heycroft Road | SS9 5SW |
| Hudson Crescent | SS9 5XT SS9 5XU |
| Hudson Road | SS9 5NX SS9 5NY SS9 5PA SS9 5NF |
| Hylands Grove | SS9 5FN |
| Kendal Way | SS9 5QS |
| Lambeth Road | SS9 5XR |
| Langley Close | SS9 5HS |
| Leighfields Avenue | SS9 5NN |
| Leighfields Road | SS9 5NR SS9 5NS |
| Leslie Close | SS9 5NP |
| Leslie Drive | SS9 5NW |
| Macmurdo Close | SS9 5AH |
| Macmurdo Road | SS9 5AQ |
| Mansel Close | SS9 5XX SS9 5YB |
| Mansell Close | SS9 5YA |
| Musket Grove | SS9 5EX SS9 5EY |
| Nobles Green Close | SS9 5QH |
| Nobles Green Road | SS9 5QA SS9 5QQ |
| Paddock Close | SS9 5QP SS9 5QR |
| Pargat Drive | SS9 5HH |
| Park Avenue | SS9 5XB |
| Park View Court | SS9 5YH |
| Parkway Close | SS9 5RL |
| Pinewood Avenue | SS9 5PB SS9 5PH |
| Poppyfield Close | SS9 5PJ |
| Priorywood Crescent | SS9 4DF |
| Progress Road | SS9 5JA SS9 5JT SS9 5LE SS9 5PR |
| Rayleigh Road | SS9 5HJ SS9 5HL SS9 5HP SS9 5HR SS9 5HU SS9 5HW SS9 5HX SS9 5HZ SS9 5PS SS9 5PT SS9 5PU SS9 5PX SS9 5PY SS9 5PZ SS9 5UU SS9 5UZ SS9 5XE SS9 5XH SS9 5XL SS9 5XN SS9 5XQ SS9 5YG SS9 5YJ SS9 5JG SS9 5XW |
| Ringwood Drive | SS9 5HG |
| Riverdale | SS9 5QY |
| Roach Vale | SS9 5TQ |
| Rodings Close | SS9 5FP |
| Rowan Walk | SS9 5PL SS9 5PN |
| Rutherford Close | SS9 5LQ |
| Saffory Close | SS9 5HY |
| Sairard Close | SS9 5AL |
| Sairard Gardens | SS9 5AJ |
| Southernhay | SS9 5PE SS9 5PF |
| Springwater Close | SS9 5BN |
| Springwater Grove | SS9 5BL |
| Springwater Road | SS9 5BJ SS9 5BW |
| St Lawrence Gardens | SS9 5YD SS9 5YE SS9 5YF |
| Steeplefield | SS9 5XJ SS9 5XP SS9 5XS |
| Stephenson Road | SS9 5LY |
| Sunnybank Close | SS9 5SP |
| Symons Avenue | SS9 5QD SS9 5QE |
| The Crest | SS9 5NJ |
| The Green | SS9 5RT |
| The Maze | SS9 5RW |
| The Rodings | SS9 5AZ |
| The Spinneys | SS9 5QZ |
| Tudor Close | SS9 5AR |
| Tudor Road | SS9 5AU SS9 5AX |
| Walters Close | SS9 5YQ |
| Whitehouse Road | SS9 5SH SS9 5SR |
| Willow Close | SS9 5XG |
| Winchester Close | SS9 5TF |
| Wren Avenue | SS9 5AF SS9 5AN |
| Wren Close | SS9 5AG |
Transport near Eastwood Park
-
Leigh-On-Sea Station
-
Chalkwell Station
-
Southend Airport Station
-
Hockley Station
-
Rochford Station
-
Rayleigh Station
-
Westcliff Station
-
Prittlewell Station
- FAQ
- Price Paid By Year
- Property Type Price
Frequently asked questions about Eastwood Park
What is the average price for a property for sale in Eastwood Park?
The average price for a property for sale in Eastwood Park is £364,148. This amount is 17% lower than the average price in Leigh-on-sea. There are 1,742 property listings for sale in Eastwood Park.
What streets have the most expensive properties for sale in Eastwood Park?
The streets with the most expensive properties for sale in Eastwood Park are Green Lane at an average of £570,250, Nobles Green Close at an average of £570,000 and Parkway Close at an average of £535,000.
What streets have the most affordable properties for sale in Eastwood Park?
The streets with the most affordable properties for sale in Eastwood Park are Musket Grove at an average of £150,000, Mansel Close at an average of £236,750 and Rayleigh Road at an average of £267,280.
Which train stations are available in or near Eastwood Park?
Some of the train stations available in or near Eastwood Park are Leigh-On-Sea, Chalkwell and Southend Airport.
Property Price Paid in Eastwood Park by Year
The average sold property price by year was:
| Year | Average Sold Price | Price Change |
Sold Properties
|
|---|---|---|---|
| 2025 | £392,320 | 8% |
85 Properties |
| 2024 | £361,809 | 5% |
145 Properties |
| 2023 | £344,611 | -6% |
123 Properties |
| 2022 | £366,255 | 4% |
165 Properties |
| 2021 | £351,700 | 7% |
253 Properties |
| 2020 | £327,213 | 4% |
144 Properties |
| 2019 | £314,876 | 3% |
148 Properties |
| 2018 | £305,592 | 3% |
173 Properties |
| 2017 | £295,024 | 2% |
171 Properties |
| 2016 | £289,015 | 14% |
182 Properties |
| 2015 | £247,307 | 10% |
152 Properties |
| 2014 | £223,395 | 9% |
198 Properties |
| 2013 | £204,019 | 1% |
166 Properties |
| 2012 | £201,767 | 6% |
117 Properties |
| 2011 | £190,180 | -5% |
145 Properties |
| 2010 | £199,669 | 3% |
116 Properties |
| 2009 | £192,723 | -4% |
116 Properties |
| 2008 | £199,872 | -7% |
85 Properties |
| 2007 | £213,514 | 10% |
226 Properties |
| 2006 | £191,459 | 4% |
229 Properties |
| 2005 | £184,350 | 1% |
149 Properties |
| 2004 | £182,615 | 11% |
203 Properties |
| 2003 | £163,229 | 18% |
173 Properties |
| 2002 | £133,995 | 16% |
235 Properties |
| 2001 | £112,044 | 10% |
203 Properties |
| 2000 | £101,004 | 8% |
205 Properties |
| 1999 | £93,163 | 18% |
228 Properties |
| 1998 | £76,509 | 8% |
197 Properties |
| 1997 | £70,081 | 12% |
229 Properties |
| 1996 | £61,444 | -2% |
210 Properties |
| 1995 | £62,551 | - |
154 Properties |
Property Price per Property Type in Eastwood Park
Here you can find historic sold price data in order to help with your property search.
The average Property Paid Price for specific property types in the last three years are:
| Property Type | Average Sold Price | Sold Properties |
|---|---|---|
| Flat | £175,191.00 | 55 Flats |
| Semi Detached House | £367,536.00 | 273 Semi Detached Houses |
| Detached House | £458,303.00 | 121 Detached Houses |
| Terraced House | £336,252.00 | 69 Terraced Houses |

