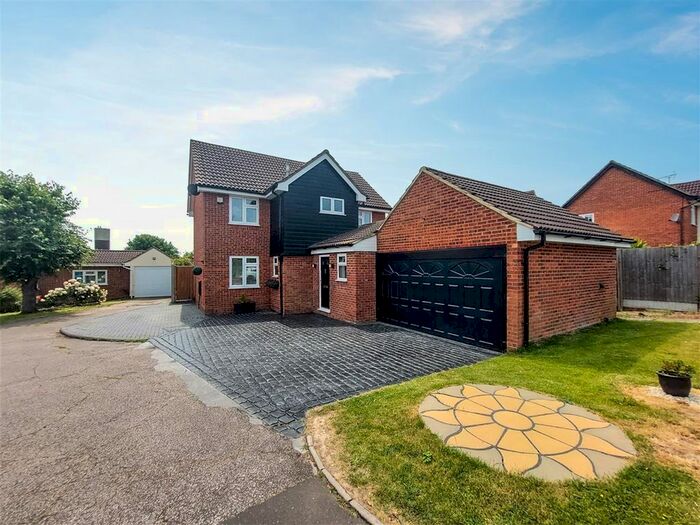
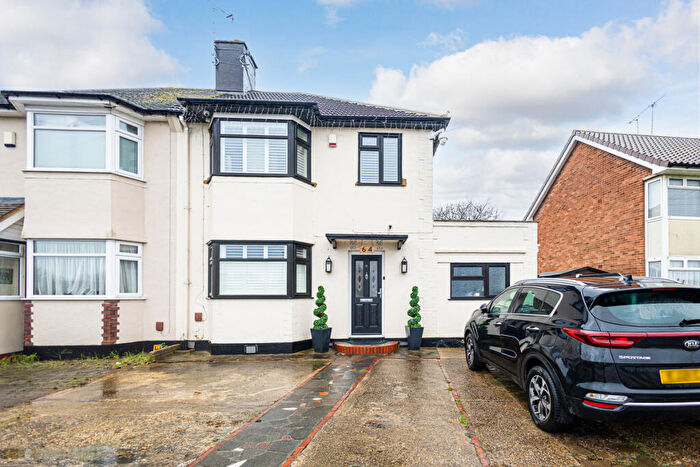
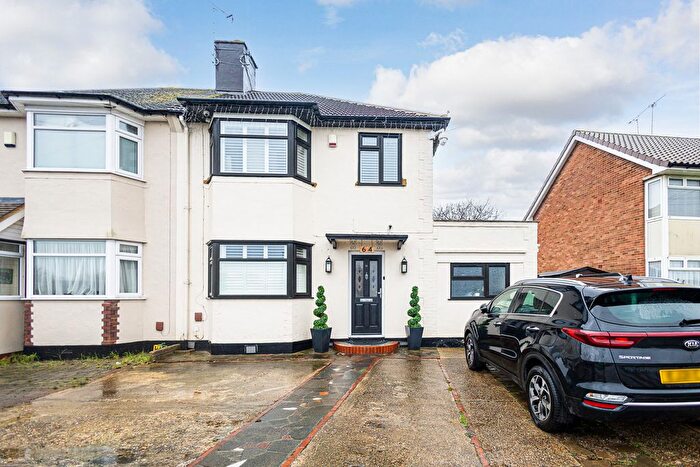
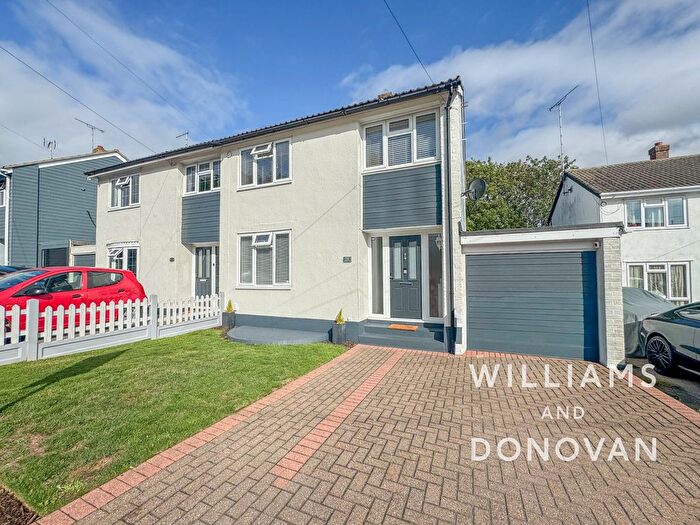
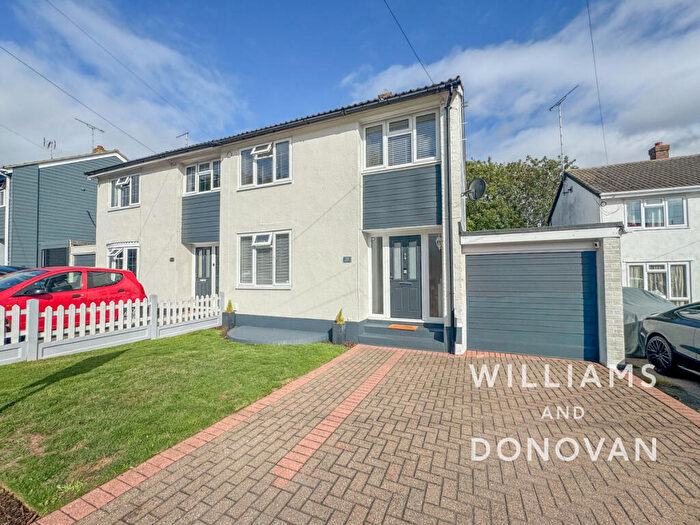
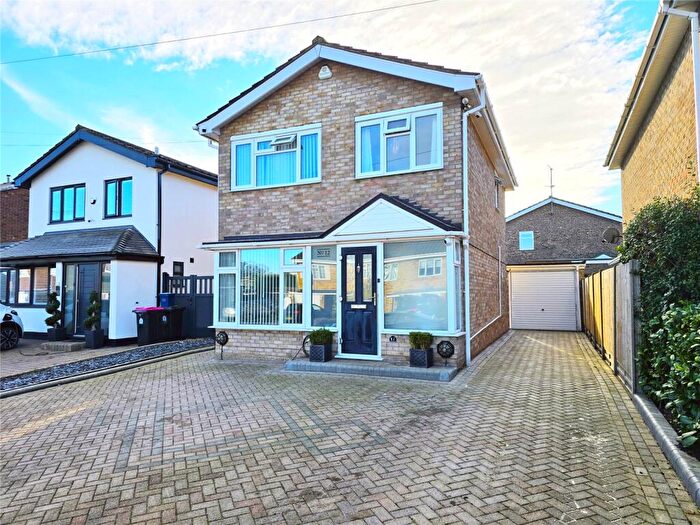
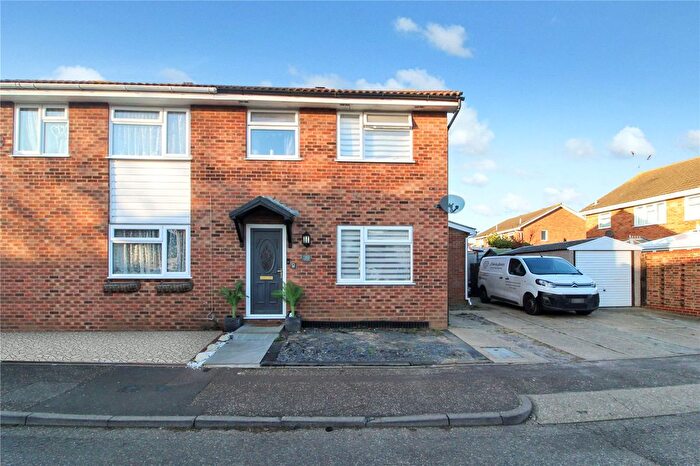
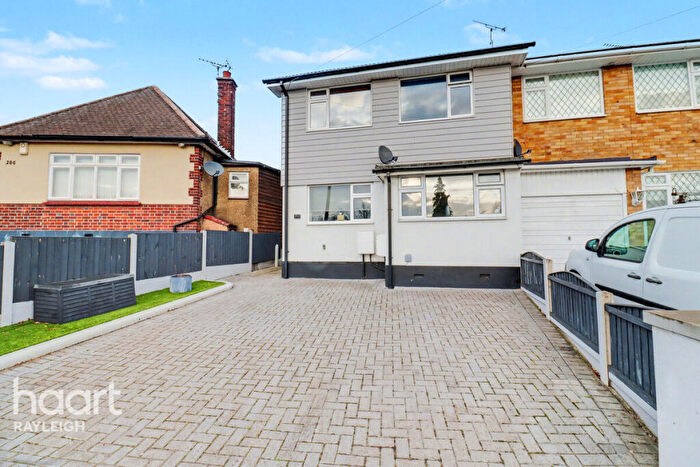
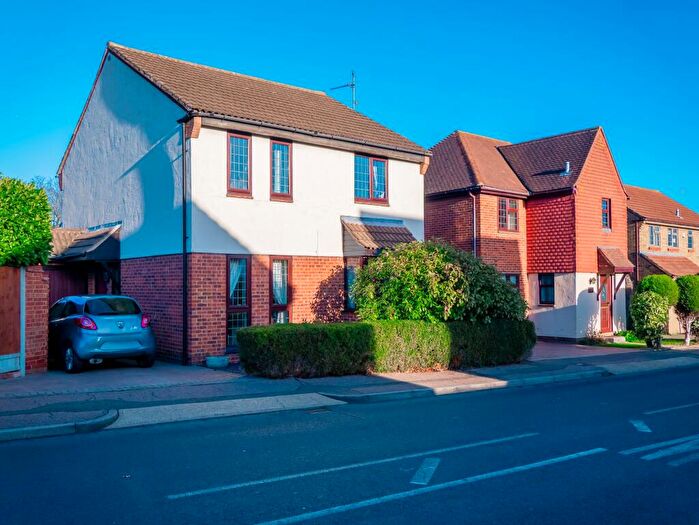
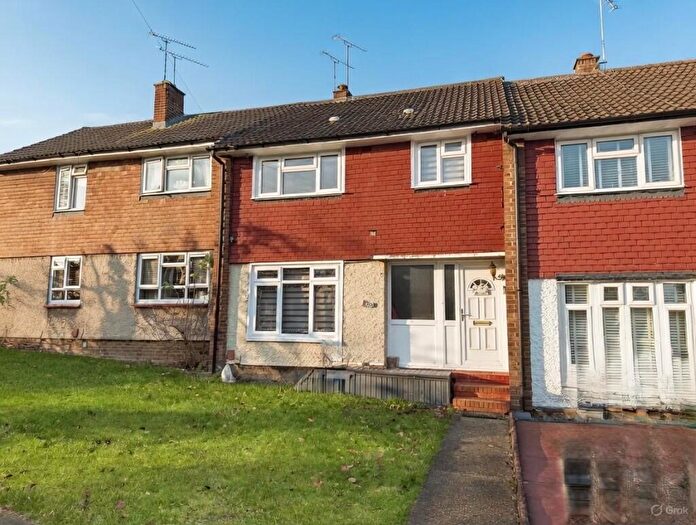
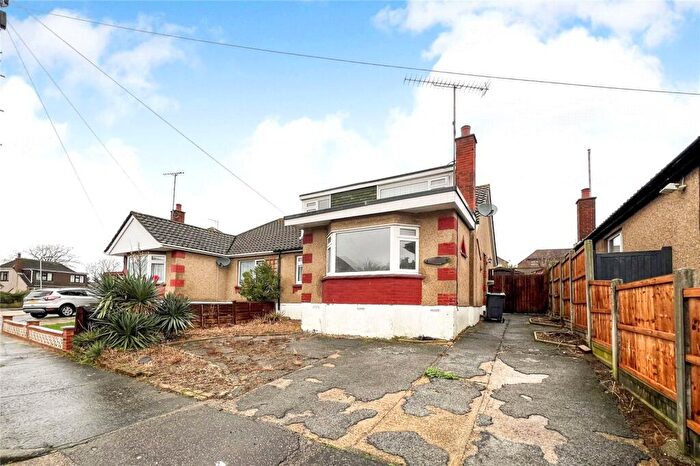
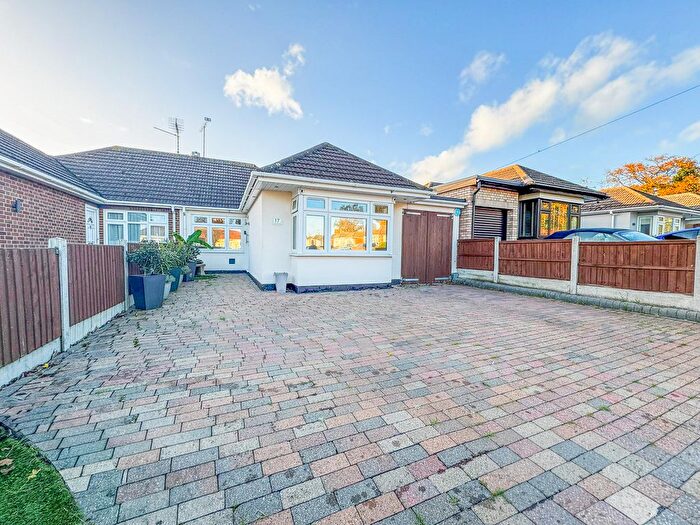
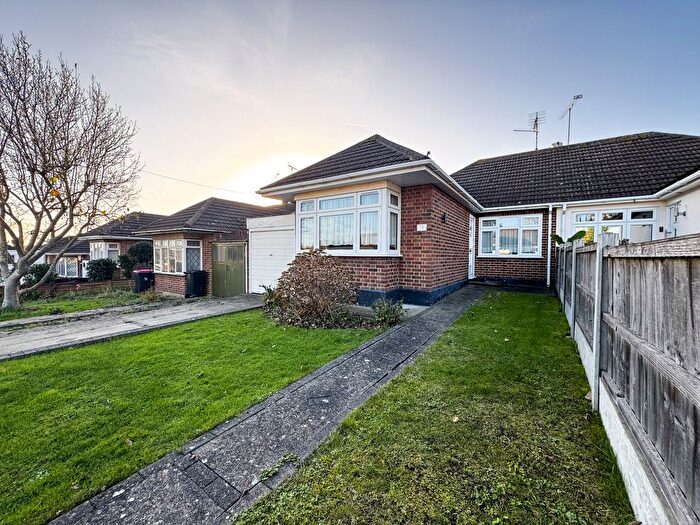
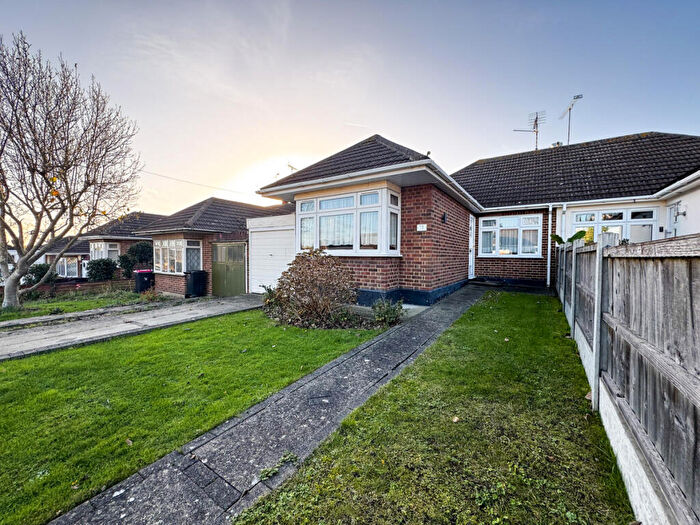
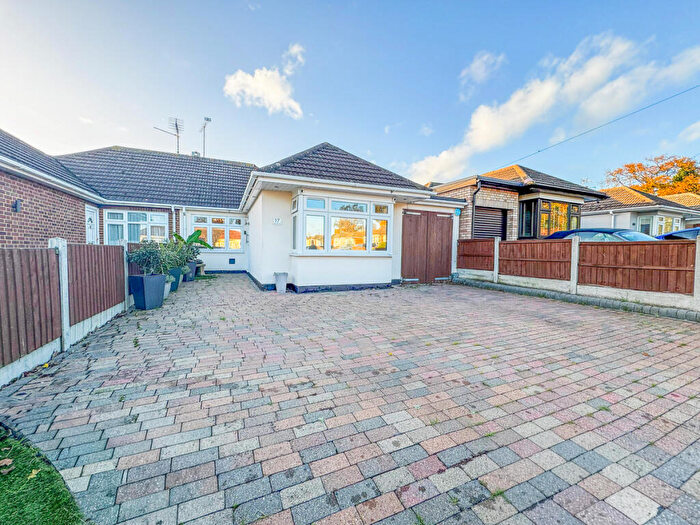
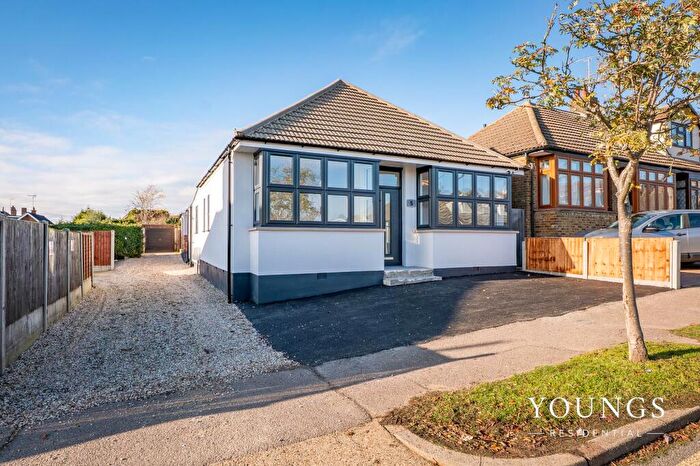
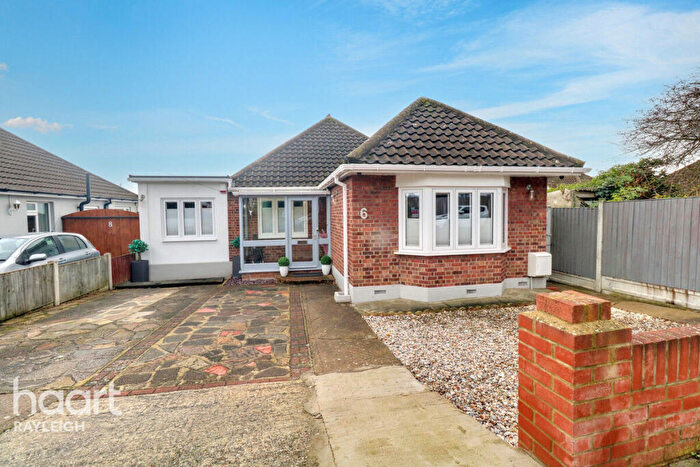
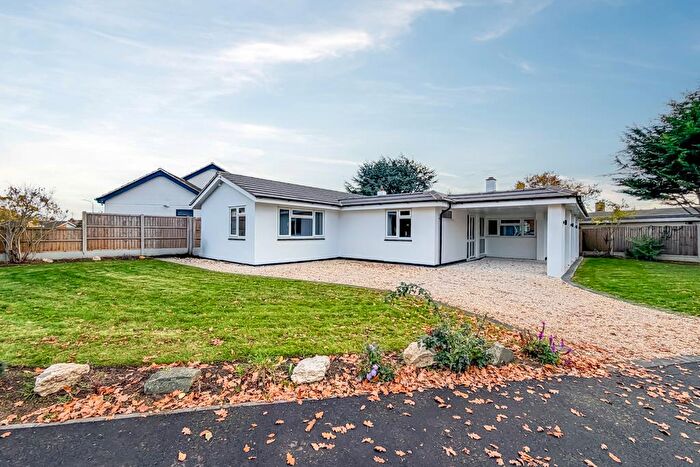
Houses for sale & to rent in St Laurence, Leigh-on-sea
House Prices in St Laurence
Properties in St Laurence have an average house price of £389,365.00 and had 80 Property Transactions within the last 3 years¹.
St Laurence is an area in Leigh-on-sea, Southend-on-Sea with 739 households², where the most expensive property was sold for £672,500.00.
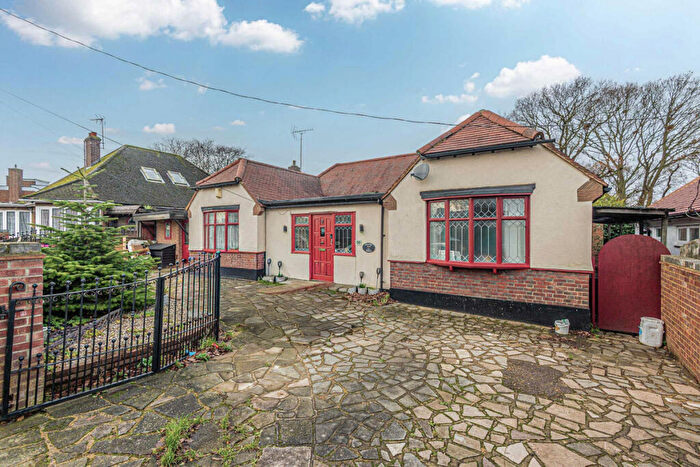
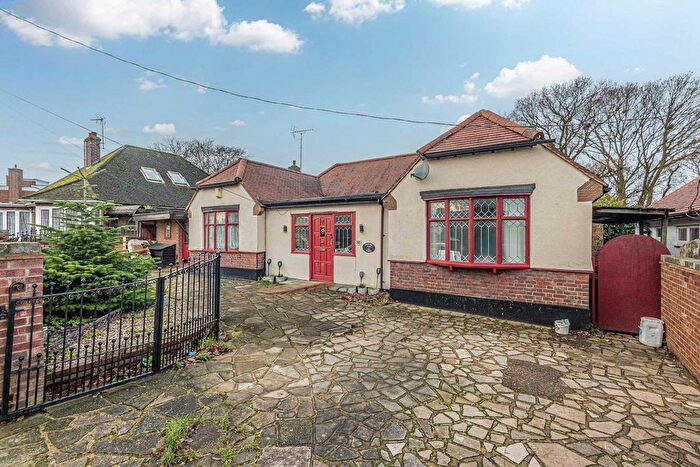
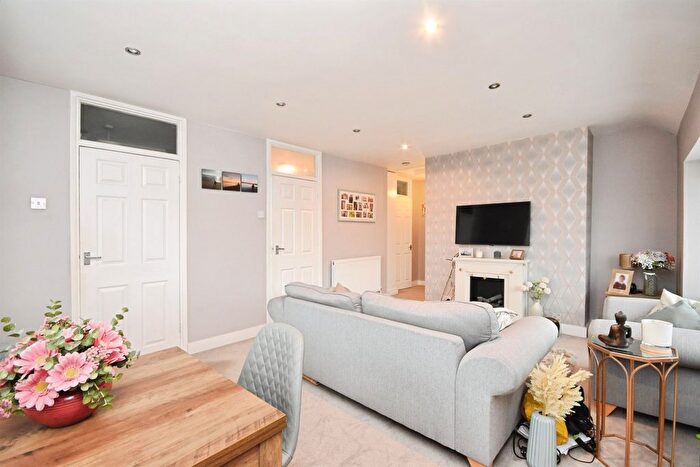
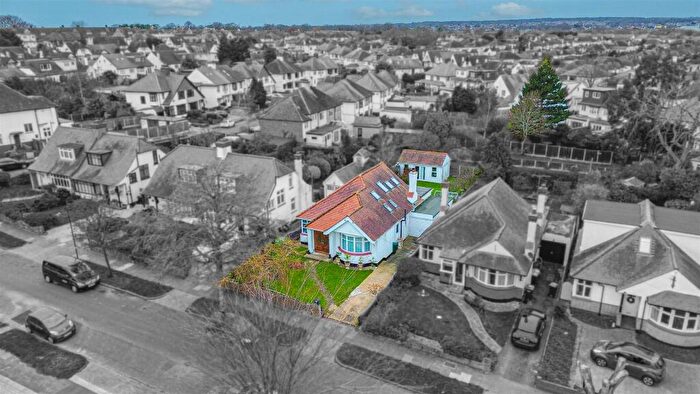
Properties for sale in St Laurence
Roads and Postcodes in St Laurence
Navigate through our locations to find the location of your next house in St Laurence, Leigh-on-sea for sale or to rent.
| Streets | Postcodes |
|---|---|
| Aldrin Way | SS9 5UA |
| Anders Fall | SS9 5UR |
| Apple Row | SS9 5TS |
| Blatches Chase | SS9 5SZ |
| Borman Close | SS9 5UJ |
| Burfield Close | SS9 5TX |
| Burfield Road | SS9 5TU |
| Collins Way | SS9 5UN SS9 5UP SS9 5YU SS9 5YX |
| Four Sisters Close | SS9 5FH |
| Four Sisters Way | SS9 5FQ |
| Fulford Drive | SS9 5SU |
| Lovell Rise | SS9 5UB |
| Mcdivitt Walk | SS9 5UD |
| Meakins Close | SS9 5SX |
| Neil Armstrong Way | SS9 5UE SS9 5UF SS9 5UH SS9 5UL SS9 5UW SS9 5YY SS9 5YT SS9 5YZ |
| Orchard Grove | SS9 5TP SS9 5TR |
| Orchard Side | SS9 5TT |
| Rayleigh Road | SS9 5UX SS9 5XF SS9 5UT |
| Shepard Close | SS9 5YR |
| Stafford Close | SS9 5UG |
| Whitehouse Meadows | SS9 5TY SS9 5TZ |
| Whitehouse Road | SS9 5ST |
| Whiteways | SS9 5SS |
| Young Close | SS9 5UQ |
Transport near St Laurence
-
Southend Airport Station
-
Rochford Station
-
Chalkwell Station
-
Prittlewell Station
-
Leigh-On-Sea Station
-
Westcliff Station
-
Hockley Station
-
Southend Victoria Station
-
Southend Central Station
- FAQ
- Price Paid By Year
- Property Type Price
Frequently asked questions about St Laurence
What is the average price for a property for sale in St Laurence?
The average price for a property for sale in St Laurence is £389,365. This amount is 11% lower than the average price in Leigh-on-sea. There are 1,183 property listings for sale in St Laurence.
What streets have the most expensive properties for sale in St Laurence?
The streets with the most expensive properties for sale in St Laurence are Four Sisters Way at an average of £509,375, Mcdivitt Walk at an average of £476,000 and Shepard Close at an average of £456,750.
What streets have the most affordable properties for sale in St Laurence?
The streets with the most affordable properties for sale in St Laurence are Whitehouse Meadows at an average of £334,555, Burfield Close at an average of £340,000 and Stafford Close at an average of £340,000.
Which train stations are available in or near St Laurence?
Some of the train stations available in or near St Laurence are Southend Airport, Rochford and Chalkwell.
Property Price Paid in St Laurence by Year
The average sold property price by year was:
| Year | Average Sold Price | Price Change |
Sold Properties
|
|---|---|---|---|
| 2025 | £418,681 | 8% |
11 Properties |
| 2024 | £385,071 | 1% |
21 Properties |
| 2023 | £381,622 | -1% |
22 Properties |
| 2022 | £386,980 | 7% |
26 Properties |
| 2021 | £359,671 | 5% |
32 Properties |
| 2020 | £342,409 | 3% |
22 Properties |
| 2019 | £332,500 | -4% |
25 Properties |
| 2018 | £345,852 | 1% |
34 Properties |
| 2017 | £341,782 | 12% |
23 Properties |
| 2016 | £300,060 | 10% |
33 Properties |
| 2015 | £269,748 | 5% |
28 Properties |
| 2014 | £256,918 | 12% |
28 Properties |
| 2013 | £225,946 | 10% |
28 Properties |
| 2012 | £203,420 | 0,2% |
25 Properties |
| 2011 | £203,069 | -3% |
18 Properties |
| 2010 | £209,851 | 9% |
27 Properties |
| 2009 | £189,950 | -4% |
20 Properties |
| 2008 | £197,710 | -20% |
19 Properties |
| 2007 | £236,415 | 9% |
43 Properties |
| 2006 | £215,517 | 4% |
42 Properties |
| 2005 | £205,823 | 6% |
34 Properties |
| 2004 | £193,332 | 7% |
18 Properties |
| 2003 | £180,382 | 22% |
32 Properties |
| 2002 | £140,978 | 3% |
38 Properties |
| 2001 | £137,409 | 21% |
40 Properties |
| 2000 | £108,015 | 11% |
31 Properties |
| 1999 | £96,141 | 10% |
35 Properties |
| 1998 | £86,581 | -16% |
42 Properties |
| 1997 | £100,062 | 37% |
61 Properties |
| 1996 | £63,416 | -4% |
39 Properties |
| 1995 | £65,936 | - |
29 Properties |
Property Price per Property Type in St Laurence
Here you can find historic sold price data in order to help with your property search.
The average Property Paid Price for specific property types in the last three years are:
| Property Type | Average Sold Price | Sold Properties |
|---|---|---|
| Semi Detached House | £349,671.00 | 35 Semi Detached Houses |
| Detached House | £466,520.00 | 24 Detached Houses |
| Terraced House | £367,342.00 | 21 Terraced Houses |

