
Houses for sale & to rent in Kursaal, Southend-on-sea
House Prices in Kursaal
Properties in Kursaal have an average house price of £231,610.00 and had 619 Property Transactions within the last 3 years¹.
Kursaal is an area in Southend-on-sea, Southend-on-Sea with 5,085 households², where the most expensive property was sold for £734,800.00.
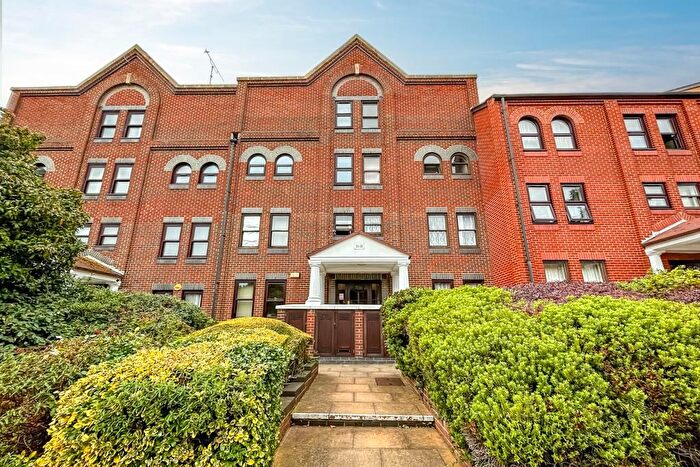
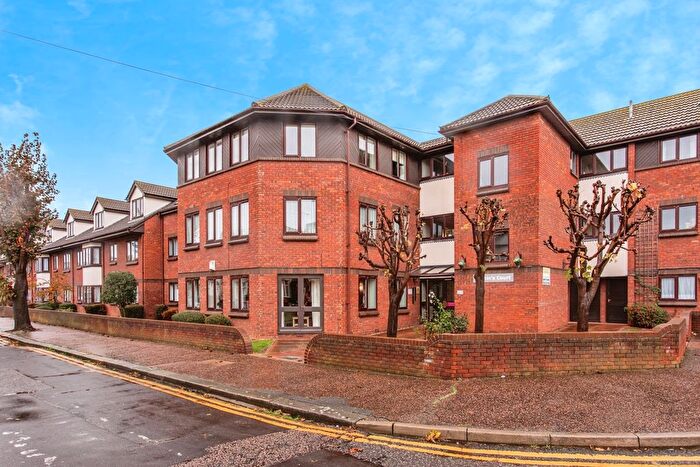
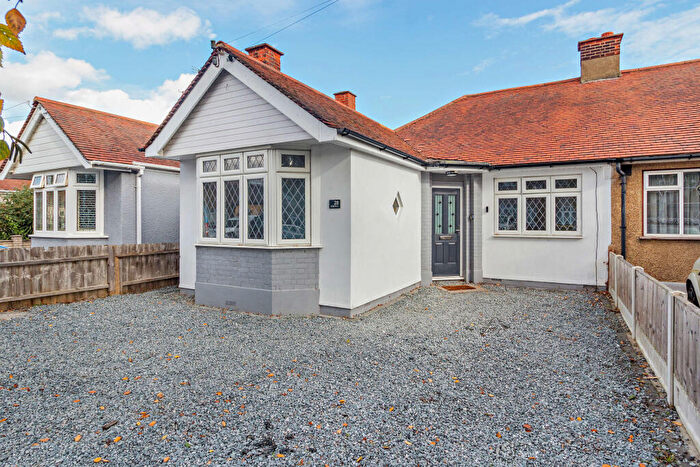
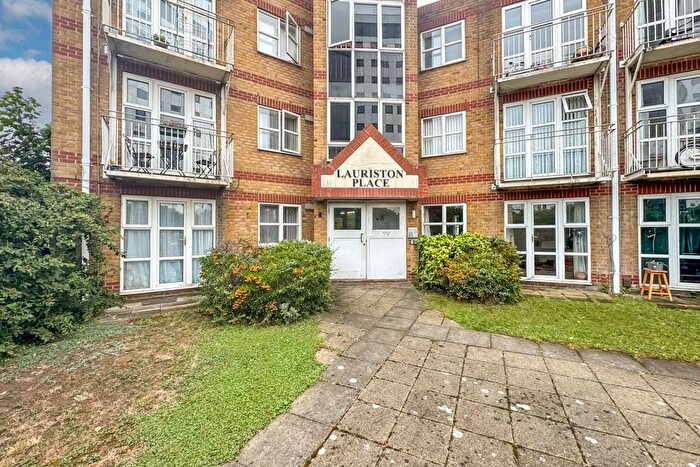
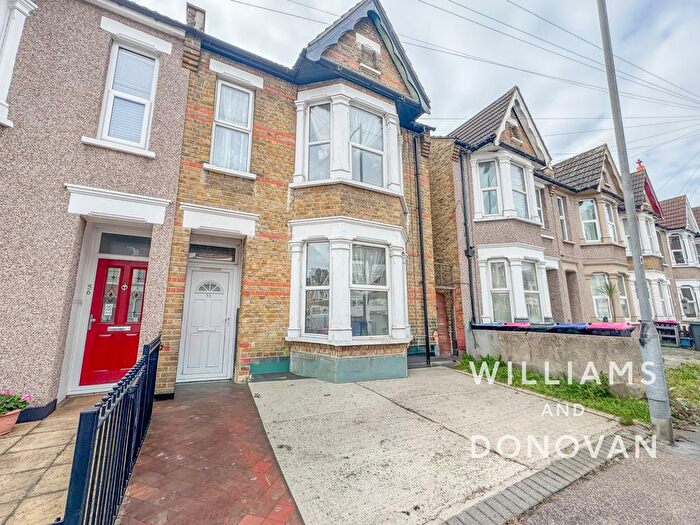
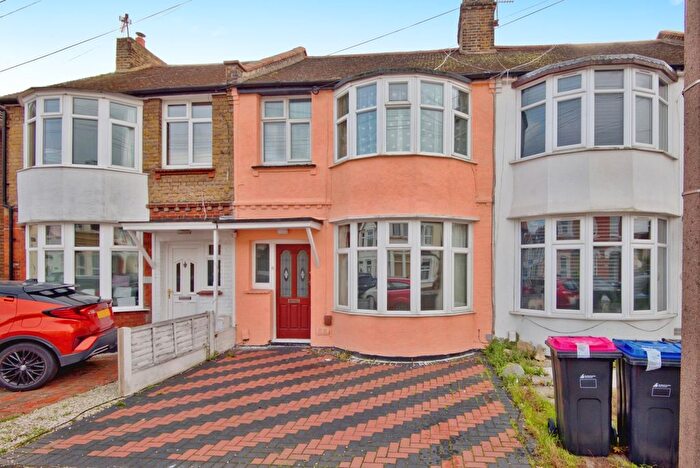
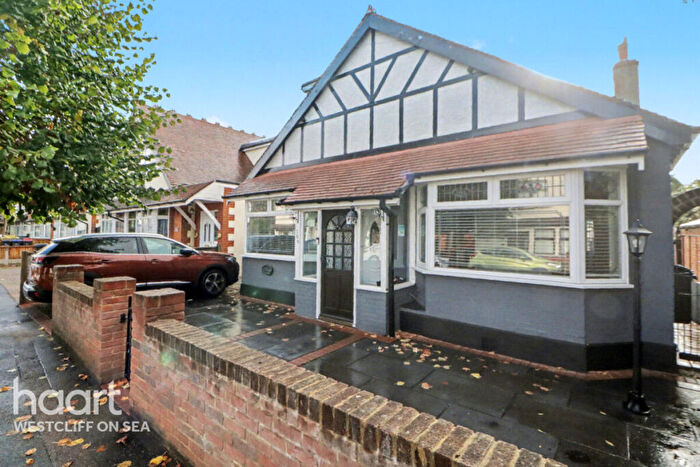
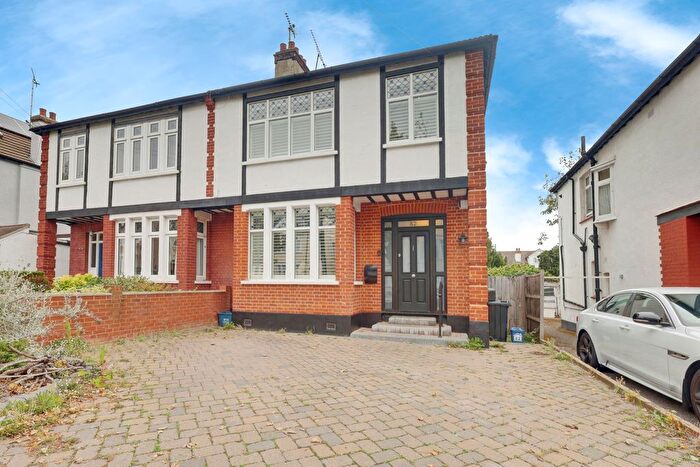
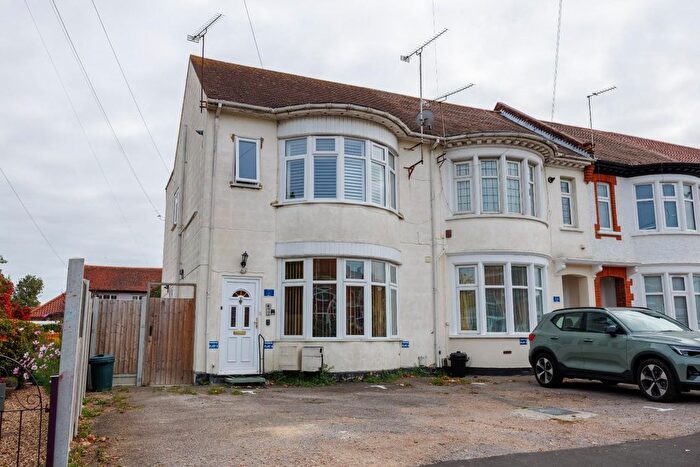
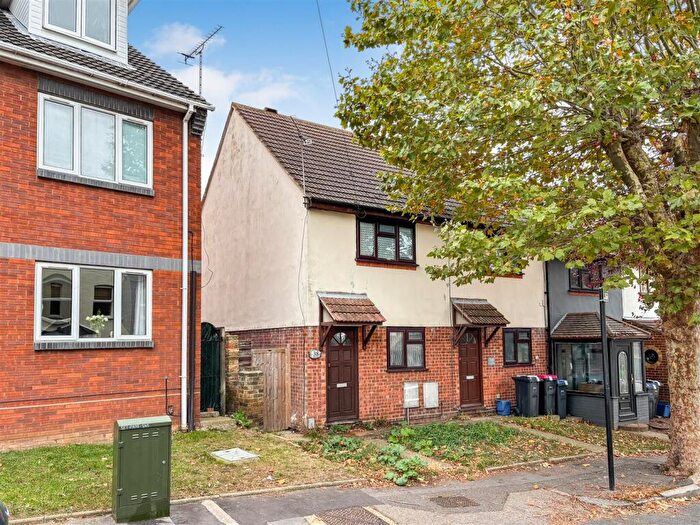
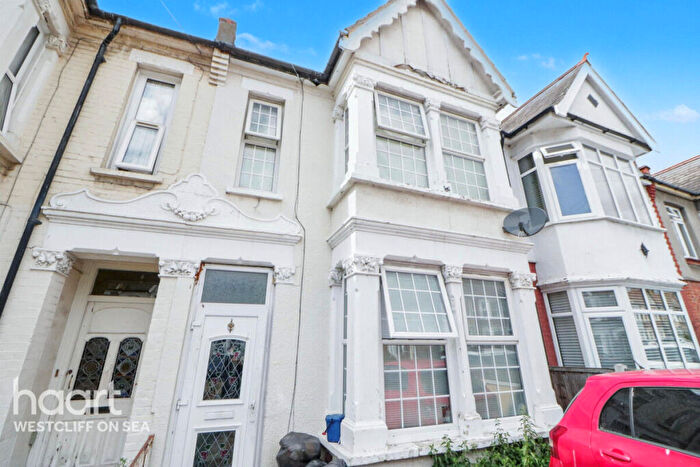
Properties for sale in Kursaal
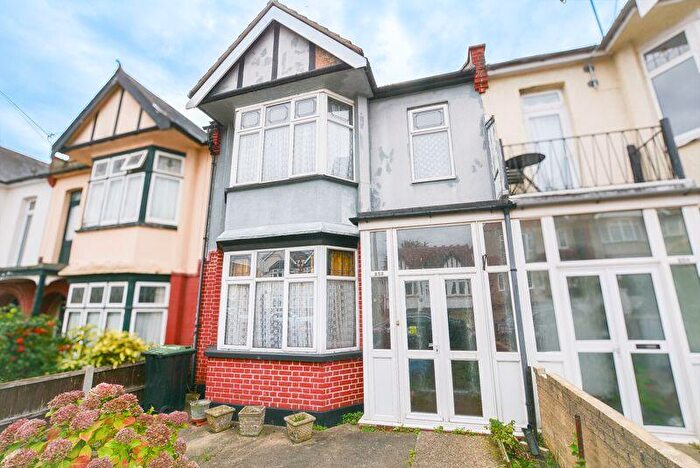


![]()
If you are looking to sell your house, let it out, or receive a property valuation, an expert can help you.
Click the button below to get started.


Roads and Postcodes in Kursaal
Navigate through our locations to find the location of your next house in Kursaal, Southend-on-sea for sale or to rent.
Transport near Kursaal
-
 Southend East Station
 -
Southend Central Station
-
Southend Victoria Station
-
Prittlewell Station
-
Westcliff Station
-
Thorpe Bay Station
-
Chalkwell Station
-
Southend Airport Station
- FAQ
- Price Paid By Year
- Property Type Price
Frequently asked questions about Kursaal
What is the average price for a property for sale in Kursaal?
The average price for a property for sale in Kursaal is £231,610. This amount is 32% lower than the average price in Southend-on-sea. There are 3,122 property listings for sale in Kursaal.
What streets have the most expensive properties for sale in Kursaal?
The streets with the most expensive properties for sale in Kursaal are Southchurch Hall Close at an average of £375,000, Branksome Road at an average of £362,857 and Swanage Road at an average of £350,400.
What streets have the most affordable properties for sale in Kursaal?
The streets with the most affordable properties for sale in Kursaal are Tyrrel Drive at an average of £149,000, Chase Road at an average of £156,727 and Riviera Drive at an average of £161,125.
Which train stations are available in or near Kursaal?
Some of the train stations available in or near Kursaal are Southend East, Southend Central and Southend Victoria.
Property Price Paid in Kursaal by Year
The average sold property price by year was:
| Year | Average Sold Price | Price Change |
Sold Properties
|
|---|---|---|---|
| 2025 | £233,298 | 1% |
75 Properties |
| 2024 | £231,649 | 1% |
152 Properties |
| 2023 | £228,457 | -2% |
153 Properties |
| 2022 | £233,075 | 5% |
239 Properties |
| 2021 | £220,417 | 2% |
253 Properties |
| 2020 | £215,348 | 4% |
148 Properties |
| 2019 | £207,376 | -2% |
210 Properties |
| 2018 | £210,927 | 10% |
192 Properties |
| 2017 | £190,202 | 4% |
212 Properties |
| 2016 | £181,689 | 11% |
368 Properties |
| 2015 | £161,941 | 3% |
248 Properties |
| 2014 | £156,892 | 10% |
212 Properties |
| 2013 | £141,079 | 0,2% |
141 Properties |
| 2012 | £140,816 | -0,4% |
139 Properties |
| 2011 | £141,341 | 6% |
127 Properties |
| 2010 | £132,337 | -8% |
130 Properties |
| 2009 | £143,210 | 3% |
111 Properties |
| 2008 | £139,563 | -5% |
193 Properties |
| 2007 | £146,266 | -5% |
362 Properties |
| 2006 | £153,873 | 11% |
495 Properties |
| 2005 | £137,643 | 10% |
379 Properties |
| 2004 | £123,361 | 19% |
364 Properties |
| 2003 | £100,143 | 24% |
336 Properties |
| 2002 | £76,139 | 17% |
365 Properties |
| 2001 | £63,396 | 11% |
369 Properties |
| 2000 | £56,186 | 14% |
325 Properties |
| 1999 | £48,296 | 12% |
302 Properties |
| 1998 | £42,584 | -2% |
285 Properties |
| 1997 | £43,293 | 22% |
268 Properties |
| 1996 | £33,667 | -3% |
257 Properties |
| 1995 | £34,725 | - |
230 Properties |
Property Price per Property Type in Kursaal
Here you can find historic sold price data in order to help with your property search.
The average Property Paid Price for specific property types in the last three years are:
| Property Type | Average Sold Price | Sold Properties |
|---|---|---|
| Flat | £175,856.00 | 401 Flats |
| Semi Detached House | £368,643.00 | 67 Semi Detached Houses |
| Detached House | £423,000.00 | 10 Detached Houses |
| Terraced House | £311,485.00 | 141 Terraced Houses |