
Houses for sale & to rent in Victoria, Southend-on-sea
House Prices in Victoria
Properties in Victoria have an average house price of £238,541.00 and had 420 Property Transactions within the last 3 years¹.
Victoria is an area in Southend-on-sea, Southend-on-Sea with 3,505 households², where the most expensive property was sold for £1,130,000.00.
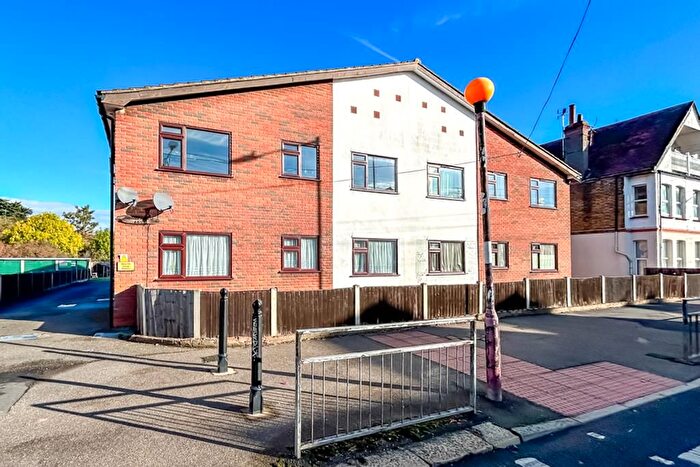
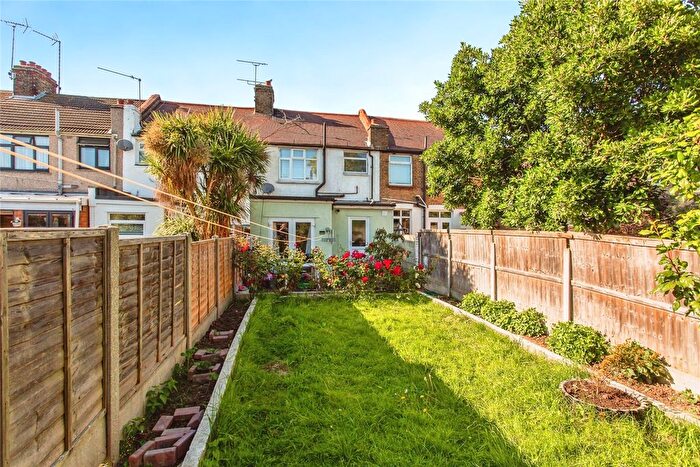
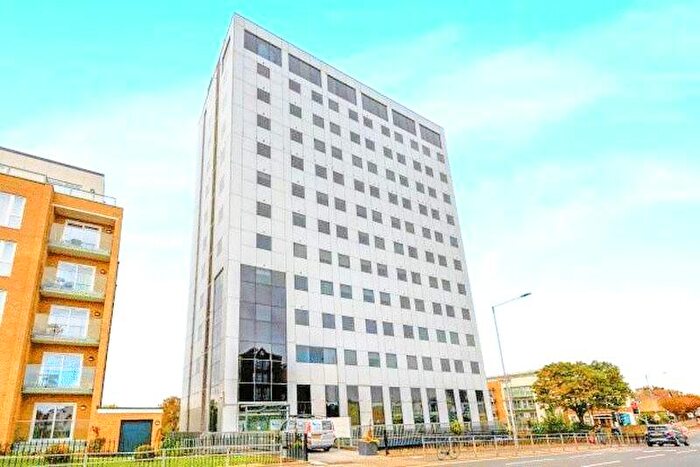
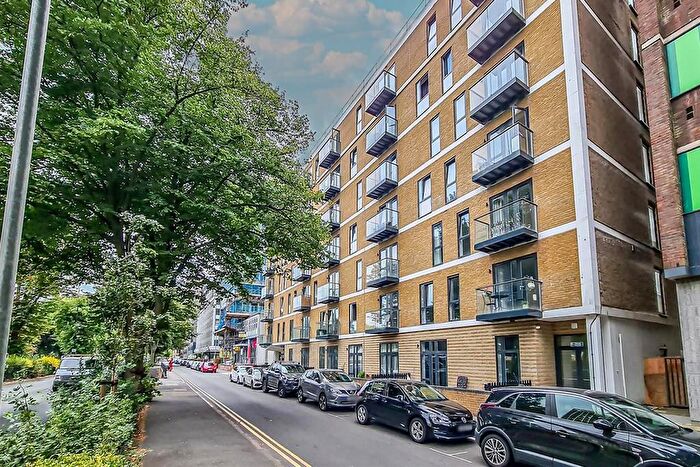
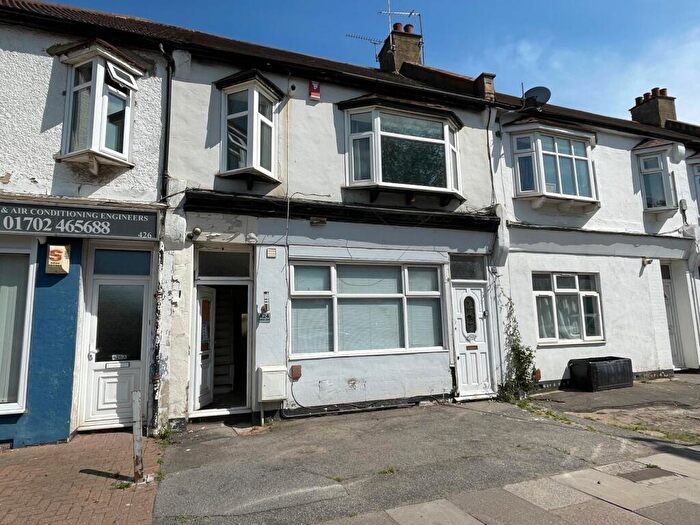
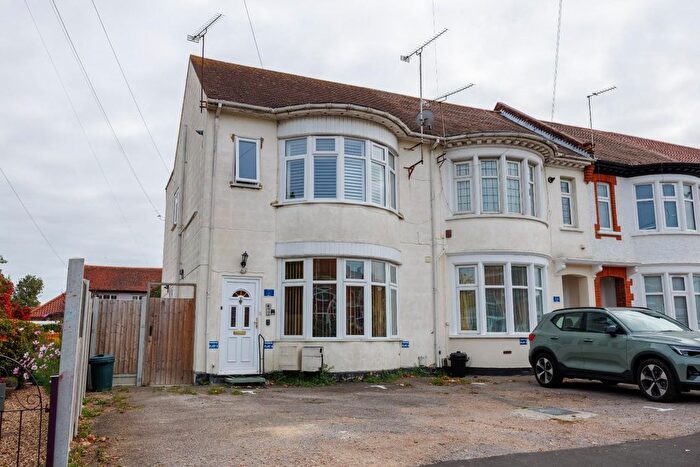
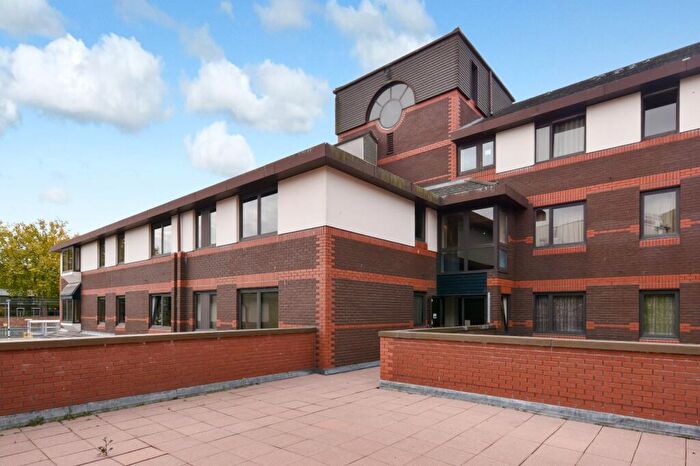
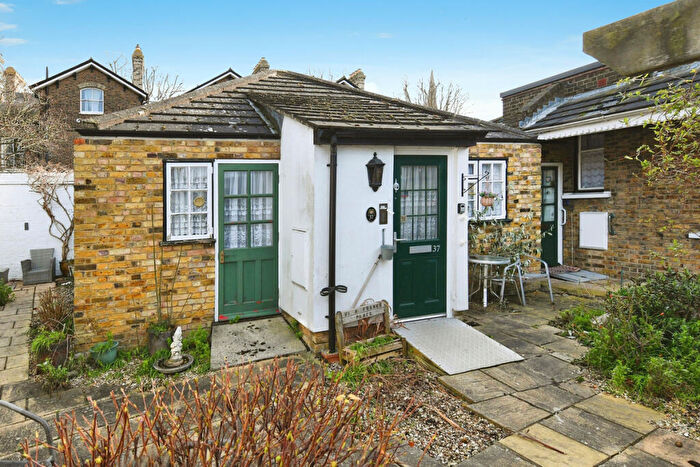
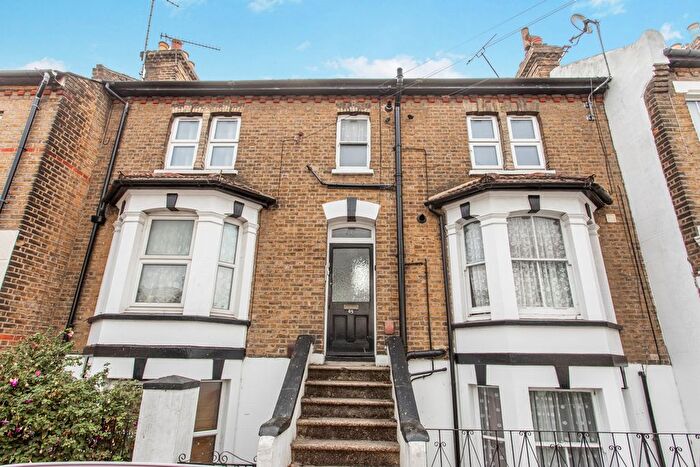
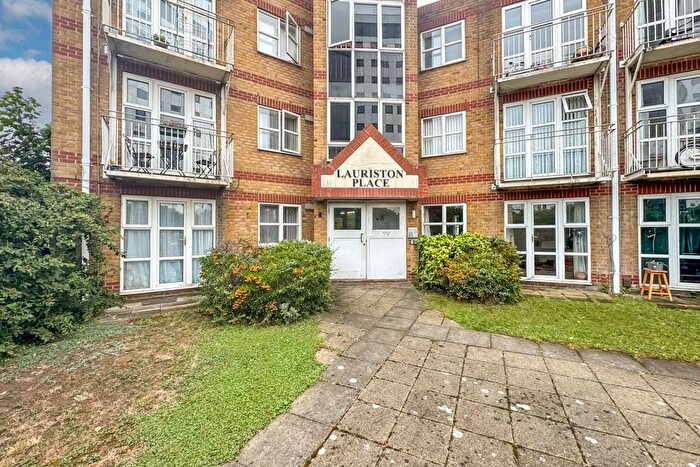
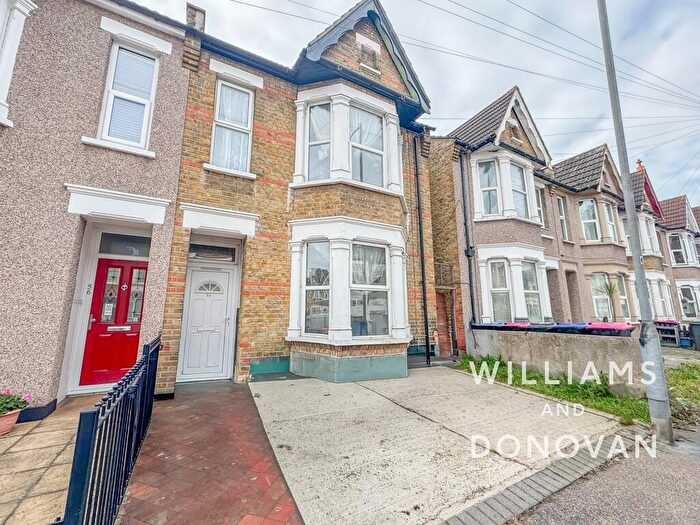
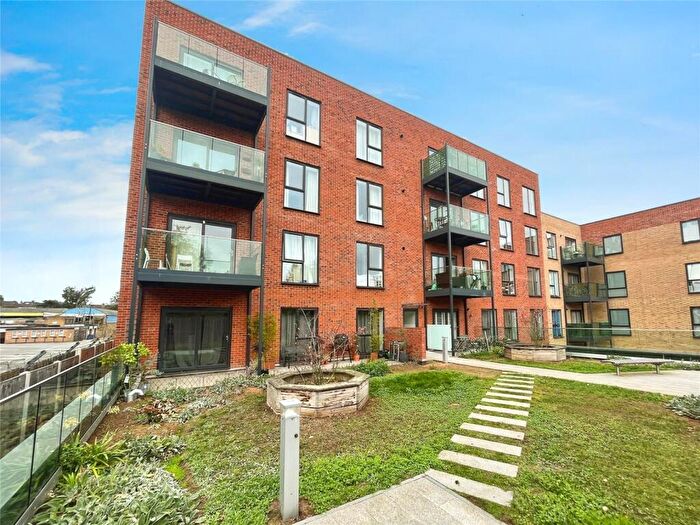
Properties for sale in Victoria
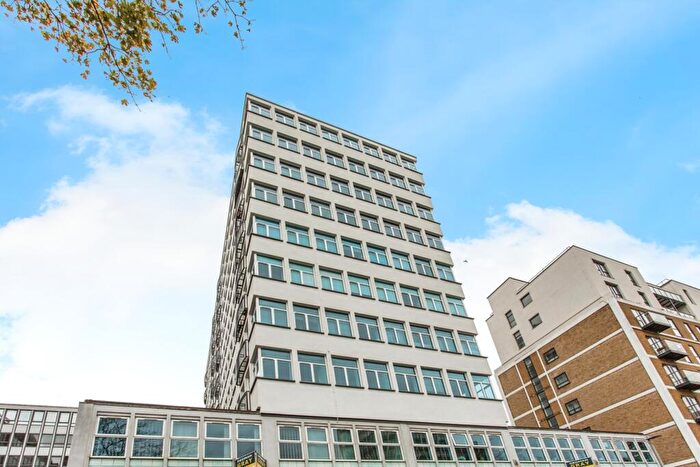
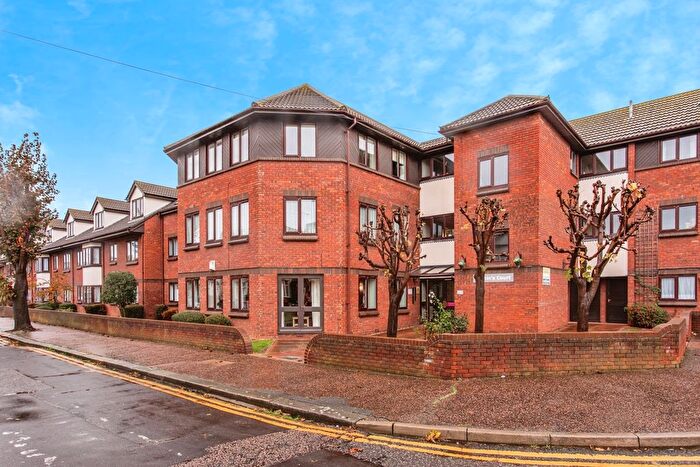

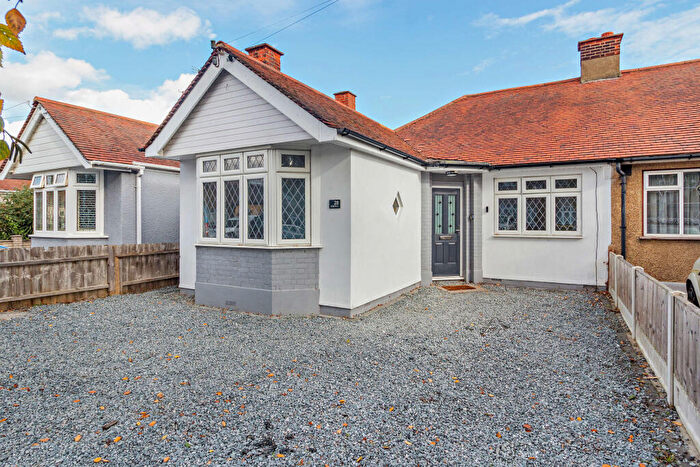


![]()
If you are looking to sell your house, let it out, or receive a property valuation, an expert can help you.
Click the button below to get started.


Roads and Postcodes in Victoria
Navigate through our locations to find the location of your next house in Victoria, Southend-on-sea for sale or to rent.
Transport near Victoria
-
 Southend Victoria Station
 -
Prittlewell Station
-
Southend Central Station
-
Southend East Station
-
Westcliff Station
-
Southend Airport Station
-
Chalkwell Station
-
Thorpe Bay Station
-
Rochford Station
- FAQ
- Price Paid By Year
- Property Type Price
Frequently asked questions about Victoria
What is the average price for a property for sale in Victoria?
The average price for a property for sale in Victoria is £238,541. This amount is 30% lower than the average price in Southend-on-sea. There are 3,419 property listings for sale in Victoria.
What streets have the most expensive properties for sale in Victoria?
The streets with the most expensive properties for sale in Victoria are Glenhurst Road at an average of £380,416, Vale Avenue at an average of £375,000 and Oakhurst Road at an average of £344,285.
What streets have the most affordable properties for sale in Victoria?
The streets with the most affordable properties for sale in Victoria are Short Street at an average of £78,500, Stadium Road at an average of £136,075 and Kenway at an average of £160,449.
Which train stations are available in or near Victoria?
Some of the train stations available in or near Victoria are Southend Victoria, Prittlewell and Southend Central.
Property Price Paid in Victoria by Year
The average sold property price by year was:
| Year | Average Sold Price | Price Change |
Sold Properties
|
|---|---|---|---|
| 2025 | £253,449 | 13% |
59 Properties |
| 2024 | £221,267 | -15% |
110 Properties |
| 2023 | £253,550 | 7% |
102 Properties |
| 2022 | £235,114 | 1% |
149 Properties |
| 2021 | £232,798 | 21% |
164 Properties |
| 2020 | £185,023 | -15% |
209 Properties |
| 2019 | £212,240 | 8% |
164 Properties |
| 2018 | £195,252 | -5% |
362 Properties |
| 2017 | £205,152 | 14% |
191 Properties |
| 2016 | £175,564 | 1% |
177 Properties |
| 2015 | £174,579 | 20% |
139 Properties |
| 2014 | £139,421 | 3% |
112 Properties |
| 2013 | £134,636 | -2% |
88 Properties |
| 2012 | £136,766 | -1% |
60 Properties |
| 2011 | £138,689 | -1% |
76 Properties |
| 2010 | £139,385 | 9% |
83 Properties |
| 2009 | £127,054 | -4% |
105 Properties |
| 2008 | £132,105 | -11% |
136 Properties |
| 2007 | £146,976 | 10% |
271 Properties |
| 2006 | £131,794 | -3% |
168 Properties |
| 2005 | £135,382 | 9% |
148 Properties |
| 2004 | £123,609 | 12% |
192 Properties |
| 2003 | £108,465 | 14% |
209 Properties |
| 2002 | £93,177 | 32% |
234 Properties |
| 2001 | £63,545 | 12% |
173 Properties |
| 2000 | £55,801 | 9% |
178 Properties |
| 1999 | £50,725 | 8% |
156 Properties |
| 1998 | £46,648 | -24% |
149 Properties |
| 1997 | £58,048 | 38% |
145 Properties |
| 1996 | £35,891 | 7% |
149 Properties |
| 1995 | £33,465 | - |
109 Properties |
Property Price per Property Type in Victoria
Here you can find historic sold price data in order to help with your property search.
The average Property Paid Price for specific property types in the last three years are:
| Property Type | Average Sold Price | Sold Properties |
|---|---|---|
| Flat | £175,086.00 | 228 Flats |
| Semi Detached House | £323,592.00 | 64 Semi Detached Houses |
| Detached House | £367,500.00 | 12 Detached Houses |
| Terraced House | £302,996.00 | 116 Terraced Houses |