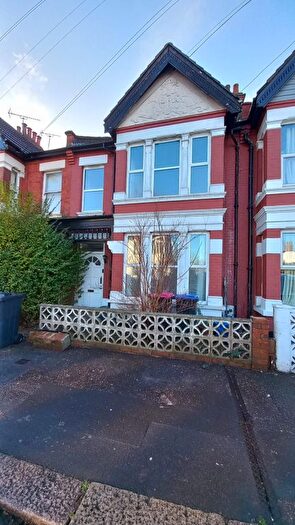
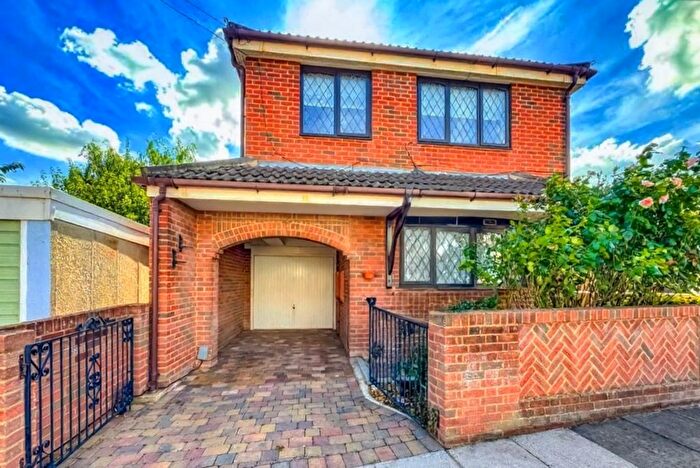
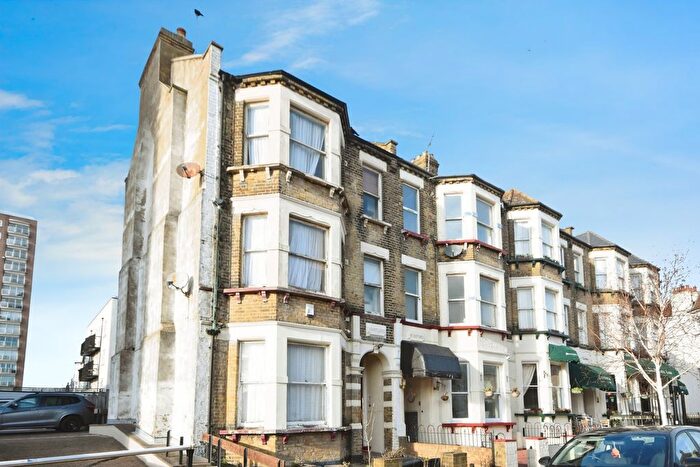
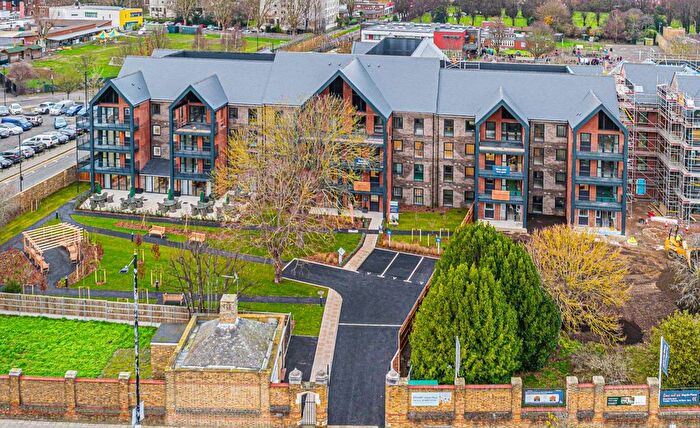
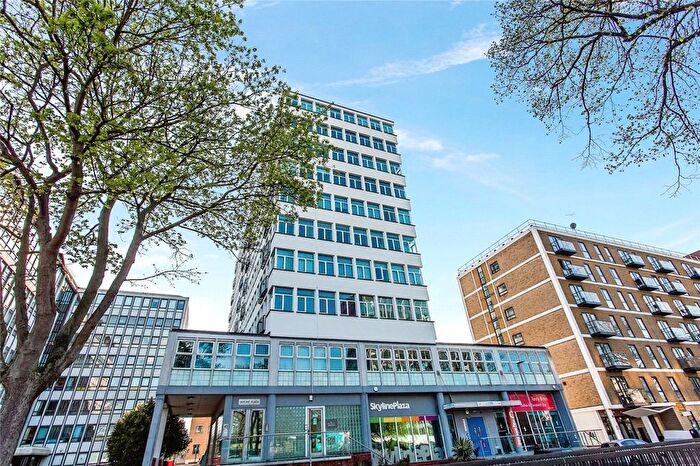
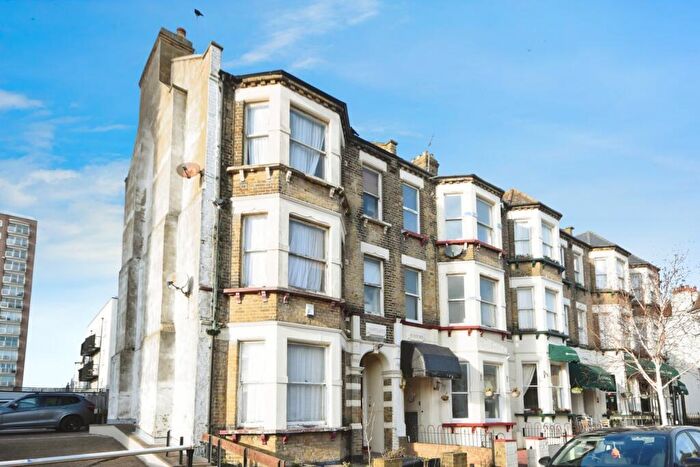
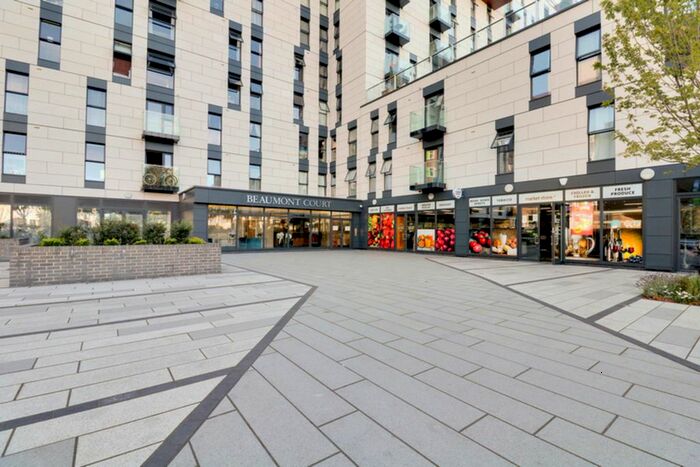
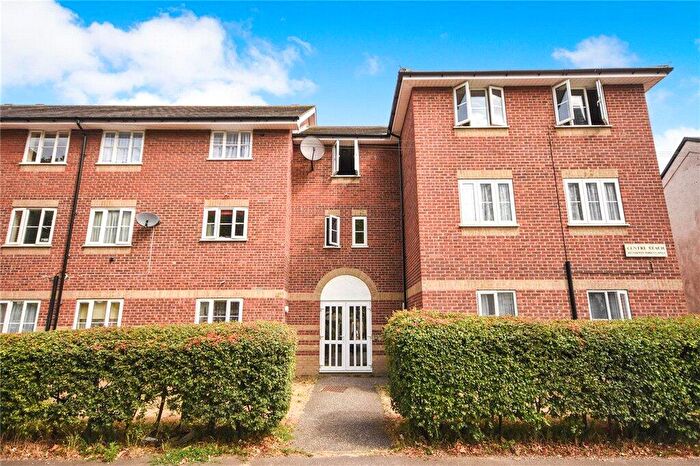
Houses for sale & to rent in Victoria, Westcliff-on-sea
House Prices in Victoria
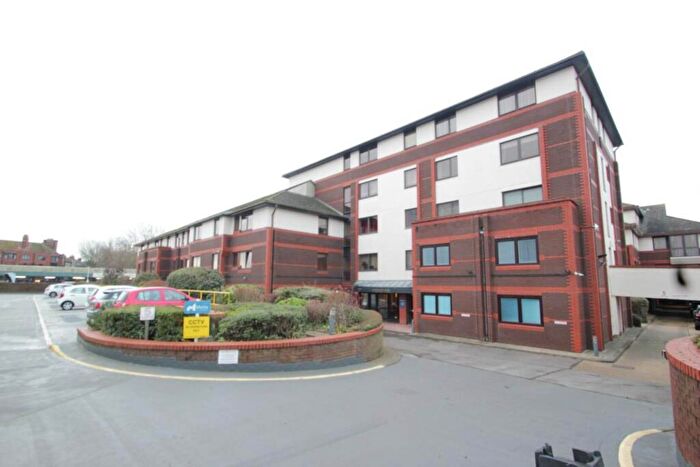
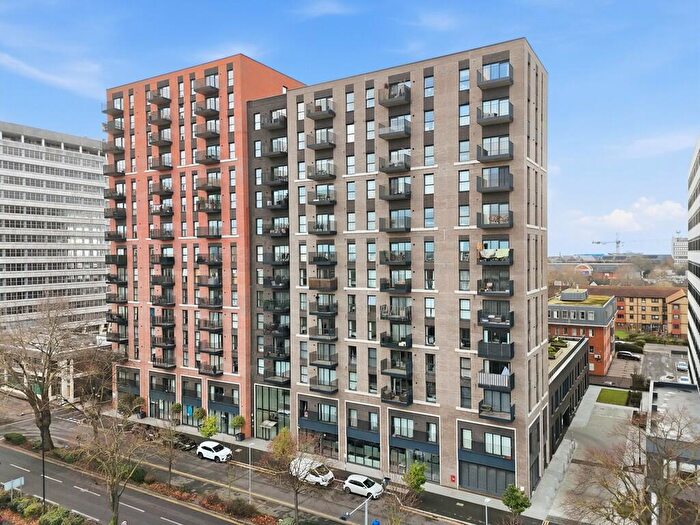
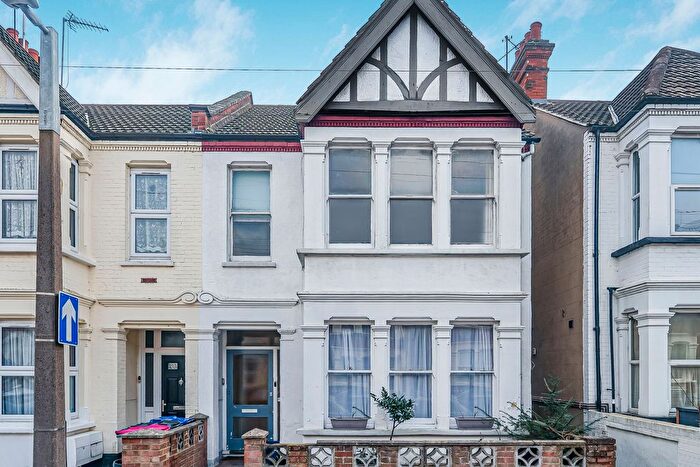
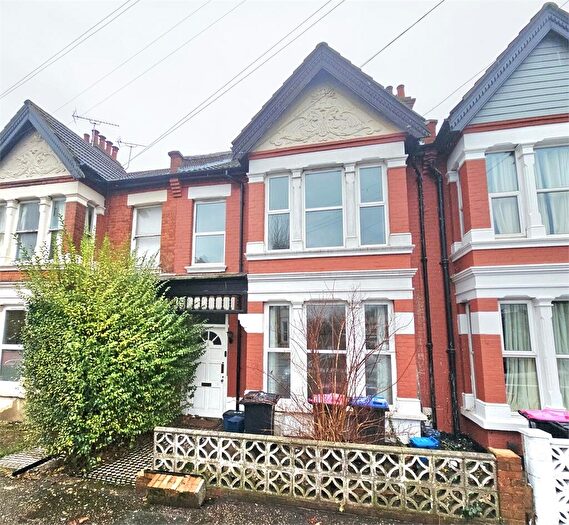
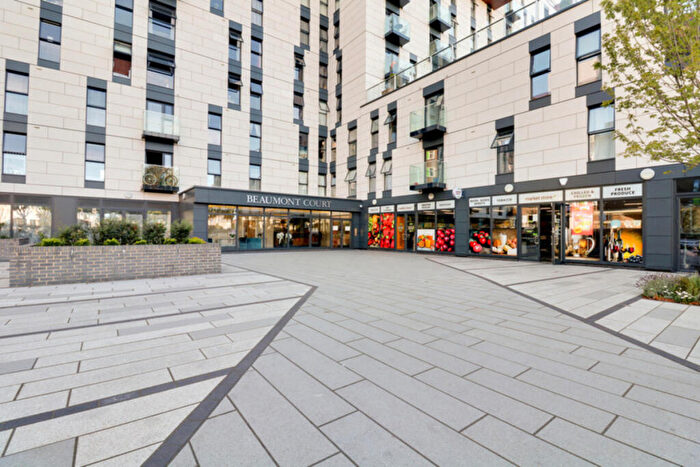
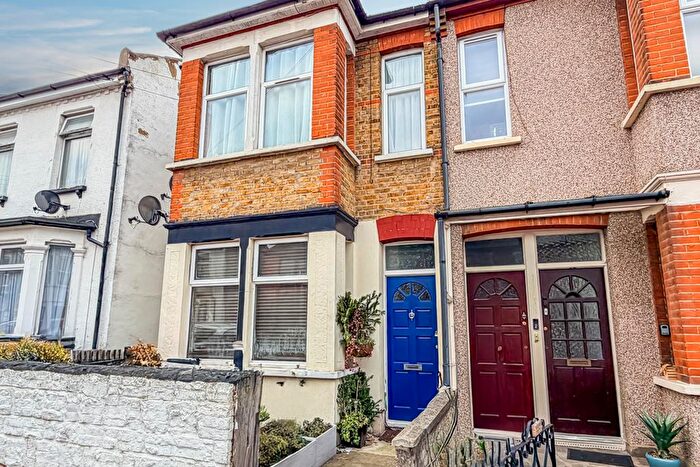
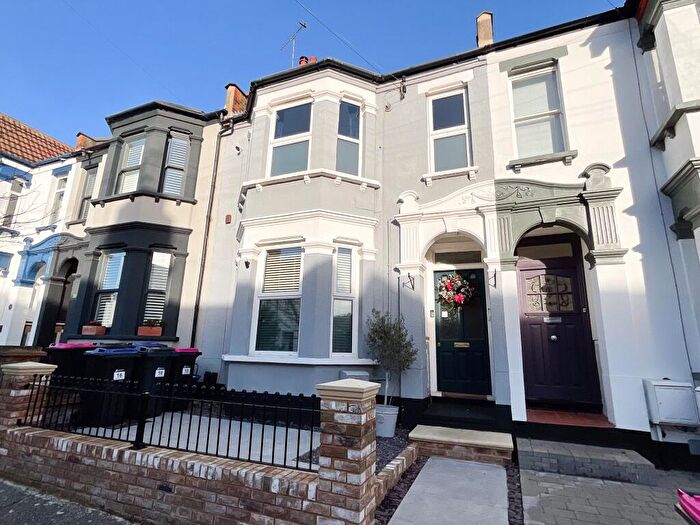
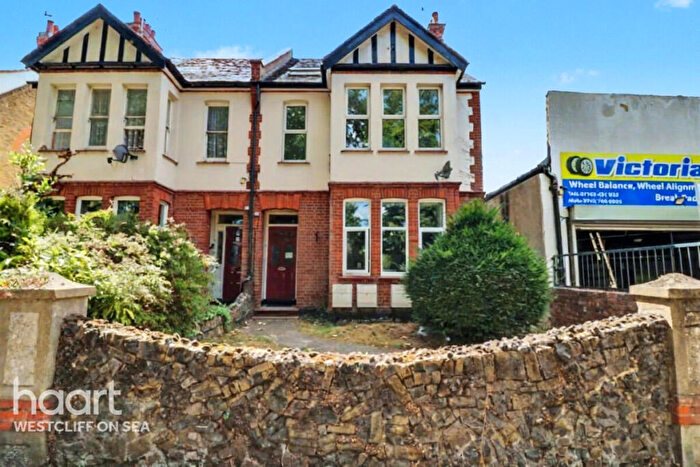
Properties in Victoria have an average house price of £242,561.00 and had 175 Property Transactions within the last 3 years¹.
Victoria is an area in Westcliff-on-sea, Southend-on-Sea with 1,456 households², where the most expensive property was sold for £675,000.00.
Properties for sale in Victoria
Roads and Postcodes in Victoria
Navigate through our locations to find the location of your next house in Victoria, Westcliff-on-sea for sale or to rent.
Transport near Victoria
-
Southend Victoria Station
-
Prittlewell Station
-
Southend Central Station
-
Westcliff Station
-
Southend East Station
-
Chalkwell Station
-
Southend Airport Station
-
Thorpe Bay Station
-
Rochford Station
-
Leigh-On-Sea Station
- FAQ
- Price Paid By Year
- Property Type Price
Frequently asked questions about Victoria
What is the average price for a property for sale in Victoria?
The average price for a property for sale in Victoria is £242,561. This amount is 27% lower than the average price in Westcliff-on-sea. There are 3,471 property listings for sale in Victoria.
What streets have the most expensive properties for sale in Victoria?
The streets with the most expensive properties for sale in Victoria are Osborne Road at an average of £320,000, Albion Road at an average of £314,975 and Elm Cottages at an average of £295,000.
What streets have the most affordable properties for sale in Victoria?
The streets with the most affordable properties for sale in Victoria are Balmoral Road at an average of £118,592, London Road at an average of £199,214 and Cliff Avenue at an average of £209,678.
Which train stations are available in or near Victoria?
Some of the train stations available in or near Victoria are Southend Victoria, Prittlewell and Southend Central.
Property Price Paid in Victoria by Year
The average sold property price by year was:
| Year | Average Sold Price | Price Change |
Sold Properties
|
|---|---|---|---|
| 2025 | £225,846 | -14% |
26 Properties |
| 2024 | £257,864 | 14% |
60 Properties |
| 2023 | £222,903 | -10% |
31 Properties |
| 2022 | £244,731 | -2% |
58 Properties |
| 2021 | £250,832 | 18% |
57 Properties |
| 2020 | £204,849 | -7% |
36 Properties |
| 2019 | £218,733 | 9% |
45 Properties |
| 2018 | £198,832 | -1% |
56 Properties |
| 2017 | £201,704 | 10% |
69 Properties |
| 2016 | £180,961 | 11% |
73 Properties |
| 2015 | £160,928 | 13% |
68 Properties |
| 2014 | £139,747 | 9% |
61 Properties |
| 2013 | £127,808 | -3% |
39 Properties |
| 2012 | £131,467 | 3% |
31 Properties |
| 2011 | £127,853 | -1% |
31 Properties |
| 2010 | £128,870 | 9% |
54 Properties |
| 2009 | £117,777 | -28% |
50 Properties |
| 2008 | £151,147 | 1% |
53 Properties |
| 2007 | £149,678 | 14% |
88 Properties |
| 2006 | £128,580 | 6% |
101 Properties |
| 2005 | £121,399 | 1% |
97 Properties |
| 2004 | £120,529 | 18% |
93 Properties |
| 2003 | £98,797 | 18% |
122 Properties |
| 2002 | £81,462 | 22% |
111 Properties |
| 2001 | £63,735 | 10% |
113 Properties |
| 2000 | £57,401 | 14% |
121 Properties |
| 1999 | £49,501 | -5% |
108 Properties |
| 1998 | £51,784 | 21% |
118 Properties |
| 1997 | £41,080 | 26% |
88 Properties |
| 1996 | £30,274 | 1% |
70 Properties |
| 1995 | £29,887 | - |
60 Properties |
Property Price per Property Type in Victoria
Here you can find historic sold price data in order to help with your property search.
The average Property Paid Price for specific property types in the last three years are:
| Property Type | Average Sold Price | Sold Properties |
|---|---|---|
| Semi Detached House | £322,740.00 | 25 Semi Detached Houses |
| Detached House | £508,500.00 | 2 Detached Houses |
| Terraced House | £299,459.00 | 69 Terraced Houses |
| Flat | £160,761.00 | 79 Flats |

