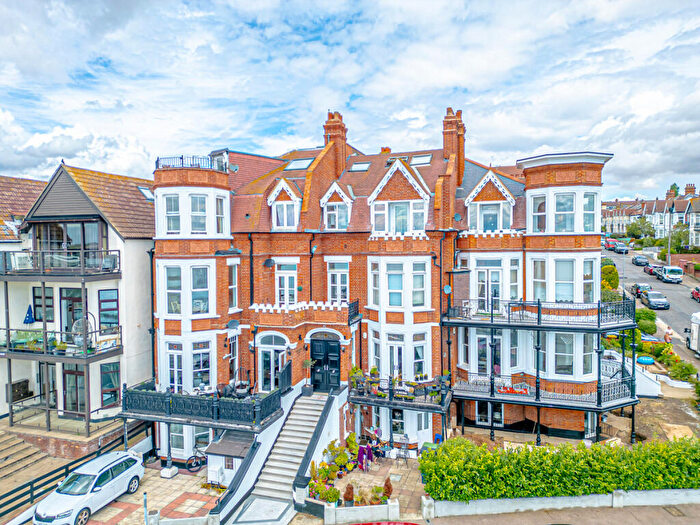
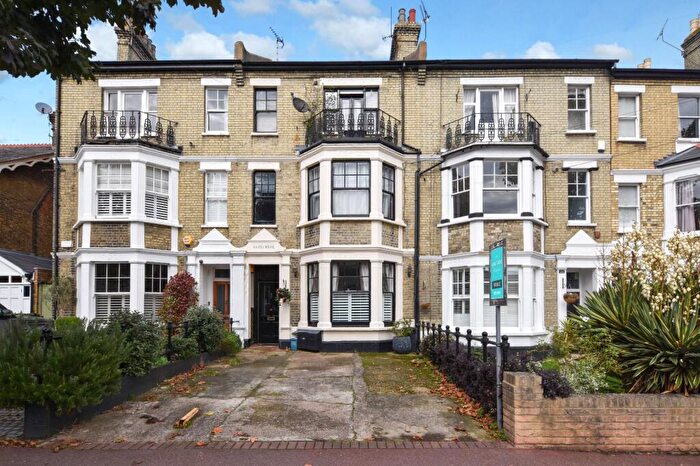
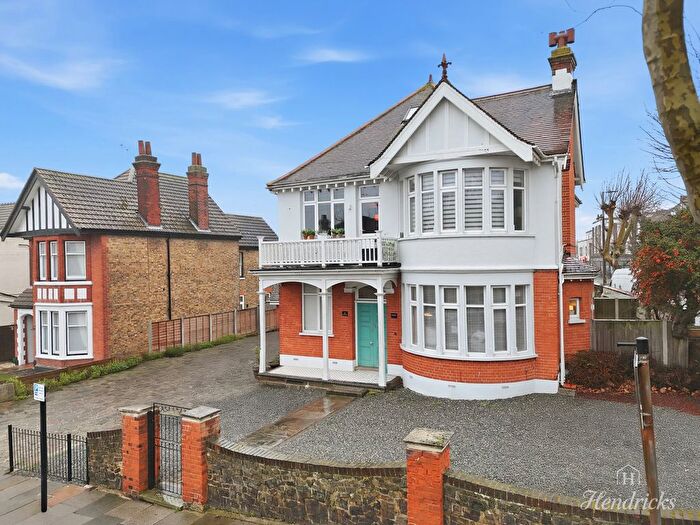
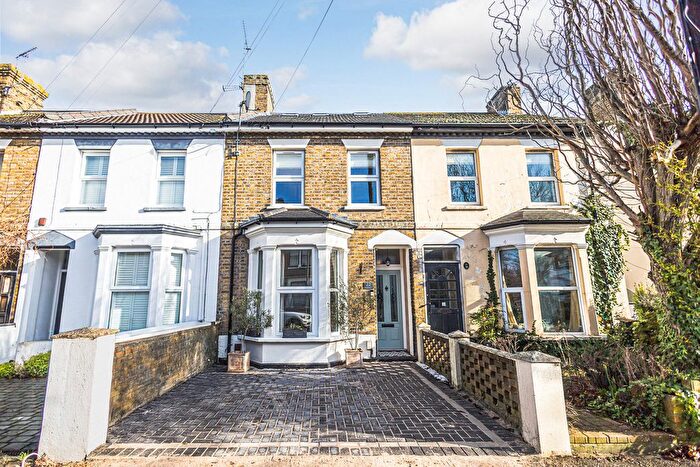
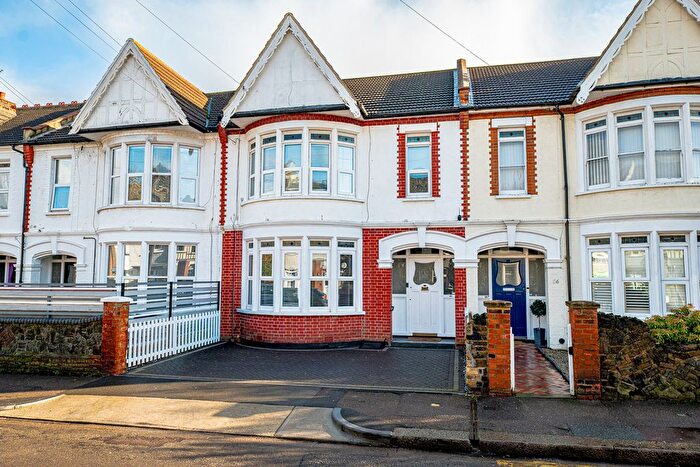
Houses for sale & to rent in Milton, Westcliff-on-sea
House Prices in Milton
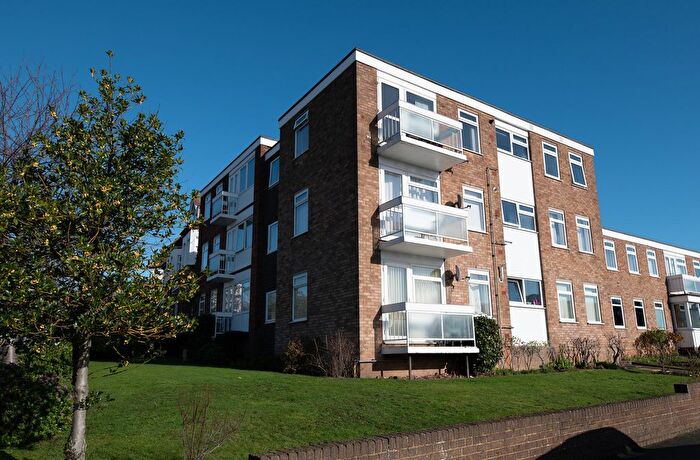
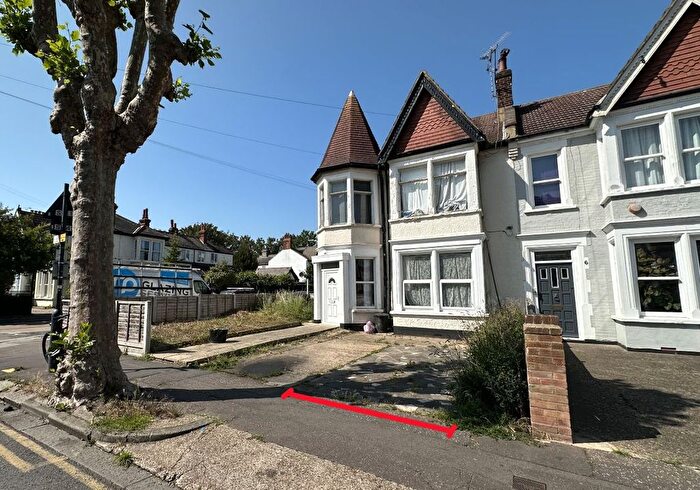
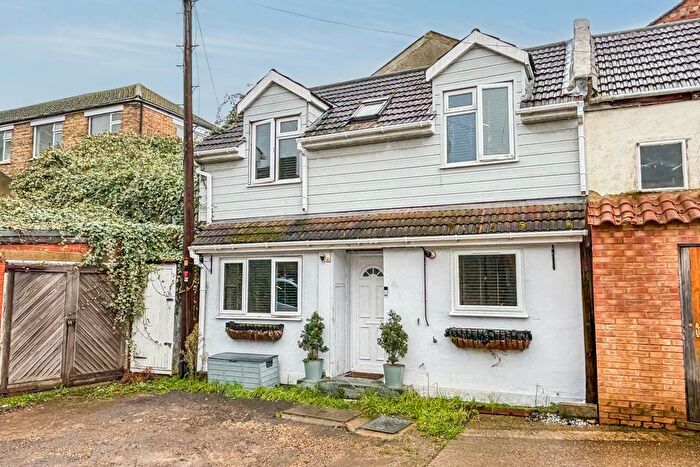
Properties in Milton have an average house price of £276,550.00 and had 348 Property Transactions within the last 3 years¹.
Milton is an area in Westcliff-on-sea, Southend-on-Sea with 3,203 households², where the most expensive property was sold for £1,285,000.00.
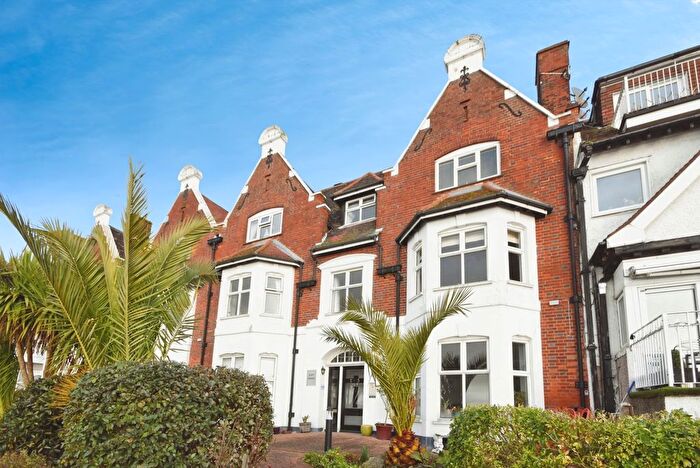
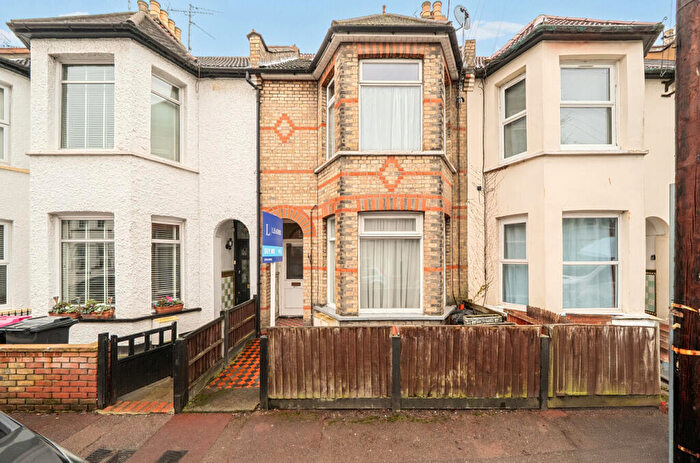
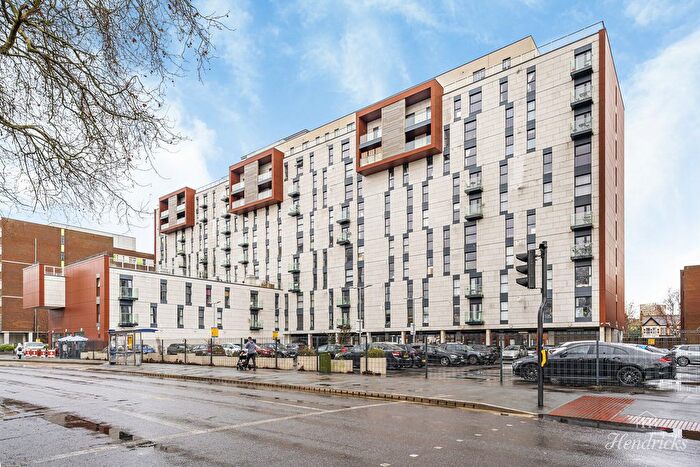
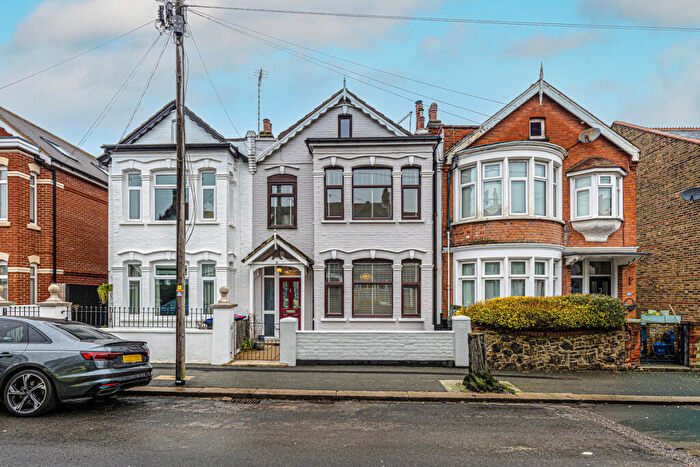
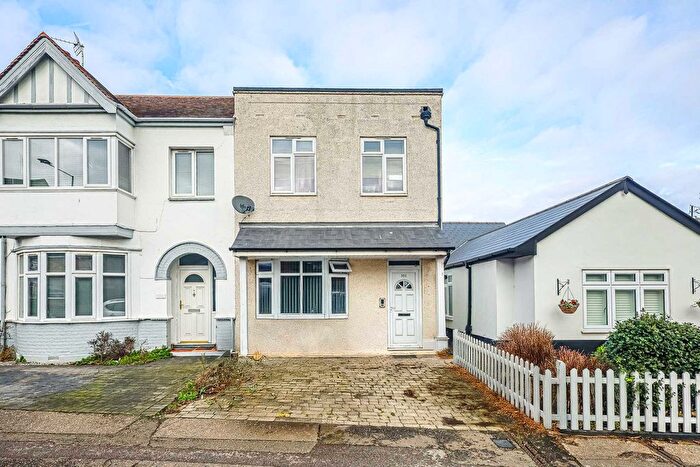
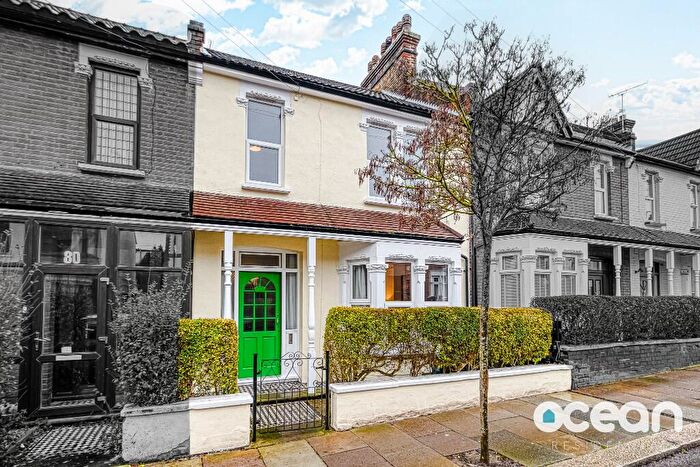
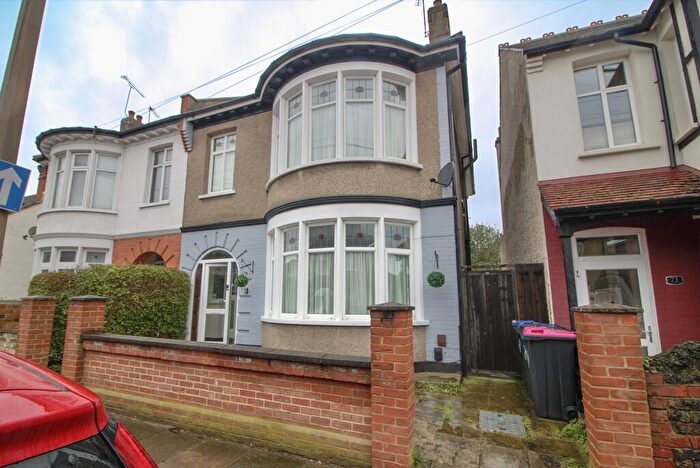
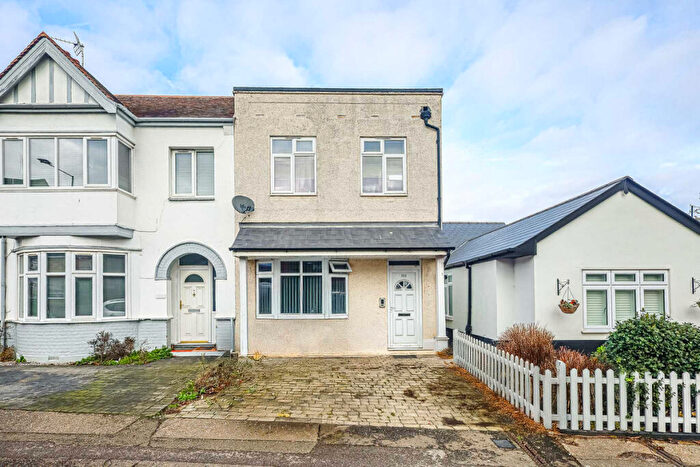
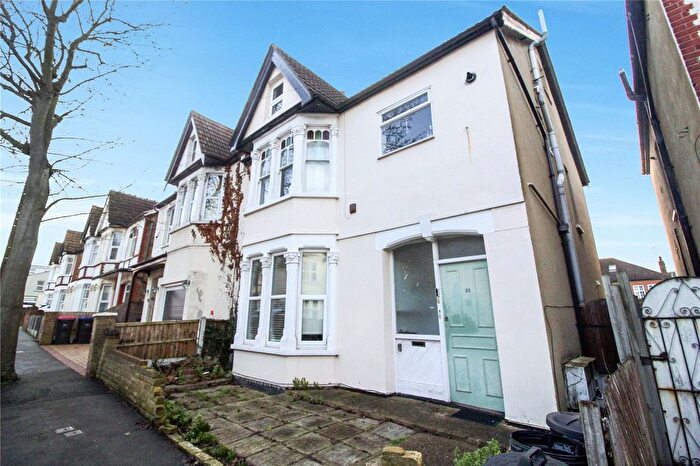
Properties for sale in Milton
Roads and Postcodes in Milton
Navigate through our locations to find the location of your next house in Milton, Westcliff-on-sea for sale or to rent.
| Streets | Postcodes |
|---|---|
| Albert Mews | SS0 7JF |
| Anerley Road | SS0 7HH SS0 7HJ |
| Argyll Road | SS0 7HL SS0 7HN |
| Avenue Road | SS0 7PJ SS0 7PN SS0 7PW |
| Avenue Terrace | SS0 7PL |
| Bakery Mews | SS0 7PB |
| Burdett Avenue | SS0 7JN SS0 7JW |
| Cambridge Road | SS0 7PT |
| Canewdon Road | SS0 7HB SS0 7HD SS0 7HE SS0 7NE SS0 7NF SS0 7ER |
| Ceylon Road | SS0 7HP SS0 7HS |
| Clifton Drive | SS0 7SW |
| Cossington Road | SS0 7NG SS0 7NJ |
| Crowstone Court | SS0 7SQ |
| Ditton Court Road | SS0 7HF SS0 7HG |
| Hadleigh Road | SS0 7NP |
| Hamlet Court Road | SS0 7EL SS0 7ES SS0 7EU SS0 7EW SS0 7EX SS0 7EY SS0 7LJ SS0 7LN SS0 7LP SS0 7LX SS0 7FZ SS0 7LW |
| Hermitage Road | SS0 7NQ |
| Holland Road | SS0 7SG SS0 7TD SS0 7TE SS0 7TF |
| Imperial Court | SS0 7QL |
| Leonard Road | SS0 7NL |
| London Road | SS0 7HZ SS0 7JG SS0 7JJ |
| Lydford Road | SS0 7QX |
| Manor Road | SS0 7SE SS0 7SR SS0 7SS SS0 7TS |
| Marine Avenue | SS0 7PS |
| Milton Avenue | SS0 7RF |
| Milton Gate Mews | SS0 7FN |
| Milton Road | SS0 7JP SS0 7JT SS0 7JX SS0 7JE SS0 7JS SS0 7JU |
| Palmeira Avenue | SS0 7RP SS0 7RW |
| Palmeira Parade | SS0 7RR |
| Palmerston Road | SS0 7TB |
| Park Crescent | SS0 7PG |
| Park Lane | SS0 7PF |
| Park Road | SS0 7PE SS0 7PQ |
| Park Street | SS0 7PA SS0 7PD |
| Park Terrace | SS0 7PH |
| Parkgate | SS0 7NY |
| Preston Road | SS0 7NB SS0 7ND |
| Retreat Road | SS0 7NN |
| San Remo Parade | SS0 7RD SS0 7RE |
| Seaforth Road | SS0 7SH SS0 7SJ SS0 7SN SS0 7SL |
| Shorefield Gardens | SS0 7RL |
| Shorefield Road | SS0 7RH |
| St Helens Road | SS0 7LA SS0 7LB SS0 7LE SS0 7LF |
| St Johns Court | SS0 7QG |
| St Johns Road | SS0 7JY SS0 7JZ |
| St Vincents Mews | SS0 7PX |
| St Vincents Road | SS0 7PP SS0 7PR |
| Station Road | SS0 7FF SS0 7RA SS0 7RG SS0 7RQ SS0 7RU SS0 7SA SS0 7SB |
| The Leas | SS0 7SU SS0 7SZ |
| Tower Court | SS0 7QH SS0 7QQ |
| Tower Court Mews | SS0 7RS |
| Trinity Avenue | SS0 7PU |
| Valkyrie Road | SS0 8AP SS0 8BU SS0 8BT |
| Victoria Court | SS0 7QJ |
| Westcliff Avenue | SS0 7QR SS0 7QT SS0 7QS |
| Westcliff Parade | SS0 7QD SS0 7QE SS0 7QF SS0 7QN SS0 7QP SS0 7QZ SS0 7QW |
| Western Esplanade | SS0 7QB SS0 7QY |
| Wickford Road | SS0 7NW |
| Winton Avenue | SS0 7QU |
| SS0 7RN |
Transport near Milton
-
Westcliff Station
-
Southend Central Station
-
Southend Victoria Station
-
Prittlewell Station
-
Chalkwell Station
-
Southend East Station
-
Southend Airport Station
-
Leigh-On-Sea Station
-
Thorpe Bay Station
- FAQ
- Price Paid By Year
- Property Type Price
Frequently asked questions about Milton
What is the average price for a property for sale in Milton?
The average price for a property for sale in Milton is £276,550. This amount is 15% lower than the average price in Westcliff-on-sea. There are 3,856 property listings for sale in Milton.
What streets have the most expensive properties for sale in Milton?
The streets with the most expensive properties for sale in Milton are Park Crescent at an average of £675,000, Crowstone Court at an average of £608,333 and Hermitage Road at an average of £538,666.
What streets have the most affordable properties for sale in Milton?
The streets with the most affordable properties for sale in Milton are Holland Road at an average of £139,290, Hamlet Court Road at an average of £168,510 and Ceylon Road at an average of £172,357.
Which train stations are available in or near Milton?
Some of the train stations available in or near Milton are Westcliff, Southend Central and Southend Victoria.
Property Price Paid in Milton by Year
The average sold property price by year was:
| Year | Average Sold Price | Price Change |
Sold Properties
|
|---|---|---|---|
| 2025 | £276,325 | -4% |
97 Properties |
| 2024 | £286,947 | 8% |
143 Properties |
| 2023 | £262,985 | -8% |
108 Properties |
| 2022 | £283,862 | 1% |
180 Properties |
| 2021 | £281,465 | 1% |
218 Properties |
| 2020 | £278,137 | 14% |
110 Properties |
| 2019 | £239,852 | -11% |
120 Properties |
| 2018 | £266,734 | 14% |
174 Properties |
| 2017 | £229,766 | 1% |
188 Properties |
| 2016 | £226,693 | 23% |
217 Properties |
| 2015 | £174,476 | - |
203 Properties |
| 2014 | £174,471 | -11% |
198 Properties |
| 2013 | £194,427 | 18% |
134 Properties |
| 2012 | £159,372 | -8% |
107 Properties |
| 2011 | £172,117 | -2% |
123 Properties |
| 2010 | £174,851 | 6% |
104 Properties |
| 2009 | £164,533 | -1% |
106 Properties |
| 2008 | £166,204 | -4% |
135 Properties |
| 2007 | £173,053 | 7% |
300 Properties |
| 2006 | £161,553 | 8% |
283 Properties |
| 2005 | £148,811 | 3% |
220 Properties |
| 2004 | £143,637 | 17% |
266 Properties |
| 2003 | £119,230 | 19% |
266 Properties |
| 2002 | £97,030 | 21% |
317 Properties |
| 2001 | £76,562 | 5% |
291 Properties |
| 2000 | £72,896 | 13% |
291 Properties |
| 1999 | £63,575 | 18% |
288 Properties |
| 1998 | £51,963 | -2% |
240 Properties |
| 1997 | £52,860 | 14% |
222 Properties |
| 1996 | £45,621 | 4% |
213 Properties |
| 1995 | £43,953 | - |
226 Properties |
Property Price per Property Type in Milton
Here you can find historic sold price data in order to help with your property search.
The average Property Paid Price for specific property types in the last three years are:
| Property Type | Average Sold Price | Sold Properties |
|---|---|---|
| Semi Detached House | £459,088.00 | 36 Semi Detached Houses |
| Detached House | £549,862.00 | 21 Detached Houses |
| Terraced House | £316,387.00 | 34 Terraced Houses |
| Flat | £223,377.00 | 257 Flats |

