
Houses for sale & to rent in Windle, St Helens
House Prices in Windle
Properties in Windle have an average house price of £193k and had 425 Property Transactions within the last 3 years¹.
Windle is an area in St Helens, St. Helens with 4,431 households², where the most expensive property was sold for £715k.
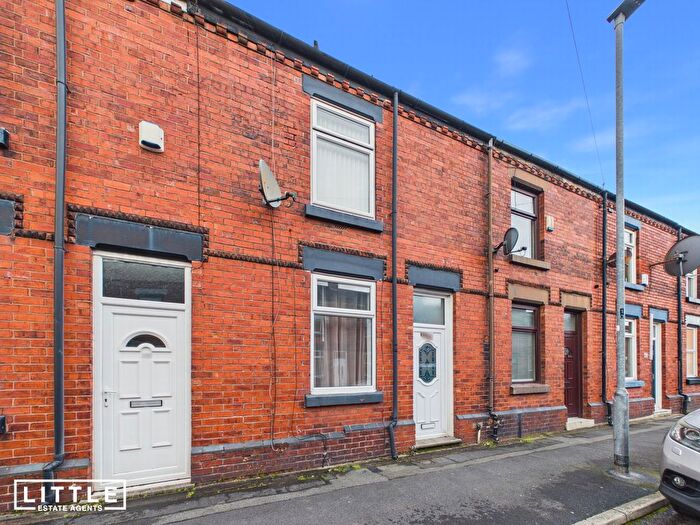
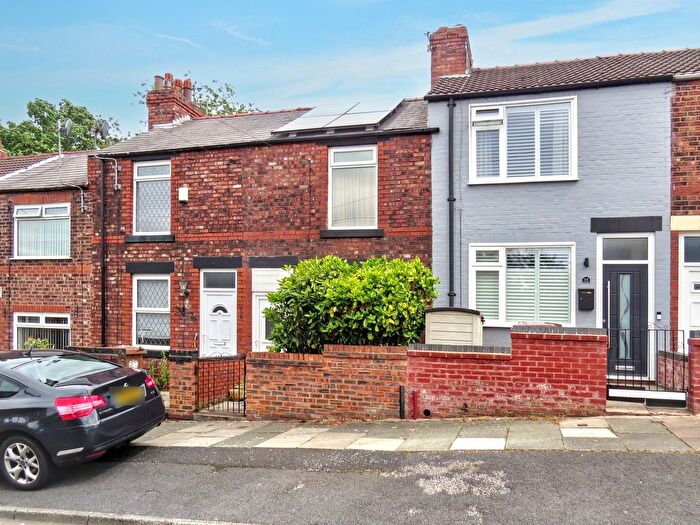
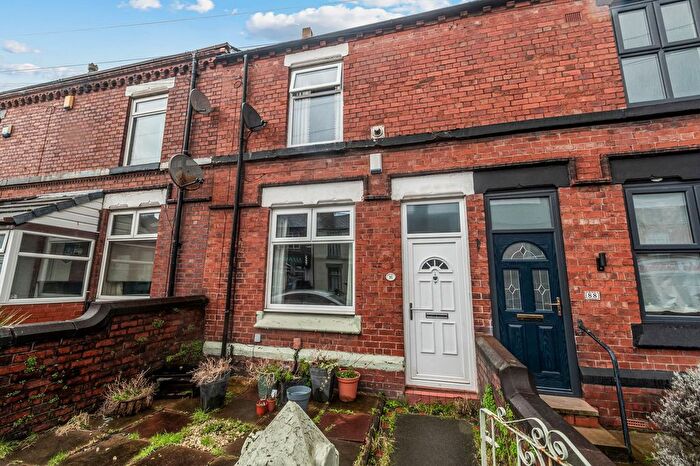
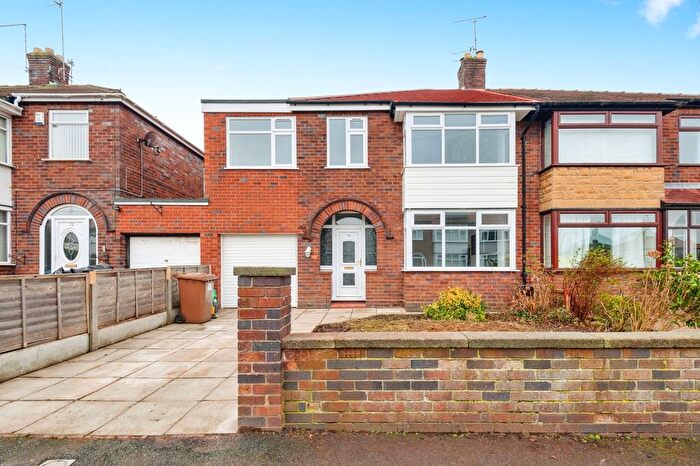
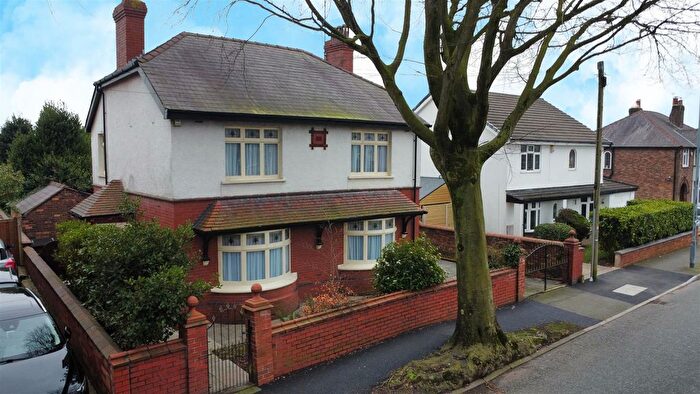
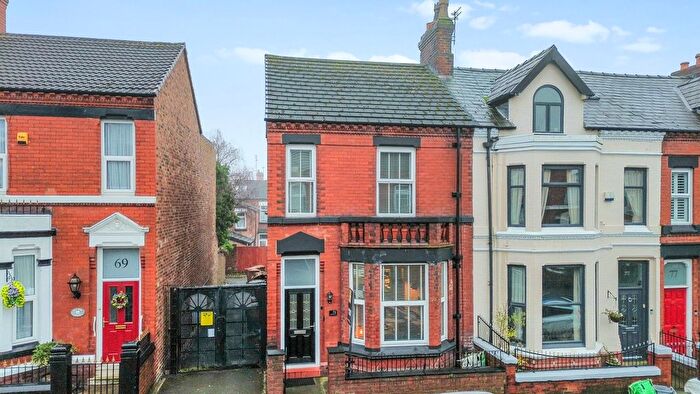
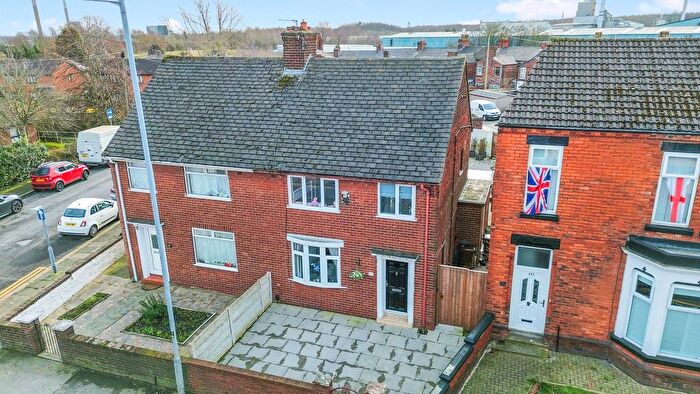
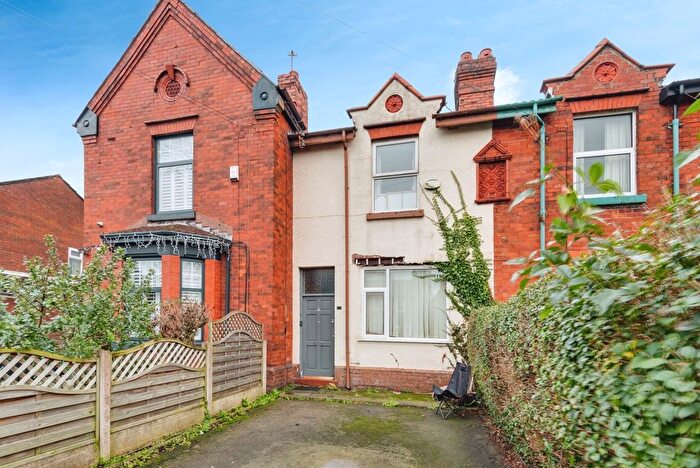
Properties for sale in Windle
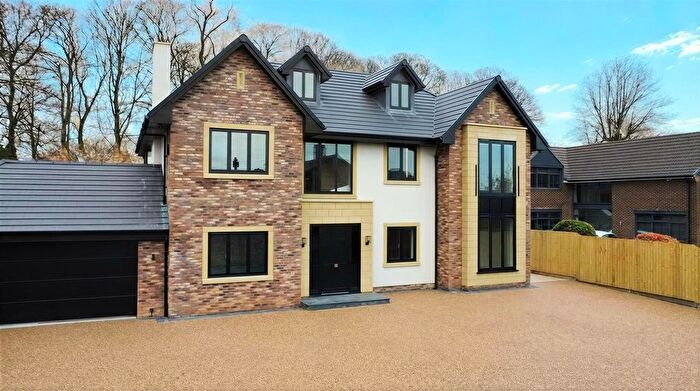
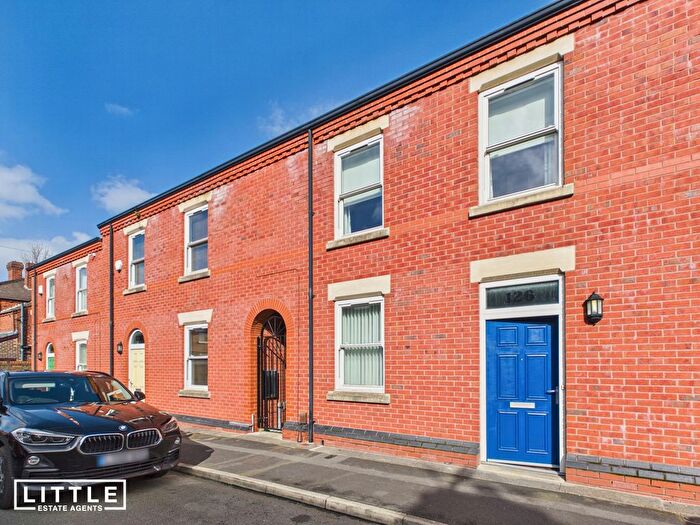
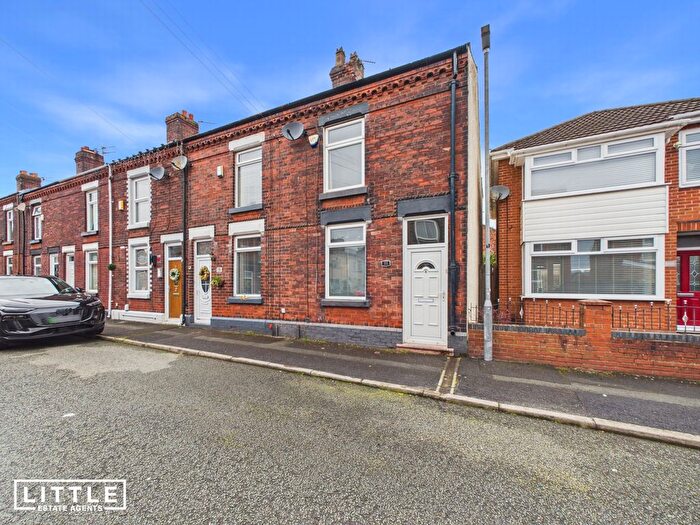
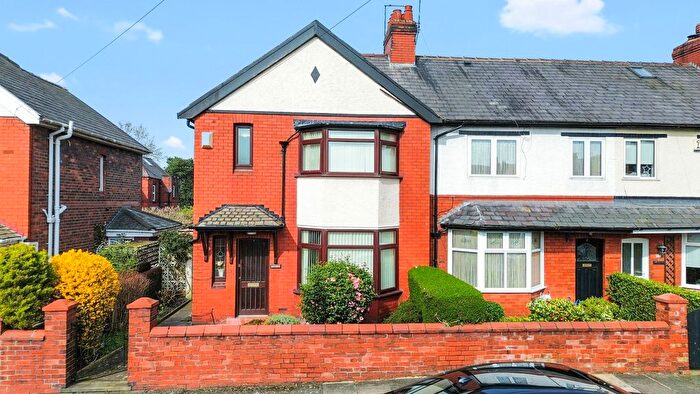
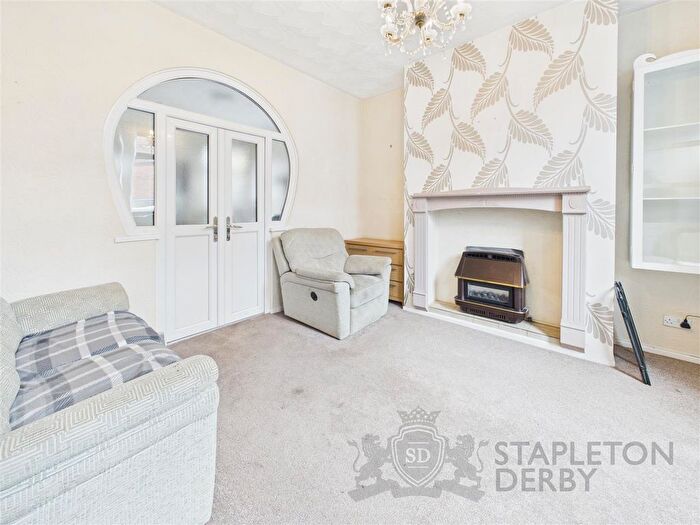
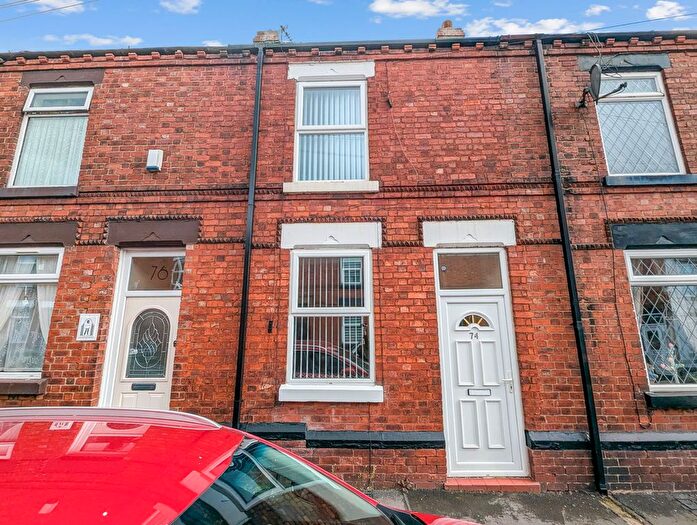
![]()
If you are looking to sell your house, let it out, or receive a property valuation, an expert can help you.
Click the button below to get started.
Roads and Postcodes in Windle
Navigate through our locations to find the location of your next house in Windle, St Helens for sale or to rent.
Transport near Windle
-
 St.Helens Central Station
 -
Thatto Heath Station
-
Eccleston Park Station
-
Lea Green Station
-
St.Helens Junction Station
- FAQ
- Price Paid By Year
- Property Type Price
Frequently asked questions about Windle
What is the average price for a property for sale in Windle?
The average price for a property for sale in Windle is £193,162. This amount is 13% higher than the average price in St Helens. There are 1,176 property listings for sale in Windle.
What streets have the most expensive properties for sale in Windle?
The streets with the most expensive properties for sale in Windle are Rainford Road at an average of £465,333, Eaton Road at an average of £453,333 and Kingsley Road at an average of £426,666.
What streets have the most affordable properties for sale in Windle?
The streets with the most affordable properties for sale in Windle are Morley Street at an average of £76,333, Duke Street at an average of £85,000 and Atherton Street at an average of £86,000.
Which train stations are available in or near Windle?
Some of the train stations available in or near Windle are St.Helens Central, Thatto Heath and Eccleston Park.
Property Price Paid in Windle by Year
The average sold property price by year was:
| Year | Average Sold Price | Price Change |
Sold Properties
|
|---|---|---|---|
| 2026 | £178,750 | -16% |
2 Properties |
| 2025 | £208,148 | 14% |
142 Properties |
| 2024 | £178,869 | -8% |
145 Properties |
| 2023 | £192,966 | -2% |
136 Properties |
| 2022 | £196,520 | 11% |
174 Properties |
| 2021 | £174,383 | -1% |
213 Properties |
| 2020 | £175,340 | 15% |
159 Properties |
| 2019 | £149,565 | -3% |
169 Properties |
| 2018 | £154,266 | -3% |
178 Properties |
| 2017 | £159,223 | 8% |
209 Properties |
| 2016 | £146,438 | 15% |
143 Properties |
| 2015 | £124,210 | -20% |
139 Properties |
| 2014 | £149,666 | -0,3% |
137 Properties |
| 2013 | £150,097 | 18% |
117 Properties |
| 2012 | £122,487 | -5% |
74 Properties |
| 2011 | £128,800 | -14% |
81 Properties |
| 2010 | £146,204 | -2% |
78 Properties |
| 2009 | £149,486 | -1% |
89 Properties |
| 2008 | £151,563 | 7% |
94 Properties |
| 2007 | £140,652 | 5% |
189 Properties |
| 2006 | £133,254 | 14% |
189 Properties |
| 2005 | £114,925 | 2% |
149 Properties |
| 2004 | £112,138 | 19% |
224 Properties |
| 2003 | £91,252 | 11% |
240 Properties |
| 2002 | £81,089 | 7% |
198 Properties |
| 2001 | £75,408 | 26% |
253 Properties |
| 2000 | £55,773 | 7% |
161 Properties |
| 1999 | £52,053 | -5% |
190 Properties |
| 1998 | £54,732 | 7% |
179 Properties |
| 1997 | £50,858 | 1% |
172 Properties |
| 1996 | £50,541 | 9% |
136 Properties |
| 1995 | £46,039 | - |
103 Properties |
Property Price per Property Type in Windle
Here you can find historic sold price data in order to help with your property search.
The average Property Paid Price for specific property types in the last three years are:
| Property Type | Average Sold Price | Sold Properties |
|---|---|---|
| Flat | £133,550.00 | 10 Flats |
| Semi Detached House | £243,395.00 | 160 Semi Detached Houses |
| Detached House | £338,392.00 | 33 Detached Houses |
| Terraced House | £138,056.00 | 222 Terraced Houses |