
Houses for sale in St Helens, St. Helens
House Prices in St Helens
Properties in St Helens have an average house price of £172k and had 5,263 Property Transactions within the last 3 years.¹
St Helens is an area in St. Helens with 59,043 households², where the most expensive property was sold for £4.23M.
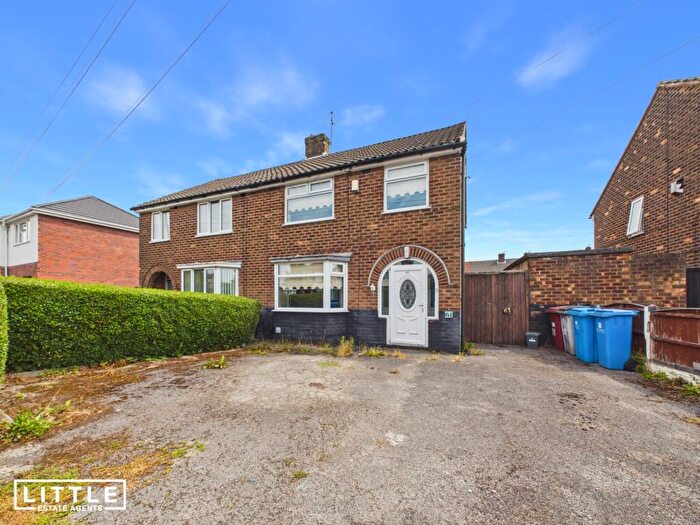
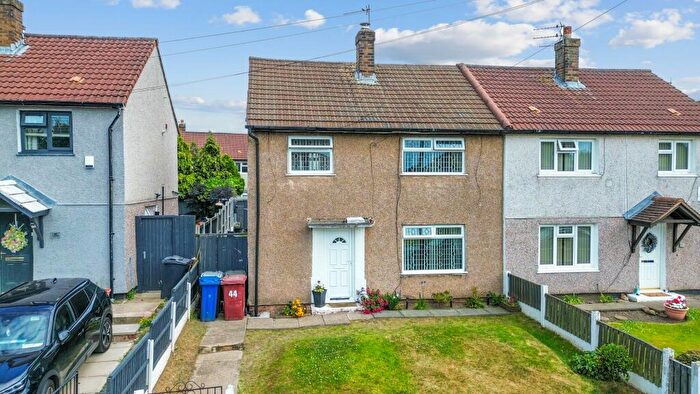
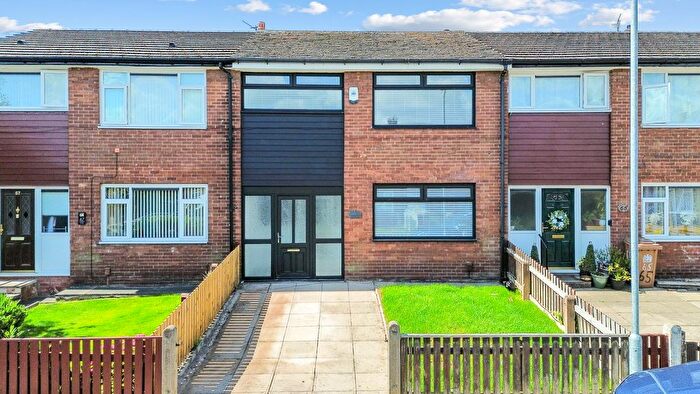
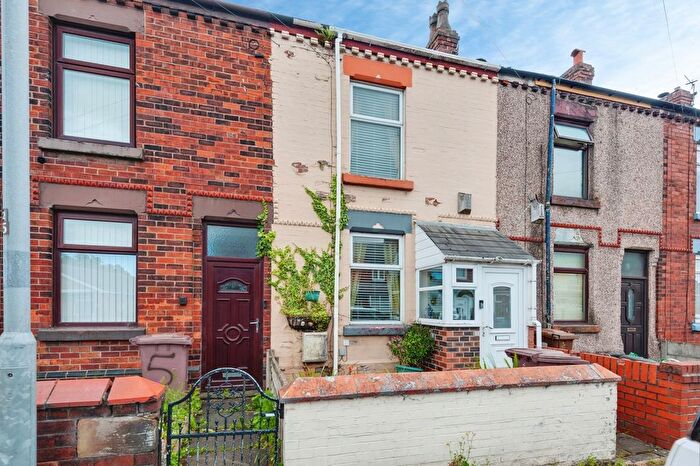
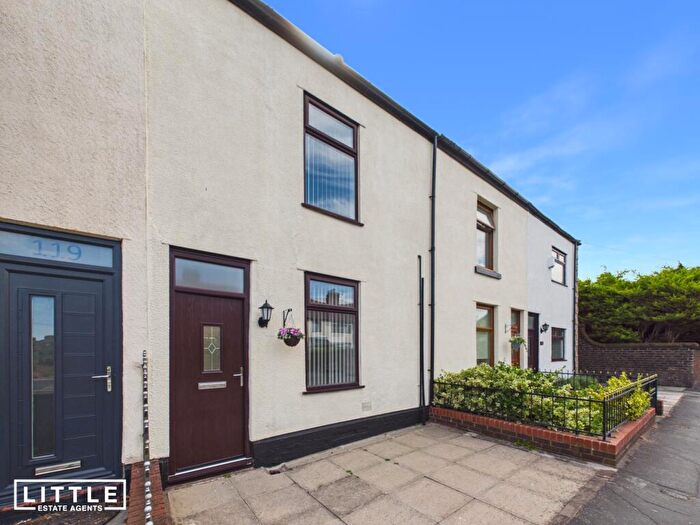
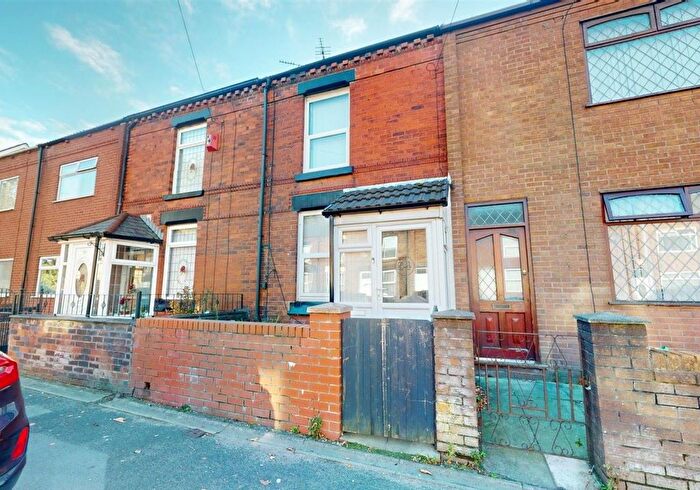
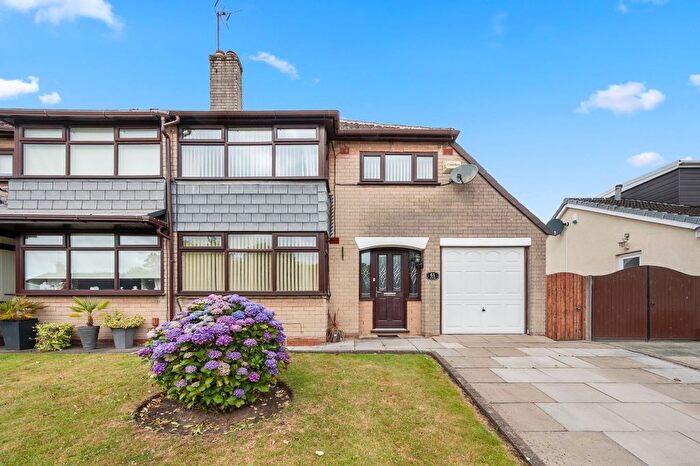
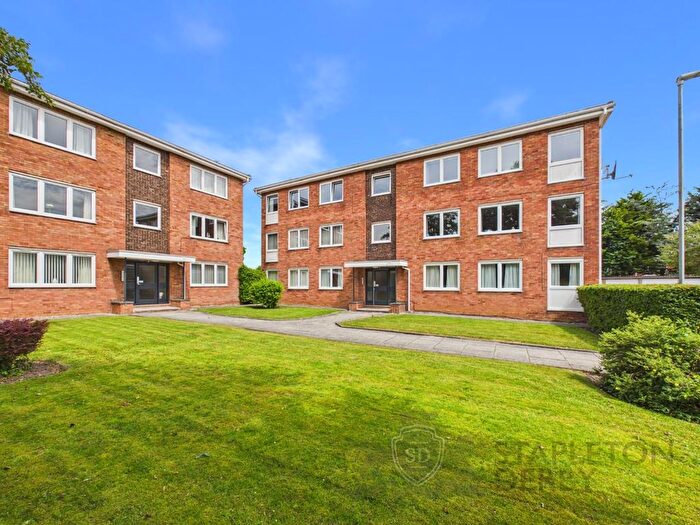
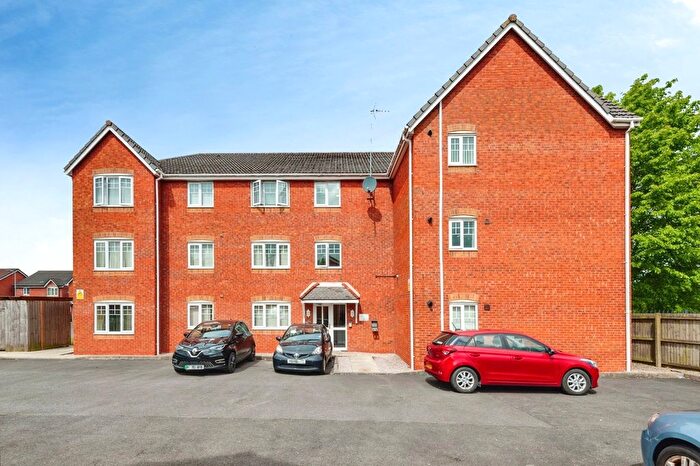
Properties for sale in St Helens
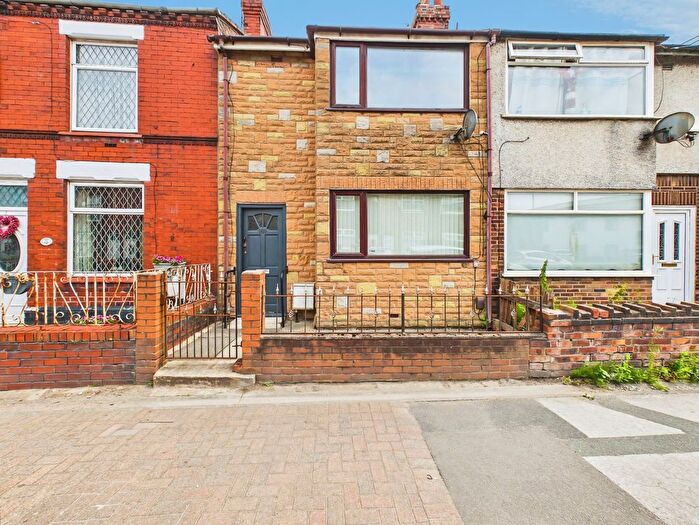
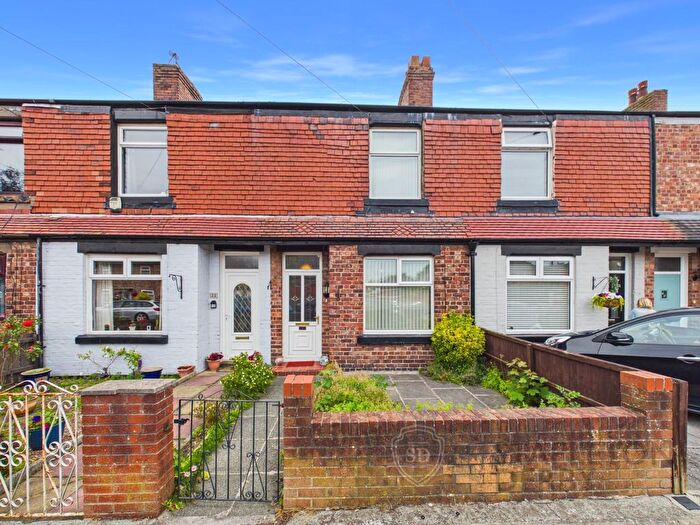
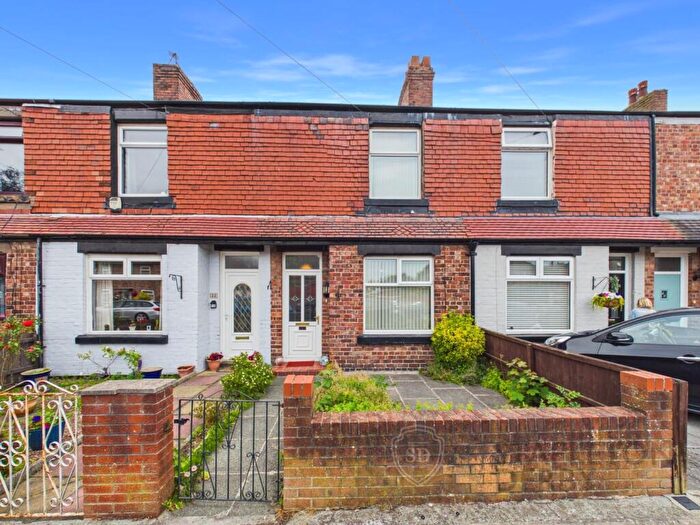
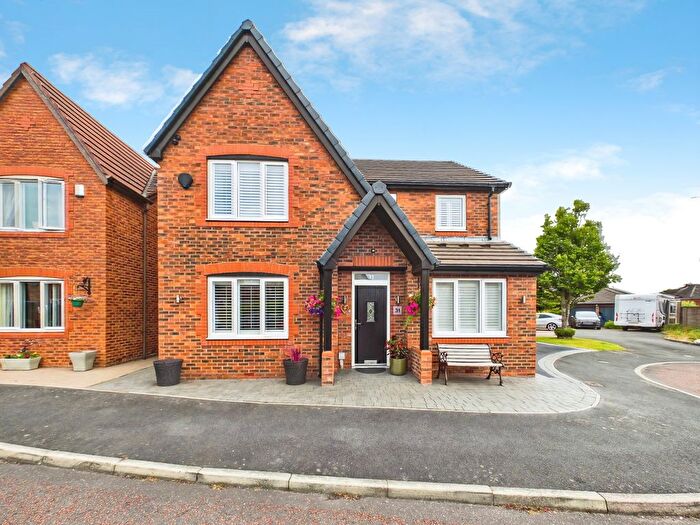
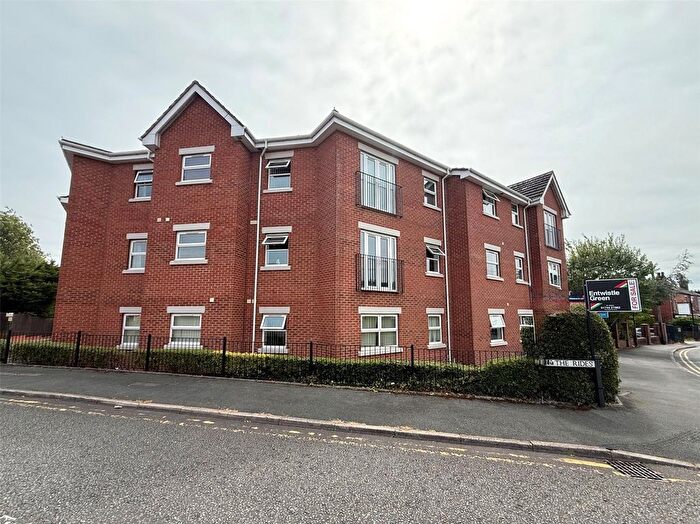
![]()
If you are looking to sell your house, let it out, or receive a property valuation, an expert can help you.
Click the button below to get started.

Neighbourhoods in St Helens
Navigate through our locations to find the location of your next house in St Helens, St. Helens for sale or to rent.
Property price trends in St Helens
According to the latest Land Registry data, the average home in St Helens sold for £175,164 in 2026. That figure comes from a substantial record of 56,646 sales logged over the past 31 years.
Prices have continued to climb over the last three years. Compared with 2023, when the typical sale came in around £162,383, that's a rise of roughly 7.9%.
Looking back five years, average prices are up about 14.5% since 2021, a gain of around £22,166 in cash terms.
Zoom out to the past decade for the fuller picture. Back in 2016, homes here averaged £129,477, so the typical sold price has climbed about 35.3% since then, roughly 3.1% a year. Stretch the view to fifteen years and that annual pace eases back to about 2.8%.
Frequently asked questions about St Helens
What is the average price for a property for sale in St Helens?
The average price for a property for sale in St Helens is £172,293. This amount is 8% lower than the average price in St. Helens. There are more than 10,000 property listings for sale in St Helens.
What locations have the most expensive properties for sale in St Helens?
The locations with the most expensive properties for sale in St Helens are Rainford at an average of £293,486, Eccleston at an average of £283,820 and Windle at an average of £195,680.
What locations have the most affordable properties for sale in St Helens?
The locations with the most affordable properties for sale in St Helens are Parr at an average of £112,702, Town Centre at an average of £113,538 and West Park at an average of £136,629.
Which train stations are available in or near St Helens?
Some of the train stations available in or near St Helens are St.Helens Central, Thatto Heath and Lea Green.
Property Price Paid in St Helens by Year
The average sold property price by year was:
| Year | Average Sold Price | Price Change |
Sold Properties
|
|---|---|---|---|
| 2026 | £175,164 | -2% |
112 Properties |
| 2025 | £177,983 | 1% |
1,626 Properties |
| 2024 | £176,166 | 8% |
1,840 Properties |
| 2023 | £162,383 | -1% |
1,685 Properties |
| 2022 | £164,692 | 7% |
2,077 Properties |
| 2021 | £152,998 | 4% |
2,434 Properties |
| 2020 | £146,275 | 5% |
1,786 Properties |
| 2019 | £139,346 | 5% |
1,950 Properties |
| 2018 | £132,402 | -0,3% |
1,957 Properties |
| 2017 | £132,843 | 3% |
2,006 Properties |
Property Price per Property Type in St Helens
Here you can find historic sold price data in order to help with your property search.
The average Property Paid Price for specific property types in the last three years are:
| Property Type | Average Sold Price | Sold Properties |
|---|---|---|
| Semi Detached House | £189,333.00 | 2,084 Semi Detached Houses |
| Terraced House | £120,139.00 | 2,258 Terraced Houses |
| Detached House | £332,908.00 | 647 Detached Houses |
| Flat | £93,221.00 | 274 Flats |
Transport in St Helens
Please see below transportation links in this area:
