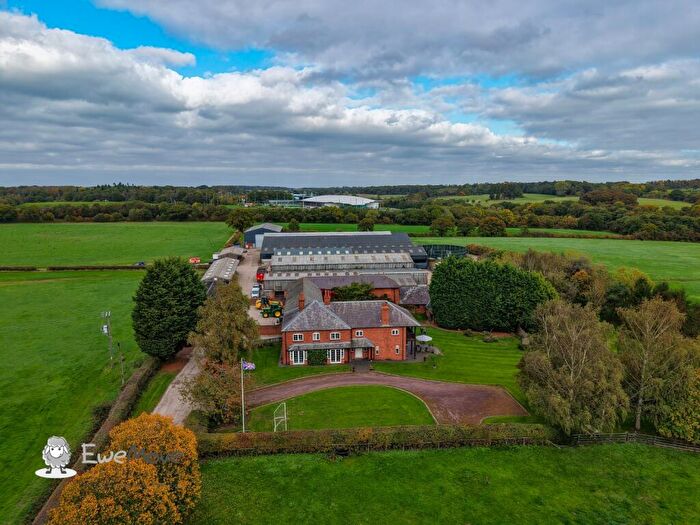
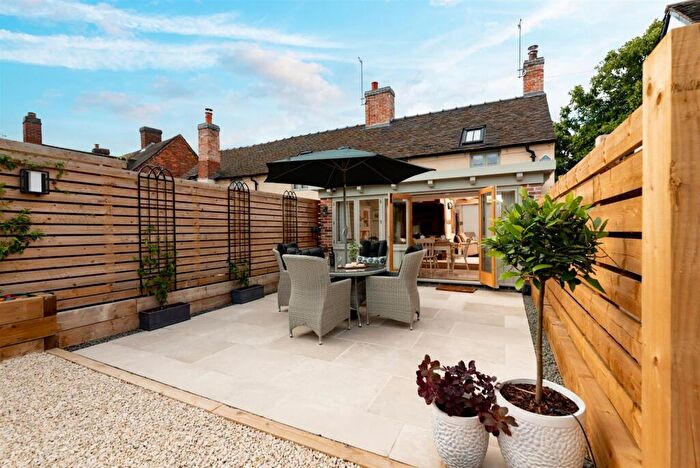
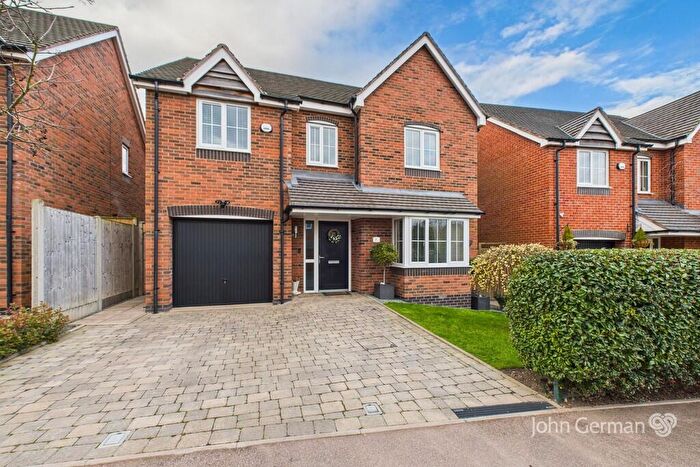
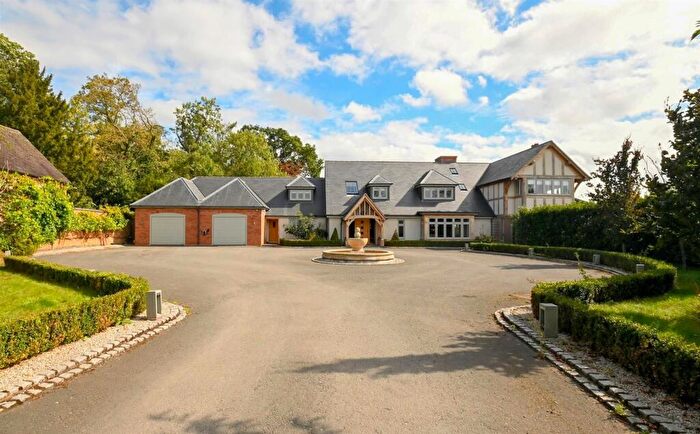
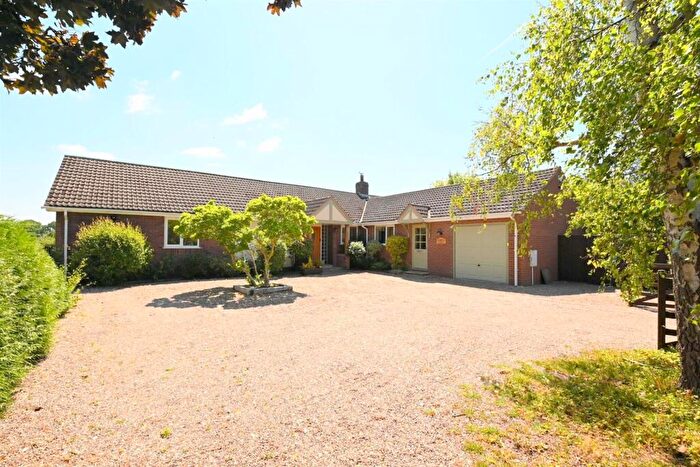
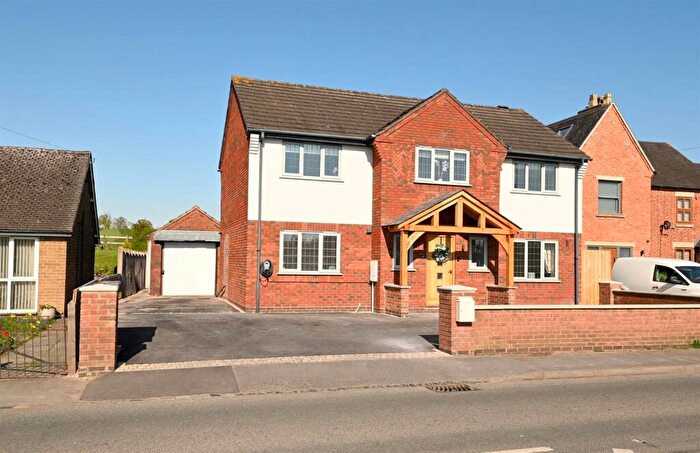
Houses for sale & to rent in Yoxall, Burton-on-trent
House Prices in Yoxall
Properties in Yoxall have an average house price of £475,127.00 and had 118 Property Transactions within the last 3 years¹.
Yoxall is an area in Burton-on-trent, Staffordshire with 1,089 households², where the most expensive property was sold for £3,100,000.00.
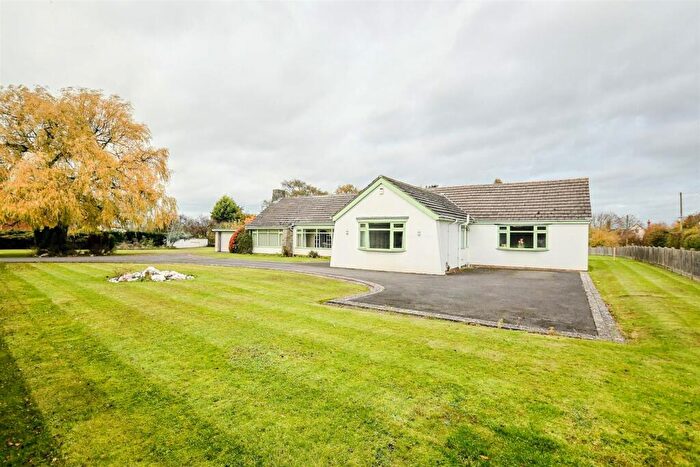
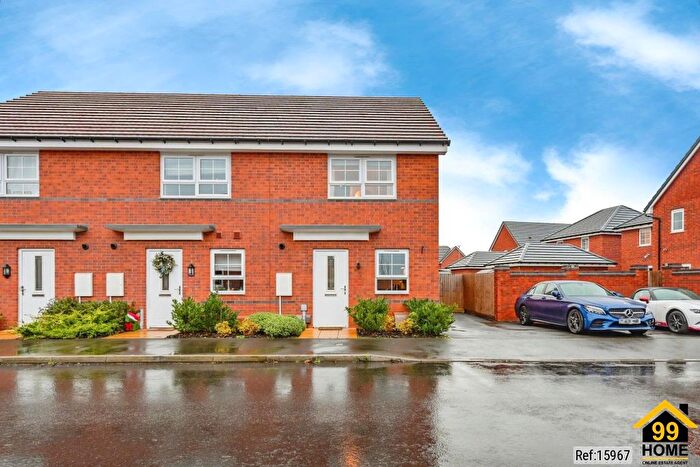
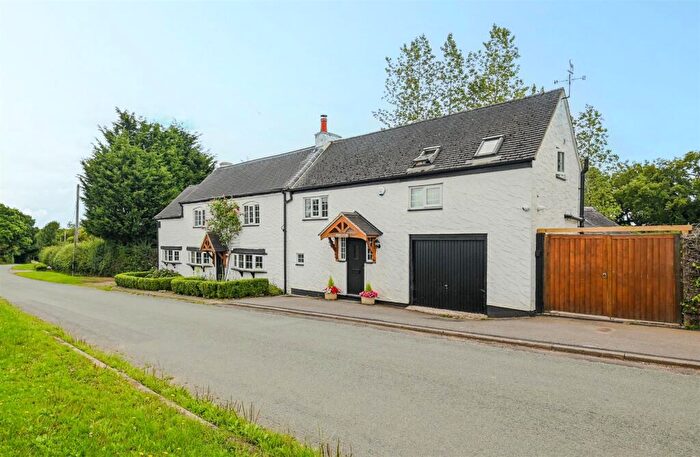
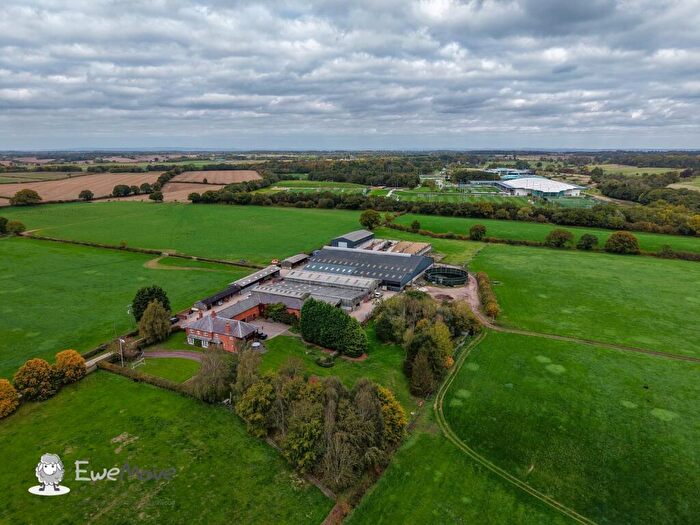
Properties for sale in Yoxall
Roads and Postcodes in Yoxall
Navigate through our locations to find the location of your next house in Yoxall, Burton-on-trent for sale or to rent.
| Streets | Postcodes |
|---|---|
| Abbots Bromley Road | DE13 8QU DE13 8RA DE13 8RB DE13 8RU |
| Alexandra Drive | DE13 8PL |
| Alwyn Road | DE13 8QB |
| Becks Lane | DE13 8RF |
| Bishops Hill | DE13 8SL |
| Bond End | DE13 8NH DE13 8NJ |
| Bondfield Lane | DE13 8QF |
| Brickhill Lane | DE13 8SW |
| Brown Lane | DE13 8NW |
| Chantry Lane | DE13 8RX |
| Chapel Lane | DE13 8SQ |
| Church Lane | DE13 8RT |
| Churchfields | DE13 8PU DE13 8PX |
| Dolefoot Lane | DE13 8SP |
| Duffield Lane | DE13 8SH |
| Elton Close | DE13 8SX |
| Elton Lane | DE13 8SG |
| Ferrers Road | DE13 8PS |
| Gisborne Close | DE13 8NU |
| Hadley Court | DE13 8NZ |
| Hadley End | DE13 8PF |
| Hadley Street | DE13 8NB |
| Hall Estate | DE13 8QS |
| Hollybush Road | DE13 8SF |
| Hollys Road | DE13 8PZ |
| King Street | DE13 8NF |
| Leafields Croft | DE13 8PB |
| Lightwood Road | DE13 8QD DE13 8QE |
| Lodge Lane | DE13 8PJ |
| Longcroft | DE13 8NT |
| Lovell Road | DE13 8QA |
| Lower Hoar Cross Road | DE13 8RE |
| Main Street | DE13 8NQ |
| Maker Lane | DE13 8QR |
| Meadow Lane | DE13 8NP DE13 8FJ |
| Moat Lane | DE13 8SS |
| Morrey | DE13 8PE |
| Morrey Lane | DE13 8ND |
| Newborough End | DE13 8SR |
| Newborough Road | DE13 8RD |
| Newchurch | DE13 8RH DE13 8RJ DE13 8RL DE13 8RQ |
| Newchurch Road | DE13 8RG |
| Raven Road | DE13 8PY |
| Reeve End | DE13 8NE |
| Rookery Close | DE13 8QH |
| Roost Hill | DE13 8ST |
| Sandpits Lane | DE13 8PR |
| Savey Lane | DE13 8PD |
| Scotch Hill Road | DE13 8RN DE13 8RP |
| Squirrels Corner | DE13 8SA |
| St Peters Way | DE13 8NY |
| Stoneyford | DE13 8BW |
| Sudbury Road | DE13 8NA DE13 8PQ |
| Swainsfield Road | DE13 8PT |
| Swarbourn Close | DE13 8NX |
| The Mill | DE13 8PN |
| Thorney Lanes | DE13 8QT DE13 8RY DE13 8RZ |
| Town Hill | DE13 8NN |
| Victoria Street | DE13 8NG |
| Weaverlake Drive | DE13 8AD |
| Wood Lane | DE13 8PH |
| Woodhouses | DE13 8NR |
| Woodmill | DE13 8PG |
| Yoxall Road | DE13 8SB DE13 8SU |
| DE13 8BN DE13 8NL |
Transport near Yoxall
-
Rugeley Trent Valley Station
-
Rugeley Town Station
-
Burton-On-Trent Station
-
Tutbury and Hatton Station
-
Lichfield Trent Valley Station
-
Lichfield City Station
-
Uttoxeter Station
- FAQ
- Price Paid By Year
- Property Type Price
Frequently asked questions about Yoxall
What is the average price for a property for sale in Yoxall?
The average price for a property for sale in Yoxall is £475,127. This amount is 97% higher than the average price in Burton-on-trent. There are 636 property listings for sale in Yoxall.
What streets have the most expensive properties for sale in Yoxall?
The streets with the most expensive properties for sale in Yoxall are Newchurch at an average of £1,391,000, Savey Lane at an average of £757,333 and Longcroft at an average of £750,000.
What streets have the most affordable properties for sale in Yoxall?
The streets with the most affordable properties for sale in Yoxall are Hollys Road at an average of £245,000, Main Street at an average of £248,750 and Lovell Road at an average of £255,055.
Which train stations are available in or near Yoxall?
Some of the train stations available in or near Yoxall are Rugeley Trent Valley, Rugeley Town and Burton-On-Trent.
Property Price Paid in Yoxall by Year
The average sold property price by year was:
| Year | Average Sold Price | Price Change |
Sold Properties
|
|---|---|---|---|
| 2025 | £565,525 | 17% |
20 Properties |
| 2024 | £469,954 | 2% |
33 Properties |
| 2023 | £461,250 | 4% |
24 Properties |
| 2022 | £443,317 | -9% |
41 Properties |
| 2021 | £482,468 | 9% |
65 Properties |
| 2020 | £436,838 | -11% |
44 Properties |
| 2019 | £484,277 | 19% |
42 Properties |
| 2018 | £393,528 | -4% |
44 Properties |
| 2017 | £408,381 | 9% |
52 Properties |
| 2016 | £372,275 | 6% |
37 Properties |
| 2015 | £349,208 | -5% |
42 Properties |
| 2014 | £367,051 | 11% |
44 Properties |
| 2013 | £325,465 | -23% |
36 Properties |
| 2012 | £398,734 | 24% |
23 Properties |
| 2011 | £301,687 | 3% |
24 Properties |
| 2010 | £292,640 | 2% |
35 Properties |
| 2009 | £285,361 | -26% |
26 Properties |
| 2008 | £360,853 | 24% |
28 Properties |
| 2007 | £275,584 | -27% |
45 Properties |
| 2006 | £350,070 | 23% |
44 Properties |
| 2005 | £269,198 | -13% |
34 Properties |
| 2004 | £303,610 | 0,4% |
47 Properties |
| 2003 | £302,439 | 11% |
37 Properties |
| 2002 | £268,119 | 38% |
46 Properties |
| 2001 | £164,970 | 15% |
56 Properties |
| 2000 | £140,721 | 11% |
65 Properties |
| 1999 | £124,603 | -10% |
43 Properties |
| 1998 | £136,449 | 14% |
42 Properties |
| 1997 | £117,708 | 16% |
41 Properties |
| 1996 | £98,347 | 19% |
31 Properties |
| 1995 | £79,778 | - |
23 Properties |
Property Price per Property Type in Yoxall
Here you can find historic sold price data in order to help with your property search.
The average Property Paid Price for specific property types in the last three years are:
| Property Type | Average Sold Price | Sold Properties |
|---|---|---|
| Semi Detached House | £299,924.00 | 38 Semi Detached Houses |
| Detached House | £595,142.00 | 66 Detached Houses |
| Terraced House | £400,269.00 | 13 Terraced Houses |
| Flat | £185,000.00 | 1 Flat |

