
Houses for sale in Staffordshire, England
House Prices in Staffordshire
Properties in Staffordshire have
an average house price of
£265k
and had 37,030 Property Transactions
within the last 3 years.¹
Staffordshire is a location in
England with
379,136 households², where the most expensive property was sold for £5.35M.
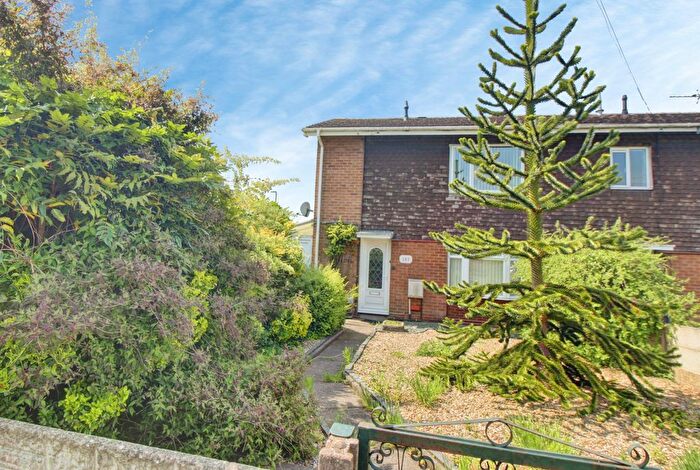
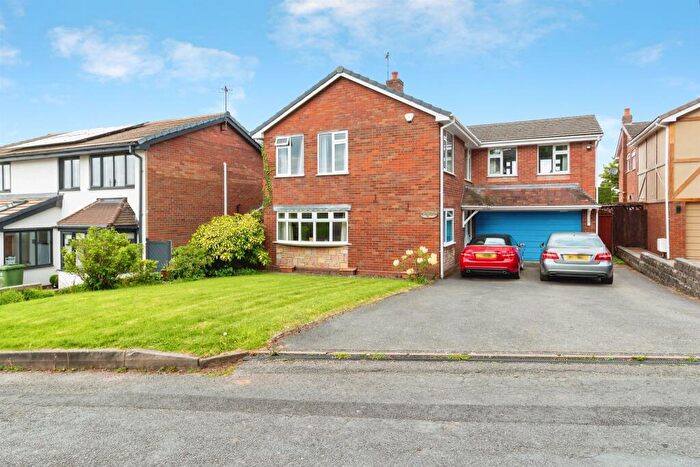
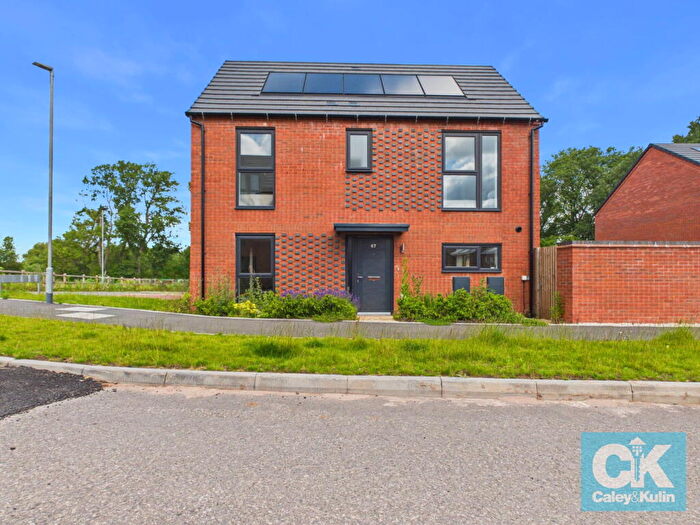
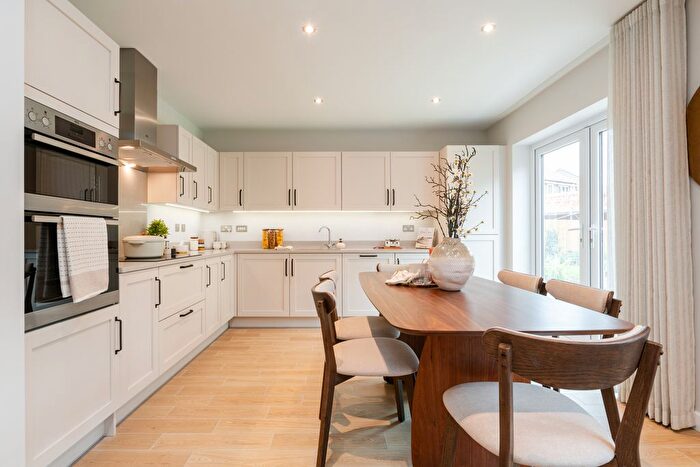
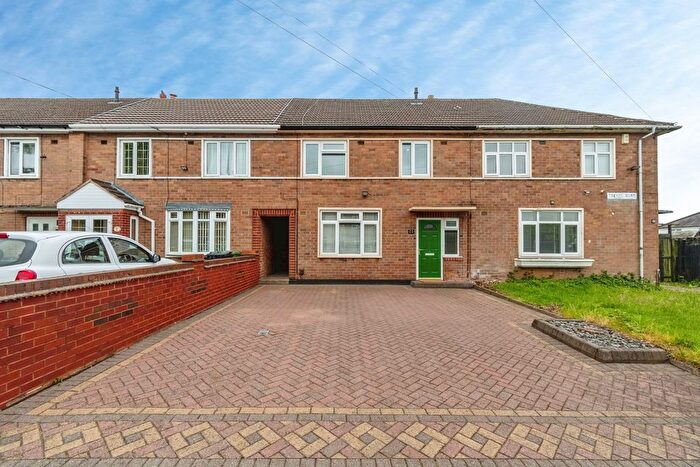
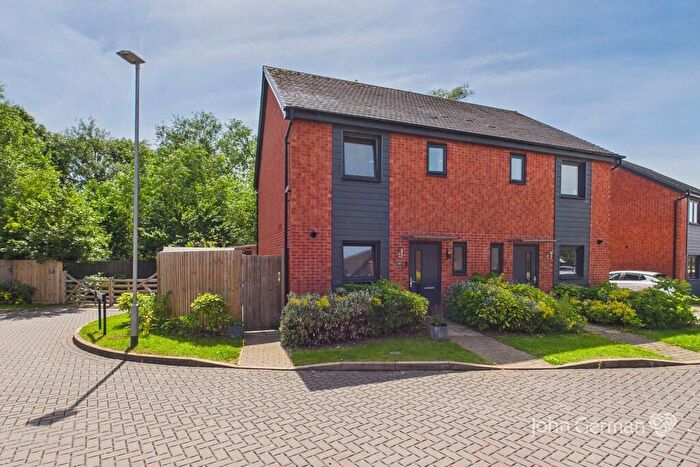
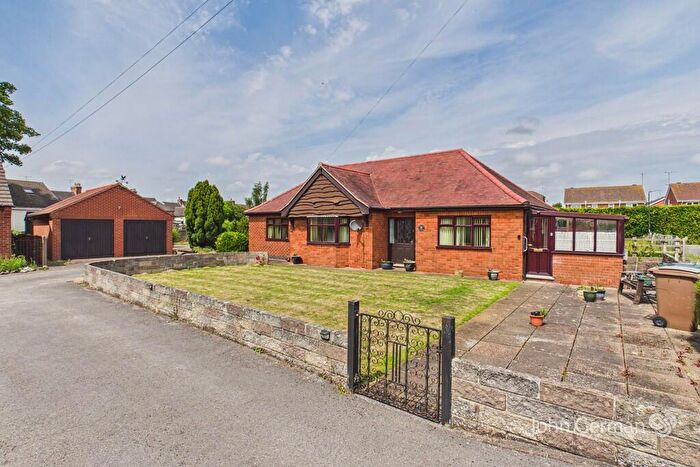
Properties for sale in Staffordshire
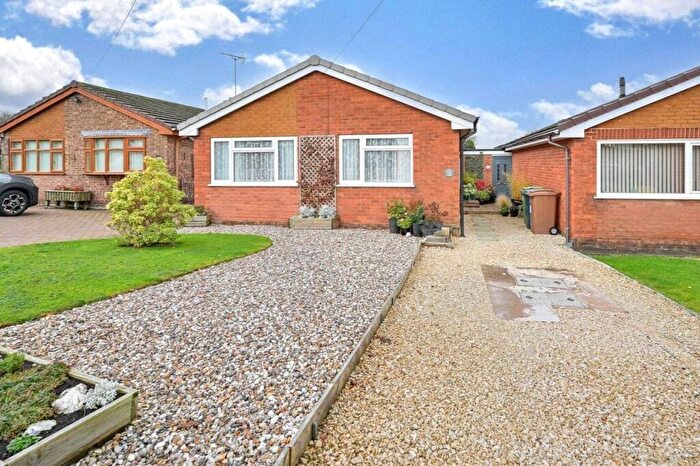
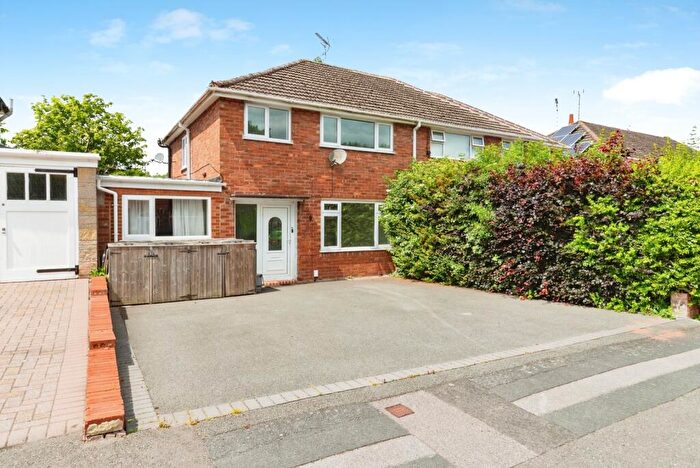
![]()
If you are looking to sell your house, let it out, or receive a property valuation, an expert can help you.
Click the button below to get started.
Towns in Staffordshire
Navigate through our locations to find the location of your next house in Staffordshire, England for sale or to rent.
Property price trends in Staffordshire
According to the latest Land Registry data, the average home in Staffordshire sold for £273,093 in 2026. That figure comes from a substantial record of 430,734 sales logged over the past 31 years.
Prices have continued to climb over the last three years. Compared with 2023, when the typical sale came in around £256,886, that's a rise of roughly 6.3%.
Looking back five years, average prices are up about 9.6% since 2021, a gain of around £24,009 in cash terms.
Zoom out to the past decade for the fuller picture. Back in 2016, homes here averaged £197,223, so the typical sold price has climbed about 38.5% since then, roughly 3.3% a year. Stretch the view to fifteen years and that annual pace holds at about 3.3%.
Frequently asked questions about Staffordshire
What is the average price for a property for sale in Staffordshire?
The average price for a property for sale in Staffordshire is £264,866. This amount is 26% lower than the average price in England. There are more than 10,000 property listings for sale in Staffordshire.
What locations have the most expensive properties for sale in Staffordshire?
The locations with the most expensive properties for sale in Staffordshire are Sutton Coldfield at an average of £929,083, Macclesfield at an average of £478,254 and Newport at an average of £466,785.
What locations have the most affordable properties for sale in Staffordshire?
The locations with the most affordable properties for sale in Staffordshire are Newcastle at an average of £202,127, Leek at an average of £227,268 and Cannock at an average of £232,375.
Which train stations are available in or near Staffordshire?
Some of the train stations available in or near Staffordshire are Stafford, Rugeley Trent Valley and Rugeley Town.
Property Price Paid in Staffordshire by Year
The average sold property price by year was:
| Year | Average Sold Price | Price Change |
Sold Properties
|
|---|---|---|---|
| 2026 | £273,093 | -1% |
1,562 Properties |
| 2025 | £275,000 | 5% |
12,239 Properties |
| 2024 | £260,844 | 2% |
12,247 Properties |
| 2023 | £256,886 | -1% |
10,982 Properties |
| 2022 | £259,351 | 4% |
13,572 Properties |
| 2021 | £249,084 | 5% |
17,455 Properties |
| 2020 | £237,210 | 4% |
13,335 Properties |
| 2019 | £227,742 | 6% |
15,745 Properties |
| 2018 | £214,451 | 3% |
15,556 Properties |
| 2017 | £207,086 | 5% |
15,886 Properties |
Property Price per Property Type in Staffordshire
Here you can find historic sold price data in order to help with your property search.
The average Property Paid Price for specific property types in the last three years are:
| Property Type | Average Sold Price | Sold Properties |
|---|---|---|
| Semi Detached House | £228,200.00 | 13,747 Semi Detached Houses |
| Terraced House | £182,742.00 | 8,752 Terraced Houses |
| Detached House | £398,249.00 | 11,798 Detached Houses |
| Flat | £136,484.00 | 2,733 Flats |
Transport in Staffordshire
Please see below transportation links in this area:
