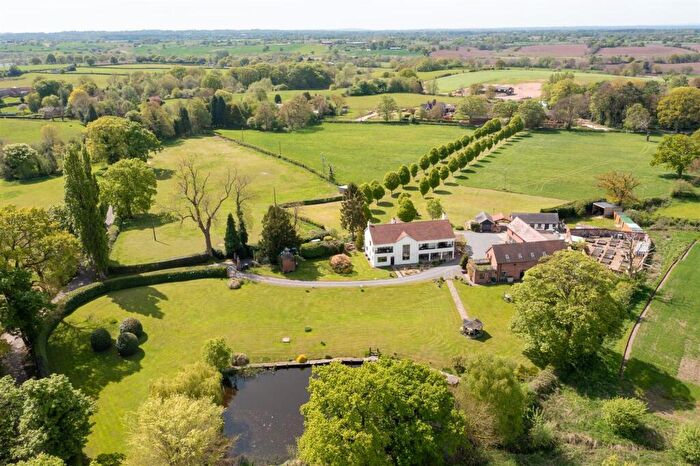
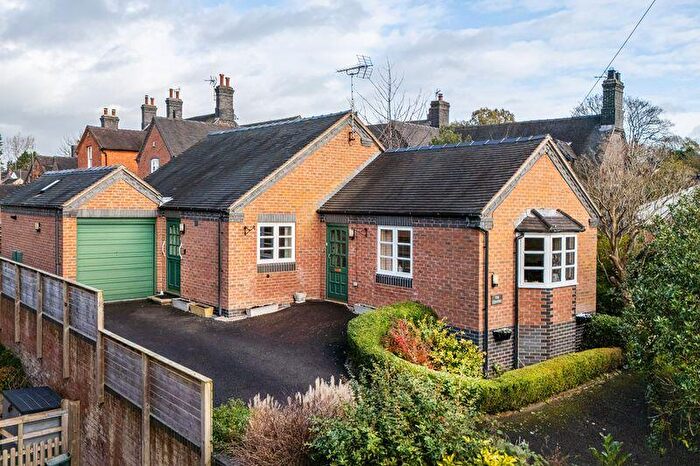
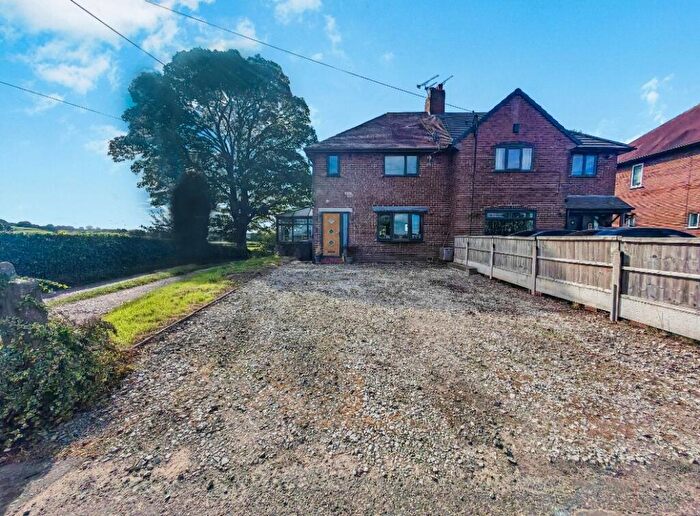
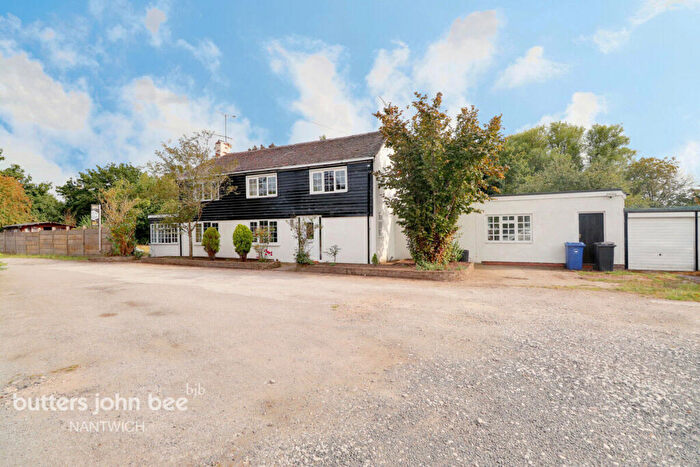
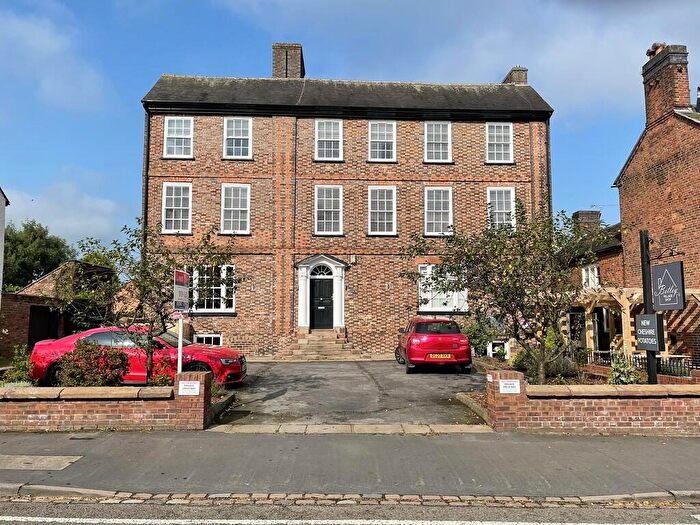
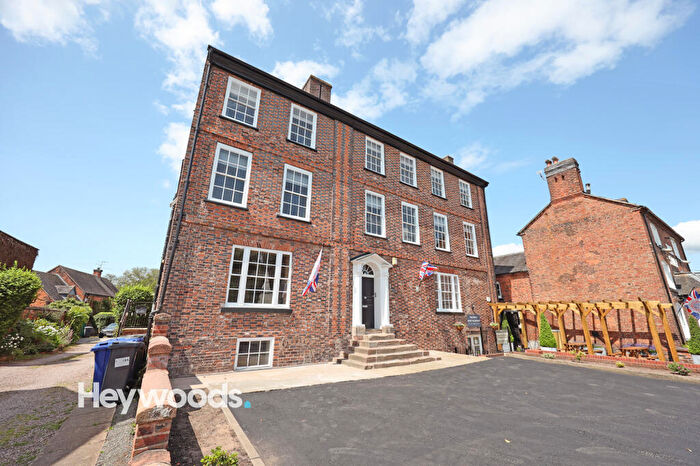
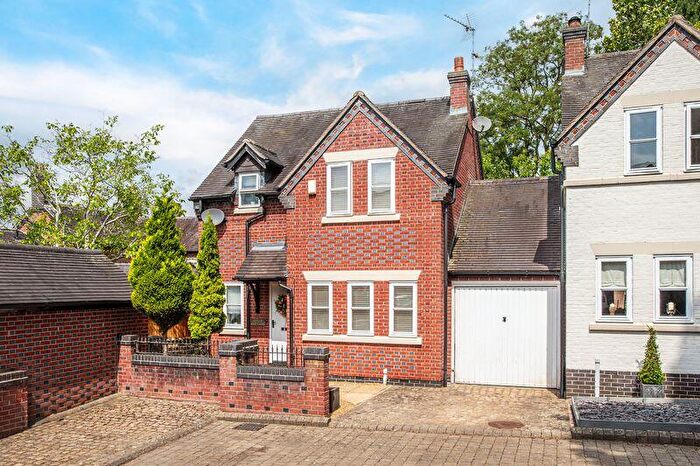
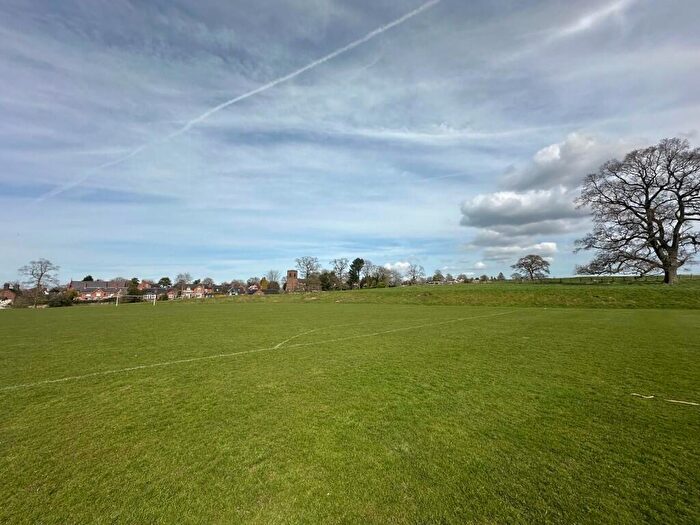
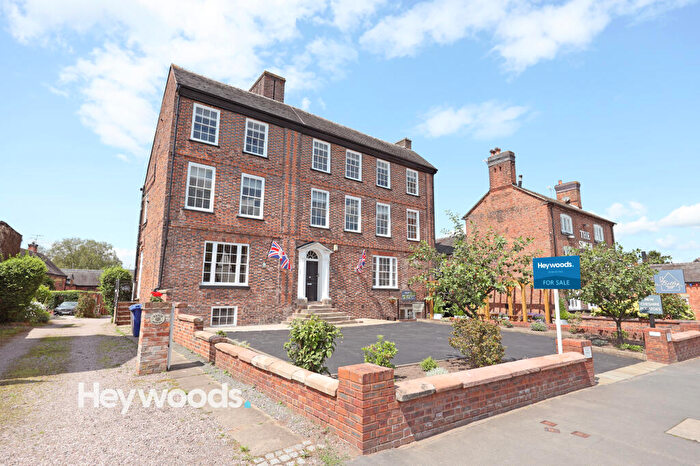
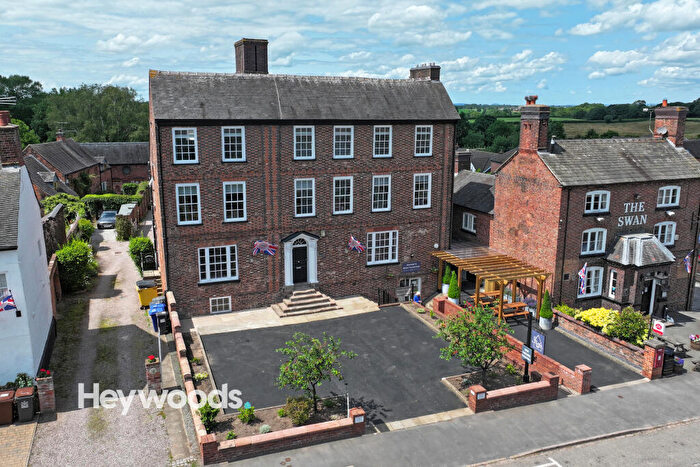
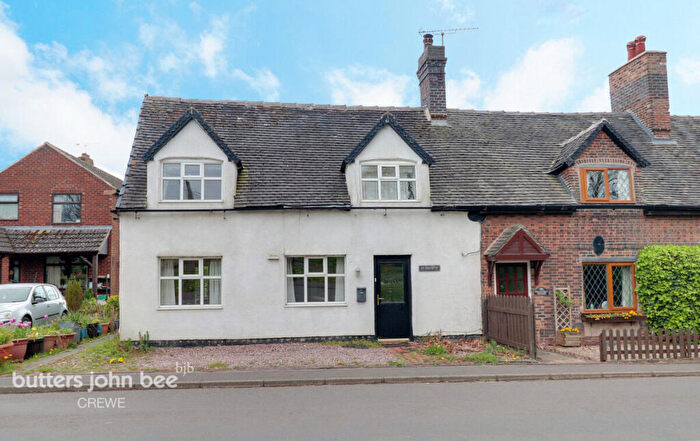
Houses for sale & to rent in Halmerend, Crewe
House Prices in Halmerend
Properties in Halmerend have an average house price of £460,939.00 and had 36 Property Transactions within the last 3 years¹.
Halmerend is an area in Crewe, Staffordshire with 534 households², where the most expensive property was sold for £925,000.00.
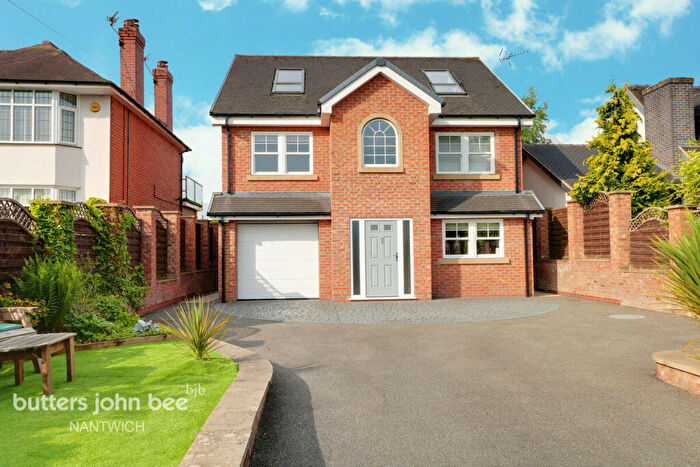
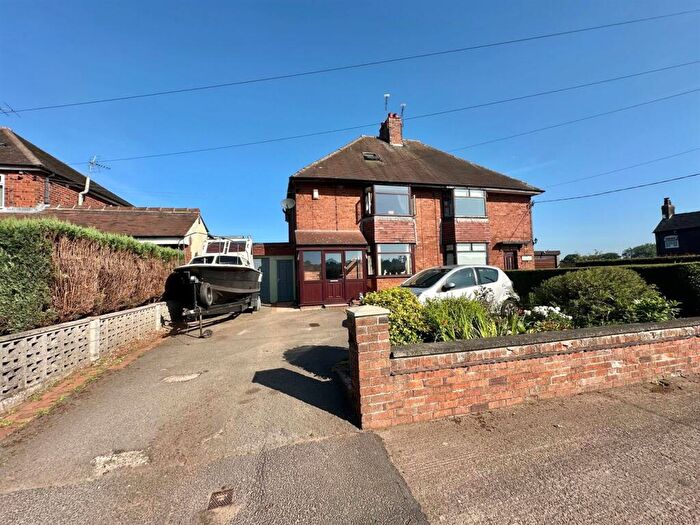
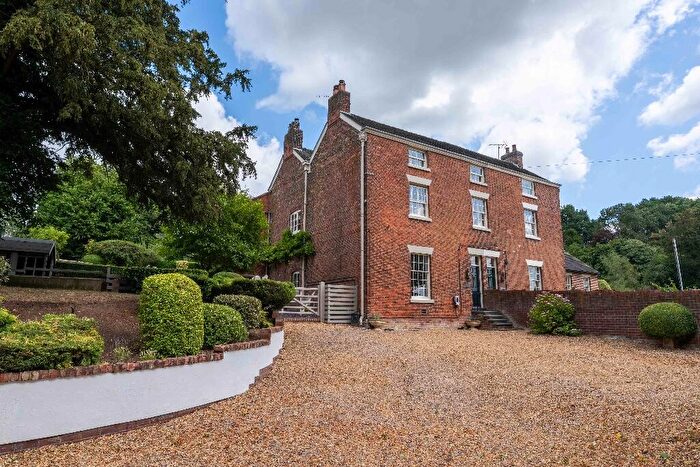
Properties for sale in Halmerend
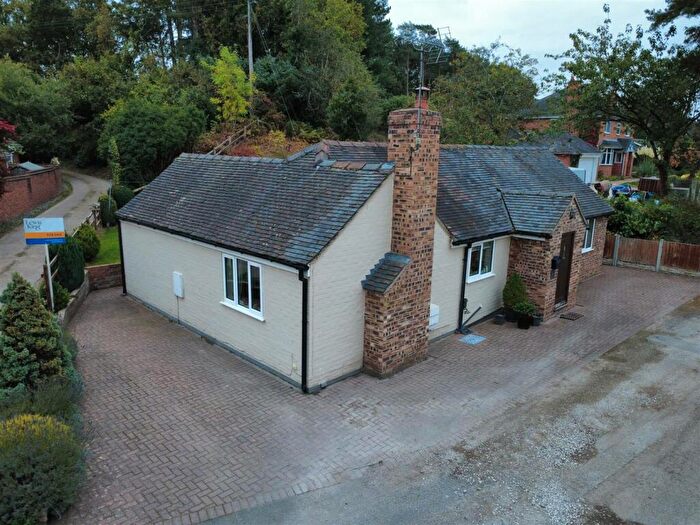
Previously listed properties in Halmerend
Roads and Postcodes in Halmerend
Navigate through our locations to find the location of your next house in Halmerend, Crewe for sale or to rent.
| Streets | Postcodes |
|---|---|
| Back Lane | CW3 9AF |
| Balterley Court | CW2 5SB |
| Balterley Green Road | CW2 5QE CW2 5QF CW2 5QQ |
| Betley Hall Gardens | CW3 9BB |
| Bowhill Lane | CW3 9AU |
| Brassington Street | CW3 9AR |
| Brassington Terrace | CW3 9BT |
| Chamberlain Court | CW3 9GB |
| Checkley Lane | CW3 9DA |
| Church Lane | CW3 9AP CW3 9AX CW3 9AY |
| Church Terrace | CW3 9AT |
| Common Lane | CW3 9AL |
| Court Walk | CW3 9DP |
| Deans Lane | CW2 5QH |
| Den Lane | CW3 9BU |
| East Lawns | CW3 9AG |
| Heighley Lane | CW3 9AZ |
| Ivydene | CW3 9BQ |
| Ladygates | CW3 9AN |
| Lakeside | CW3 9AH |
| Main Road | CW2 5QB CW3 9AA CW3 9AB CW3 9AD CW3 9AE CW3 9BH CW3 9BJ CW3 9BZ |
| New Road | CW3 9BN CW3 9BY |
| Newcastle Road | CW2 5PY CW2 5PZ |
| Old Road | CW3 9BW |
| Post Office Lane | CW2 5QD |
| Rodger Avenue | CW3 9AJ |
| St Margarets Court | CW3 9AW |
| The Butts | CW3 9AS |
| The Meadows | CW3 9GD |
| The Willows | CW3 9GE |
| CW2 5PU |
Transport near Halmerend
-
Crewe Station
-
Alsager Station
-
Kidsgrove Station
-
Longport Station
-
Nantwich Station
-
Stoke-On-Trent Station
-
Sandbach Station
-
Wrenbury Station
- FAQ
- Price Paid By Year
- Property Type Price
Frequently asked questions about Halmerend
What is the average price for a property for sale in Halmerend?
The average price for a property for sale in Halmerend is £460,939. This amount is 69% higher than the average price in Crewe. There are 108 property listings for sale in Halmerend.
What streets have the most expensive properties for sale in Halmerend?
The streets with the most expensive properties for sale in Halmerend are Deans Lane at an average of £925,000, Balterley Green Road at an average of £600,625 and Main Road at an average of £581,340.
What streets have the most affordable properties for sale in Halmerend?
The streets with the most affordable properties for sale in Halmerend are Brassington Street at an average of £190,000, East Lawns at an average of £221,750 and Brassington Terrace at an average of £277,000.
Which train stations are available in or near Halmerend?
Some of the train stations available in or near Halmerend are Crewe, Alsager and Kidsgrove.
Property Price Paid in Halmerend by Year
The average sold property price by year was:
| Year | Average Sold Price | Price Change |
Sold Properties
|
|---|---|---|---|
| 2025 | £468,441 | -8% |
9 Properties |
| 2024 | £507,704 | 16% |
11 Properties |
| 2023 | £424,568 | 1% |
16 Properties |
| 2022 | £419,289 | 2% |
8 Properties |
| 2021 | £409,225 | 1% |
16 Properties |
| 2020 | £403,250 | 32% |
14 Properties |
| 2019 | £275,269 | -40% |
13 Properties |
| 2018 | £384,353 | 2% |
15 Properties |
| 2017 | £376,985 | 14% |
17 Properties |
| 2016 | £323,055 | 7% |
18 Properties |
| 2015 | £300,600 | 12% |
10 Properties |
| 2014 | £265,770 | 0,3% |
22 Properties |
| 2013 | £264,853 | -1% |
14 Properties |
| 2012 | £267,125 | -63% |
8 Properties |
| 2011 | £434,663 | 34% |
15 Properties |
| 2010 | £285,865 | -11% |
16 Properties |
| 2009 | £316,100 | -10% |
10 Properties |
| 2008 | £348,708 | 25% |
12 Properties |
| 2007 | £262,518 | -6% |
24 Properties |
| 2006 | £278,473 | -4% |
21 Properties |
| 2005 | £289,437 | -7% |
16 Properties |
| 2004 | £310,137 | 32% |
30 Properties |
| 2003 | £211,827 | 13% |
26 Properties |
| 2002 | £184,648 | 16% |
24 Properties |
| 2001 | £155,565 | -7% |
23 Properties |
| 2000 | £166,708 | 24% |
24 Properties |
| 1999 | £127,346 | 7% |
13 Properties |
| 1998 | £118,040 | -12% |
20 Properties |
| 1997 | £132,784 | 19% |
19 Properties |
| 1996 | £107,041 | 2% |
12 Properties |
| 1995 | £105,246 | - |
13 Properties |
Property Price per Property Type in Halmerend
Here you can find historic sold price data in order to help with your property search.
The average Property Paid Price for specific property types in the last three years are:
| Property Type | Average Sold Price | Sold Properties |
|---|---|---|
| Semi Detached House | £317,025.00 | 10 Semi Detached Houses |
| Detached House | £550,916.00 | 23 Detached Houses |
| Terraced House | £250,833.00 | 3 Terraced Houses |

