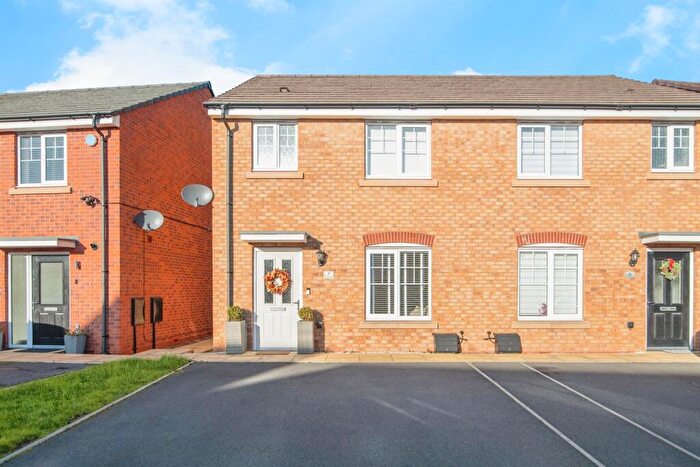
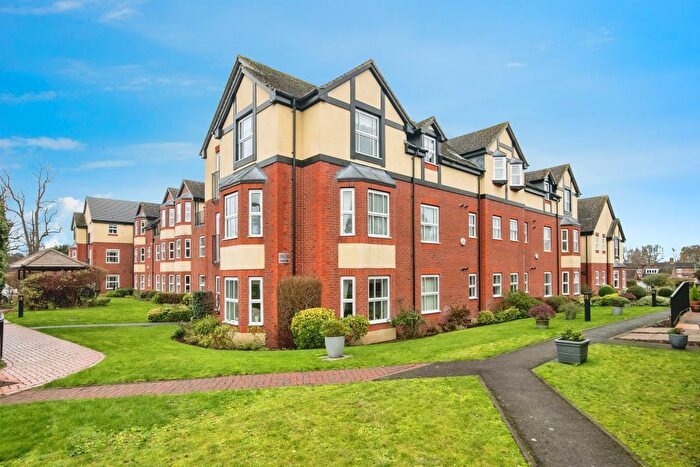
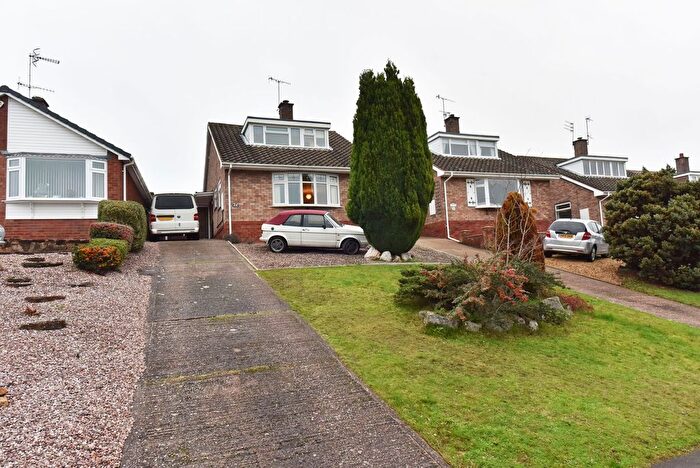
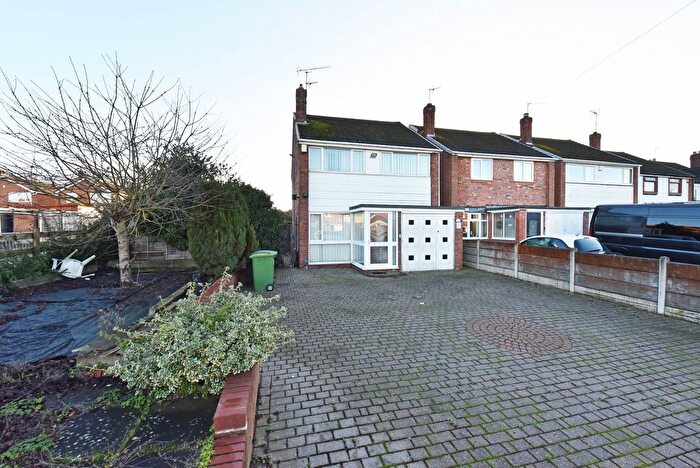
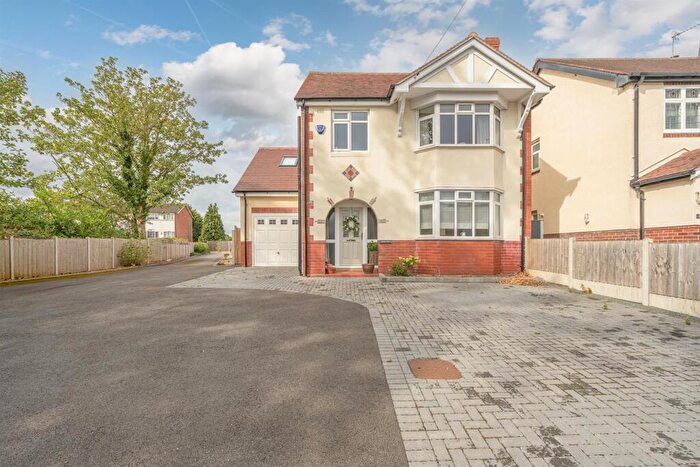
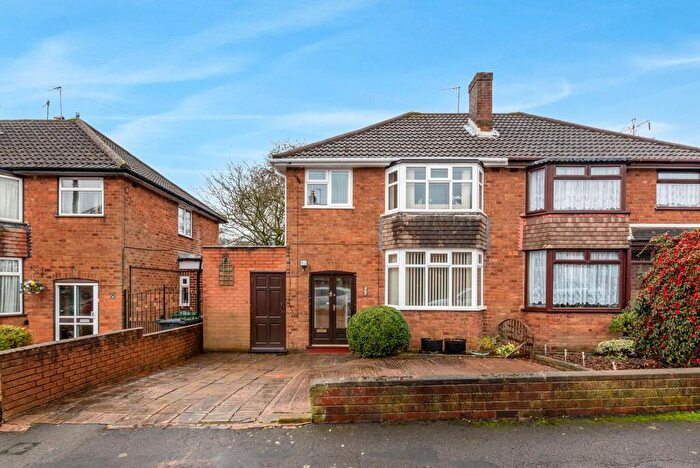
Houses for sale & to rent in Himley And Swindon, Dudley
House Prices in Himley And Swindon
Properties in Himley And Swindon have an average house price of £367,170.00 and had 124 Property Transactions within the last 3 years¹.
Himley And Swindon is an area in Dudley, Staffordshire with 709 households², where the most expensive property was sold for £1,100,000.00.
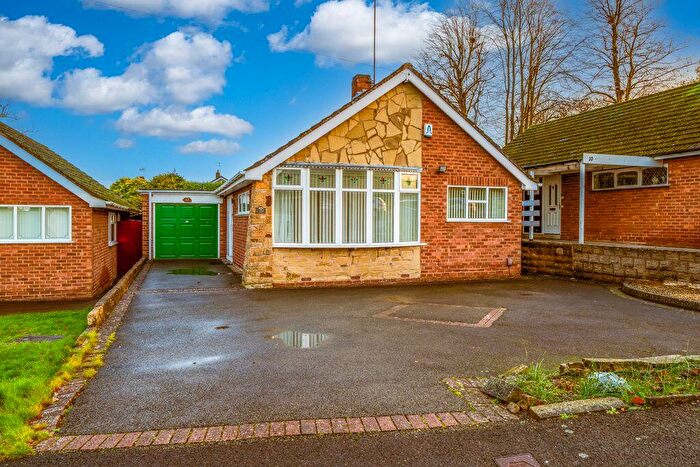
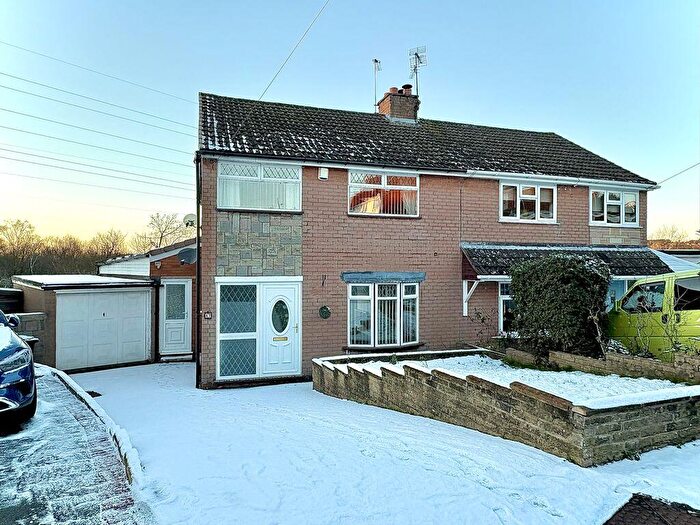
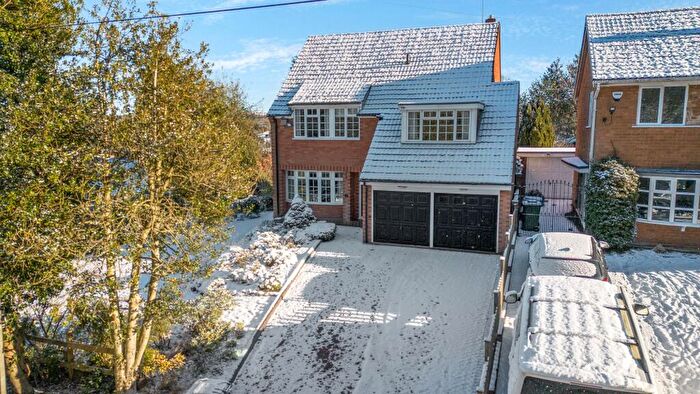
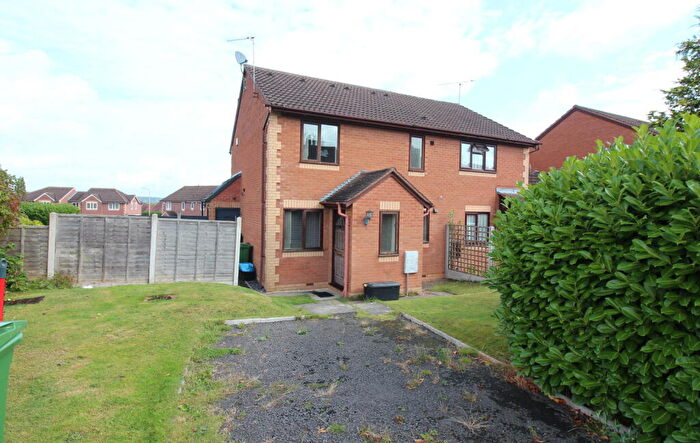
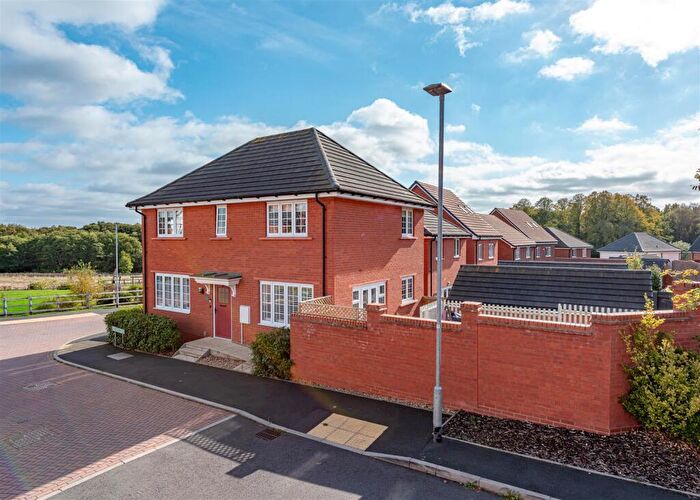
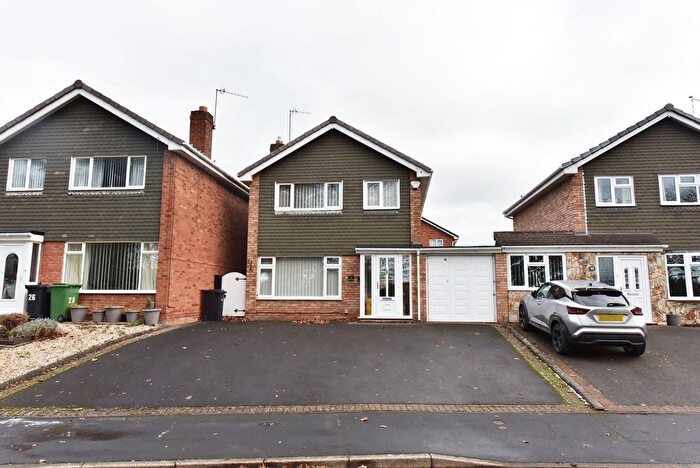
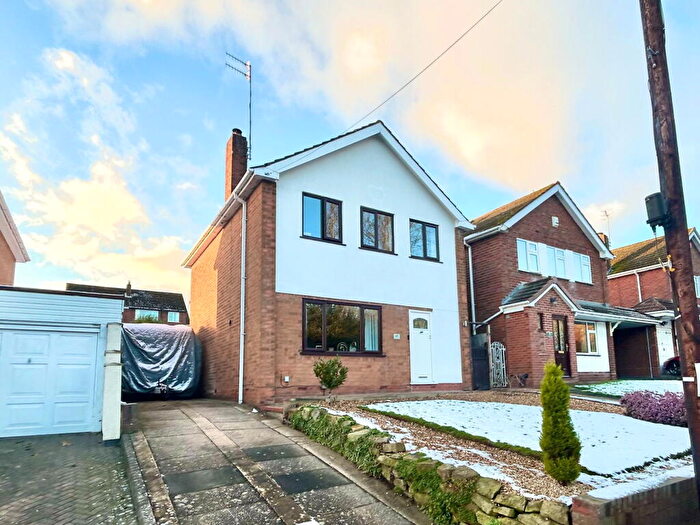
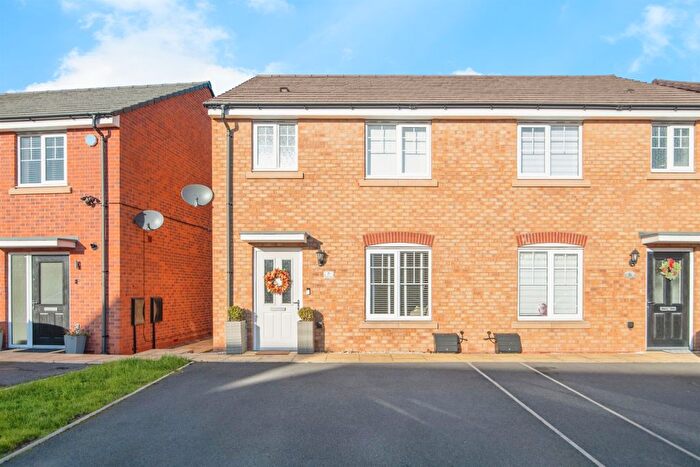
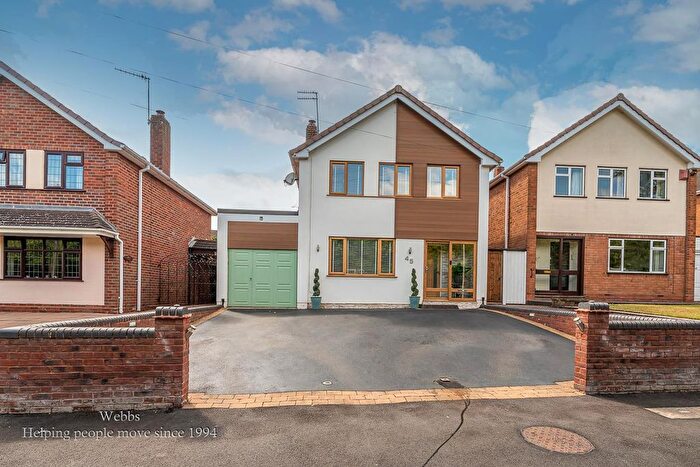
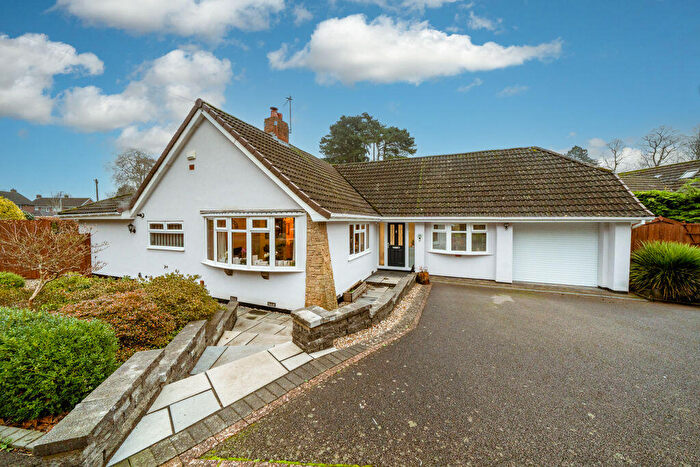
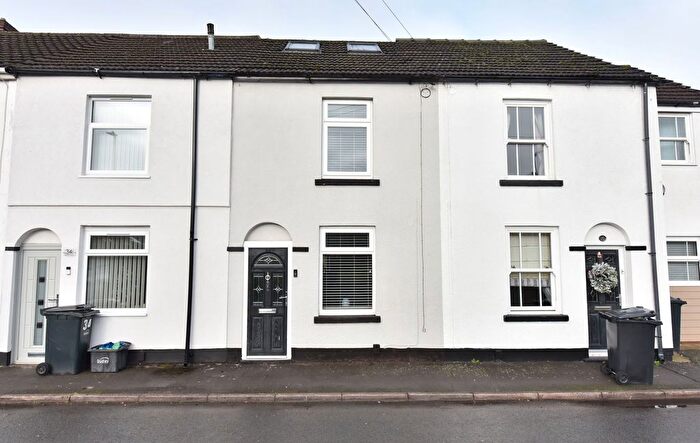
Properties for sale in Himley And Swindon
Roads and Postcodes in Himley And Swindon
Navigate through our locations to find the location of your next house in Himley And Swindon, Dudley for sale or to rent.
| Streets | Postcodes |
|---|---|
| Albert Drive | DY3 4NJ |
| Ashwood Crescent | DY3 4BH |
| Bag Pool Way | DY3 4BL |
| Baggeridge Close | DY3 4AJ |
| Baldwin Way | DY3 4PF |
| Blackhills | DY3 4PU |
| Brick Kiln Way | DY3 4BA |
| Bridgnorth Road | DY3 4LJ |
| Brooklands | DY3 4NS |
| Chalmers Road | DY3 4BJ |
| Chapel Lane | DY3 4PL |
| Chasepool Road | DY3 4PA DY3 4PB |
| Cherry Lane | DY3 4LE |
| Church Road | DY3 4PD DY3 4PG |
| Churns Hill Lane | DY3 4LX DY3 4LY |
| Crooked House Lane | DY3 4DA |
| Dudley Road | DY3 4DD DY3 4DE DY3 4LF |
| Falklands Close | DY3 4NY |
| Fir Street | DY3 4AD |
| Gilt Stock Way | DY3 4BE |
| Gospel End | DY3 4BB DY3 4HB |
| Gospel End Road | DY3 4AL DY3 4AN DY3 4HA |
| High Arcal Road | DY3 4DB |
| High Street | DY3 4NP DY3 4NR |
| Himley Lane | DY3 4LN DY3 4LP DY3 4LW DY3 4PW |
| Himley Park | DY3 4DF DY3 4LA |
| Hinksford Gardens | DY3 4NX |
| Hinksford Lane | DY3 4NU |
| Hughes Road | DY3 4BQ |
| Lickey Close | DY3 4BN |
| Lydiate Hill Road | DY3 4BG |
| Malvern Court | DY3 4BF |
| Manor Drive | DY3 4ND |
| Marl Way | DY3 4BP |
| Marsh Grove | DY3 4NL |
| Monkton Way | DY3 4BS |
| Old Parkway | DY3 4AP |
| Pastures View | DY3 4PR |
| Penn Road | DY3 4AG DY3 4AQ DY3 4AH |
| Plantation Lane | DY3 4LL |
| Reynolds Close | DY3 4NQ |
| Roadstone Drive | DY3 4AR |
| School Road | DY3 4LG |
| Smestow | DY3 4PH DY3 4PJ |
| Smestow Lane | DY3 4PN |
| St Johns Close | DY3 4PQ |
| Stanley Drive | DY3 4NH |
| Swin Forge Way | DY3 4NE |
| The Close | DY3 4NW |
| The Holloway | DY3 4NT |
| Ward Road | DY3 4BD |
| Whitehouse Lane | DY3 4PE |
| Winston Road | DY3 4NN |
| Wodehouse Lane | DY3 4AE DY3 4AF |
| Wolverhampton Road | DY3 4LB DY3 4LD |
| Wombourne Road | DY3 4NA DY3 4NB DY3 4NF |
Transport near Himley And Swindon
- FAQ
- Price Paid By Year
- Property Type Price
Frequently asked questions about Himley And Swindon
What is the average price for a property for sale in Himley And Swindon?
The average price for a property for sale in Himley And Swindon is £367,170. There are 2,919 property listings for sale in Himley And Swindon.
What streets have the most expensive properties for sale in Himley And Swindon?
The streets with the most expensive properties for sale in Himley And Swindon are Plantation Lane at an average of £795,000, Lydiate Hill Road at an average of £735,000 and Himley Lane at an average of £716,000.
What streets have the most affordable properties for sale in Himley And Swindon?
The streets with the most affordable properties for sale in Himley And Swindon are Roadstone Drive at an average of £210,361, Gospel End Road at an average of £219,500 and Churns Hill Lane at an average of £237,183.
Which train stations are available in or near Himley And Swindon?
Some of the train stations available in or near Himley And Swindon are Coseley, Tipton and Stourbridge Town.
Property Price Paid in Himley And Swindon by Year
The average sold property price by year was:
| Year | Average Sold Price | Price Change |
Sold Properties
|
|---|---|---|---|
| 2025 | £425,590 | -2% |
22 Properties |
| 2024 | £432,484 | 28% |
25 Properties |
| 2023 | £311,756 | -9% |
30 Properties |
| 2022 | £340,454 | 4% |
47 Properties |
| 2021 | £326,754 | -6% |
45 Properties |
| 2020 | £346,829 | 2% |
32 Properties |
| 2019 | £338,210 | 28% |
25 Properties |
| 2018 | £243,364 | -7% |
21 Properties |
| 2017 | £259,841 | -32% |
81 Properties |
| 2016 | £342,652 | 17% |
76 Properties |
| 2015 | £283,587 | 14% |
51 Properties |
| 2014 | £243,702 | -13% |
19 Properties |
| 2013 | £275,428 | 20% |
14 Properties |
| 2012 | £220,882 | 0,5% |
17 Properties |
| 2011 | £219,778 | -32% |
14 Properties |
| 2010 | £290,155 | 17% |
19 Properties |
| 2009 | £240,012 | -41% |
20 Properties |
| 2008 | £339,496 | 36% |
16 Properties |
| 2007 | £217,278 | -1% |
39 Properties |
| 2006 | £218,884 | -14% |
19 Properties |
| 2005 | £250,336 | 19% |
19 Properties |
| 2004 | £202,465 | 5% |
20 Properties |
| 2003 | £191,747 | 15% |
43 Properties |
| 2002 | £163,880 | 13% |
28 Properties |
| 2001 | £142,481 | -5% |
22 Properties |
| 2000 | £149,149 | 35% |
23 Properties |
| 1999 | £96,796 | -3% |
13 Properties |
| 1998 | £99,722 | 1% |
27 Properties |
| 1997 | £98,335 | 7% |
11 Properties |
| 1996 | £91,714 | -12% |
24 Properties |
| 1995 | £102,531 | - |
8 Properties |
Property Price per Property Type in Himley And Swindon
Here you can find historic sold price data in order to help with your property search.
The average Property Paid Price for specific property types in the last three years are:
| Property Type | Average Sold Price | Sold Properties |
|---|---|---|
| Semi Detached House | £282,265.00 | 26 Semi Detached Houses |
| Detached House | £522,132.00 | 53 Detached Houses |
| Terraced House | £293,046.00 | 13 Terraced Houses |
| Flat | £209,614.00 | 32 Flats |

