
Houses for sale & to rent in Leek North, Leek
House Prices in Leek North
Properties in Leek North have an average house price of £196k and had 199 Property Transactions within the last 3 years¹.
Leek North is an area in Leek, Staffordshire with 2,356 households², where the most expensive property was sold for £875k.
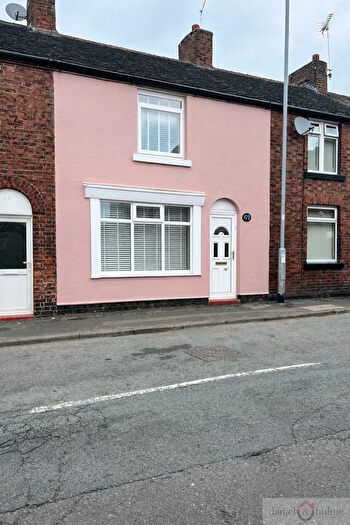
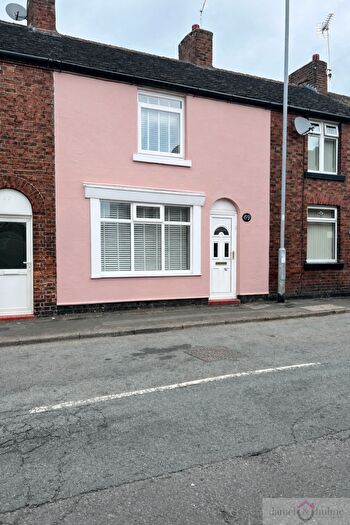
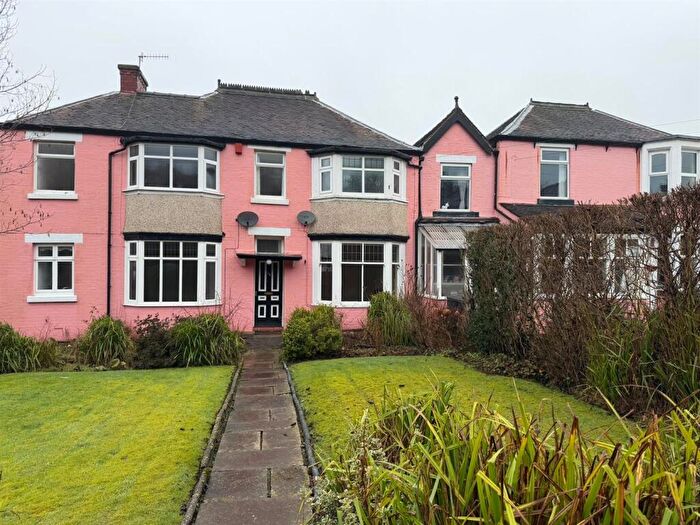
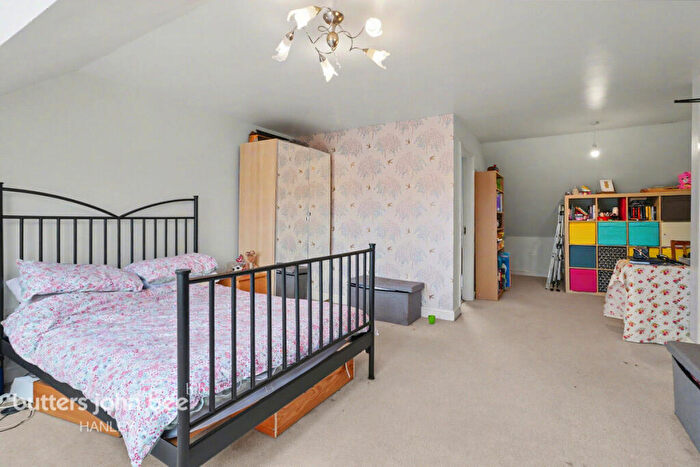
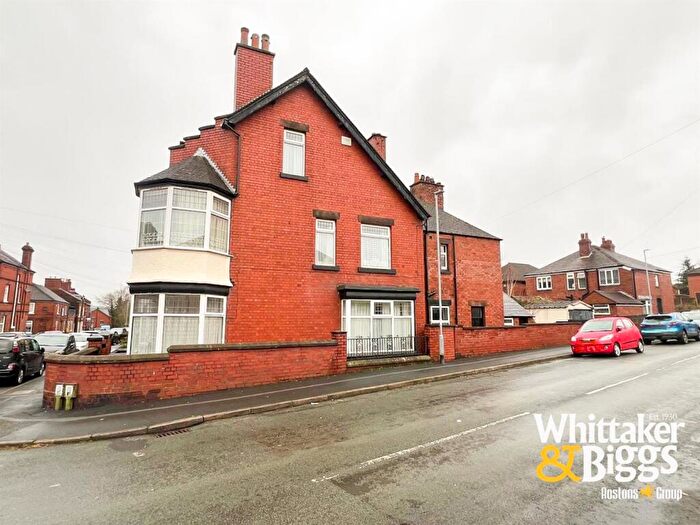
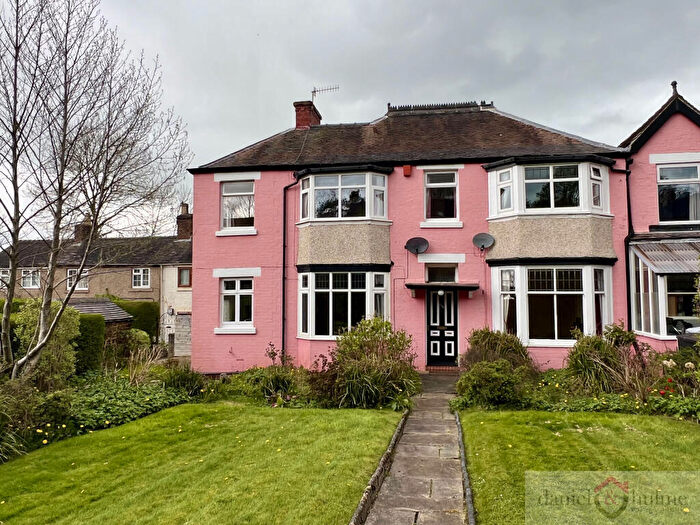
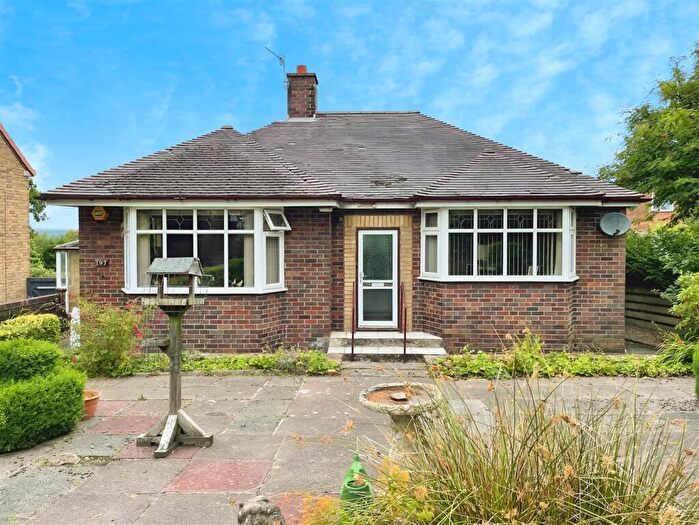
Properties for sale in Leek North
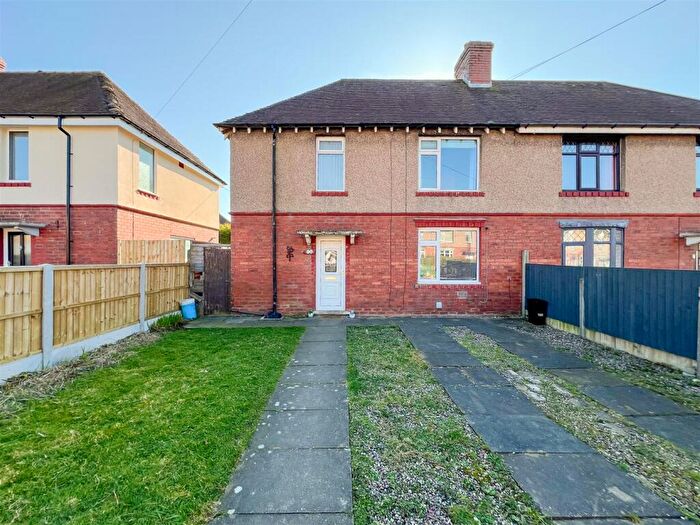

![]()
If you are looking to sell your house, let it out, or receive a property valuation, an expert can help you.
Click the button below to get started.
Roads and Postcodes in Leek North
Navigate through our locations to find the location of your next house in Leek North, Leek for sale or to rent.
Transport near Leek North

- FAQ
- Price Paid By Year
- Property Type Price
Frequently asked questions about Leek North
What is the average price for a property for sale in Leek North?
The average price for a property for sale in Leek North is £196,433. This amount is 14% lower than the average price in Leek. There are 808 property listings for sale in Leek North.
What streets have the most expensive properties for sale in Leek North?
The streets with the most expensive properties for sale in Leek North are Abbey Green Road at an average of £541,875, Deebank Heights at an average of £497,500 and Badgers Sett at an average of £363,750.
What streets have the most affordable properties for sale in Leek North?
The streets with the most affordable properties for sale in Leek North are Mill Street at an average of £88,000, Pump Street at an average of £91,666 and Queens Drive at an average of £101,650.
Which train stations are available in or near Leek North?
Some of the train stations available in or near Leek North are Congleton, Longport and Kidsgrove.
Property Price Paid in Leek North by Year
The average sold property price by year was:
| Year | Average Sold Price | Price Change |
Sold Properties
|
|---|---|---|---|
| 2025 | £196,789 | -1% |
55 Properties |
| 2024 | £198,868 | 2% |
69 Properties |
| 2023 | £193,933 | 9% |
75 Properties |
| 2022 | £175,624 | 10% |
69 Properties |
| 2021 | £158,121 | -4% |
91 Properties |
| 2020 | £164,573 | 5% |
69 Properties |
| 2019 | £156,354 | 15% |
88 Properties |
| 2018 | £132,747 | 4% |
74 Properties |
| 2017 | £126,795 | -4% |
76 Properties |
| 2016 | £132,448 | 8% |
76 Properties |
| 2015 | £121,445 | 2% |
84 Properties |
| 2014 | £119,498 | 12% |
85 Properties |
| 2013 | £105,476 | -13% |
56 Properties |
| 2012 | £119,178 | 3% |
52 Properties |
| 2011 | £115,625 | -3% |
46 Properties |
| 2010 | £118,978 | 12% |
46 Properties |
| 2009 | £104,157 | -39% |
64 Properties |
| 2008 | £145,144 | 4% |
45 Properties |
| 2007 | £139,927 | 13% |
104 Properties |
| 2006 | £122,030 | 8% |
89 Properties |
| 2005 | £112,063 | 8% |
79 Properties |
| 2004 | £103,330 | 23% |
76 Properties |
| 2003 | £79,894 | 17% |
106 Properties |
| 2002 | £66,171 | 20% |
109 Properties |
| 2001 | £52,644 | 7% |
82 Properties |
| 2000 | £49,009 | 7% |
93 Properties |
| 1999 | £45,699 | 13% |
77 Properties |
| 1998 | £39,652 | -14% |
75 Properties |
| 1997 | £45,258 | 4% |
75 Properties |
| 1996 | £43,353 | 12% |
65 Properties |
| 1995 | £38,219 | - |
61 Properties |
Property Price per Property Type in Leek North
Here you can find historic sold price data in order to help with your property search.
The average Property Paid Price for specific property types in the last three years are:
| Property Type | Average Sold Price | Sold Properties |
|---|---|---|
| Flat | £95,151.00 | 17 Flats |
| Semi Detached House | £187,800.00 | 76 Semi Detached Houses |
| Detached House | £375,574.00 | 33 Detached Houses |
| Terraced House | £148,026.00 | 73 Terraced Houses |