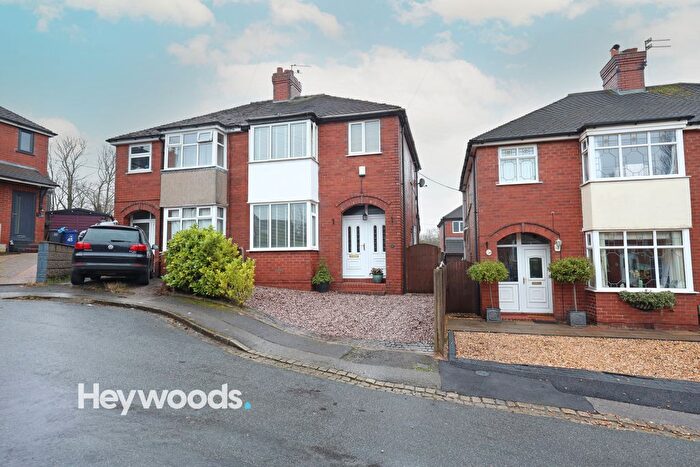
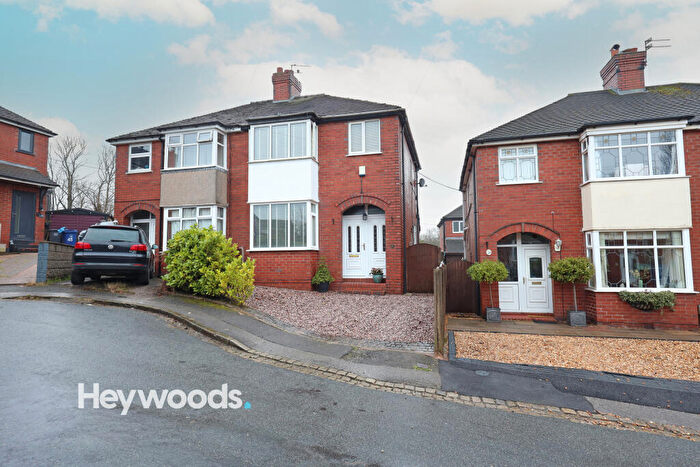
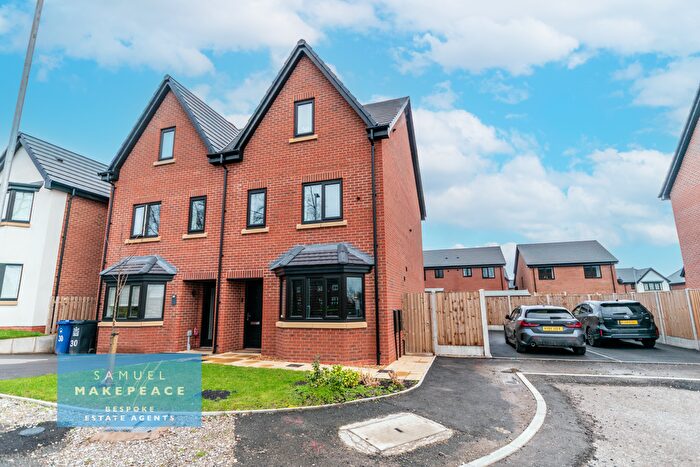
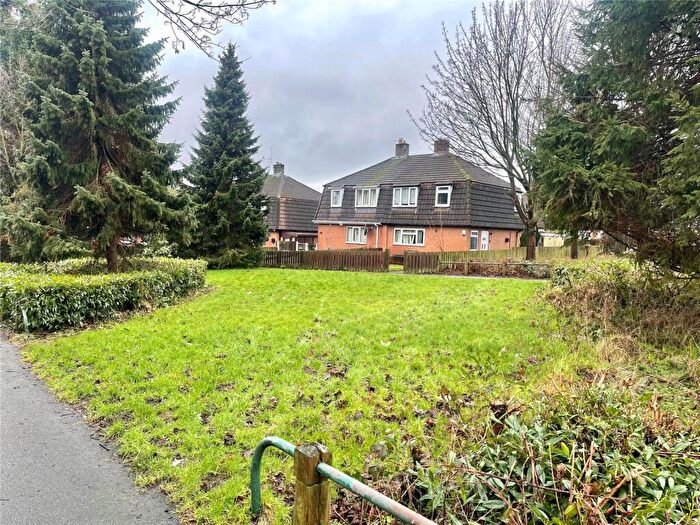
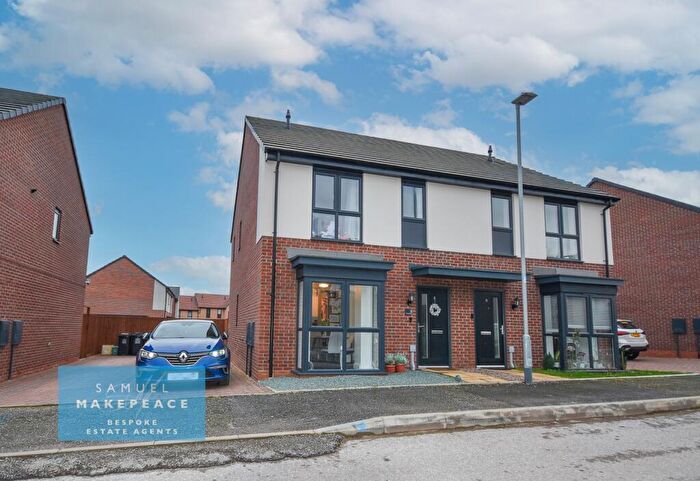
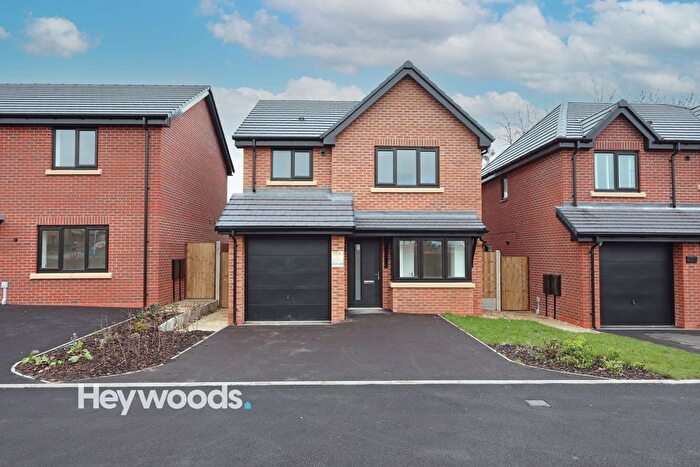
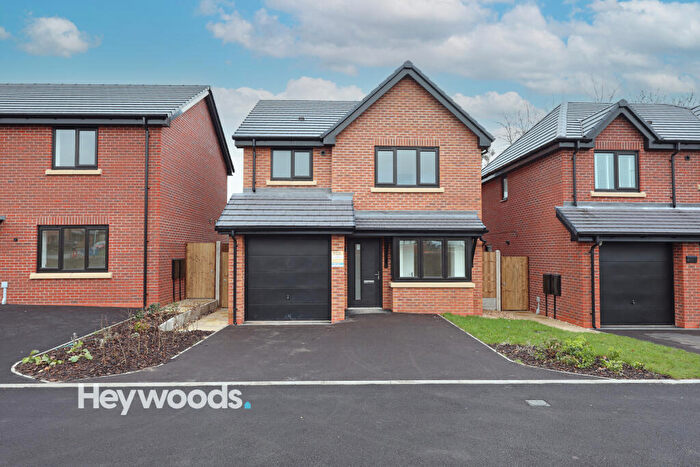
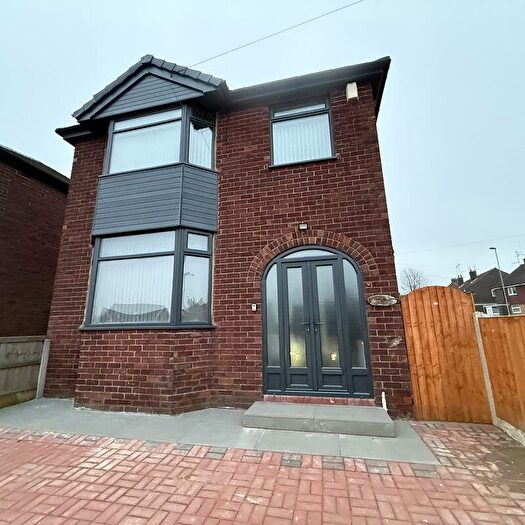
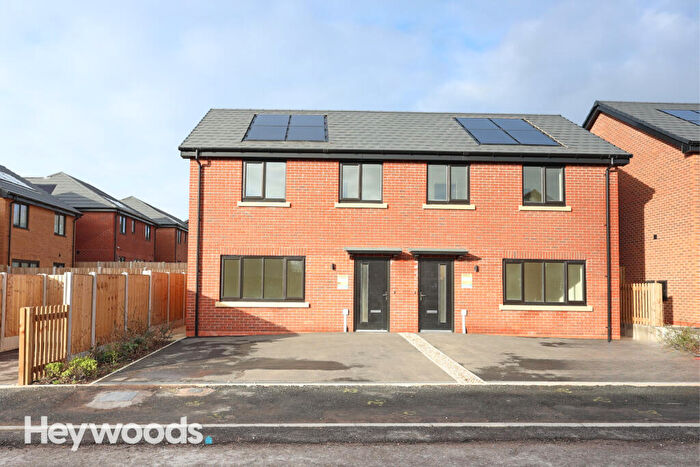
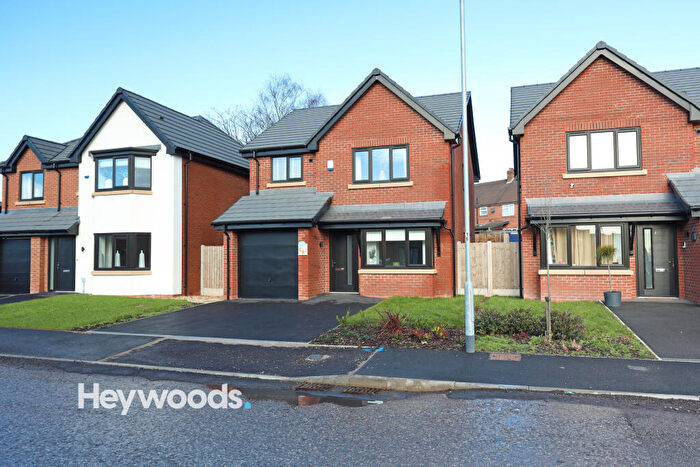
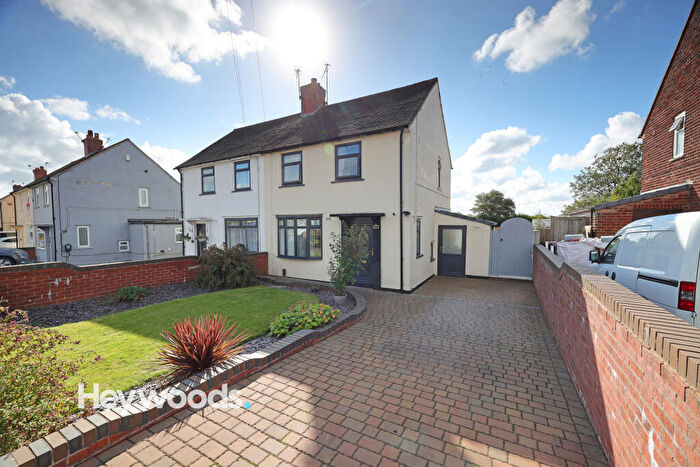
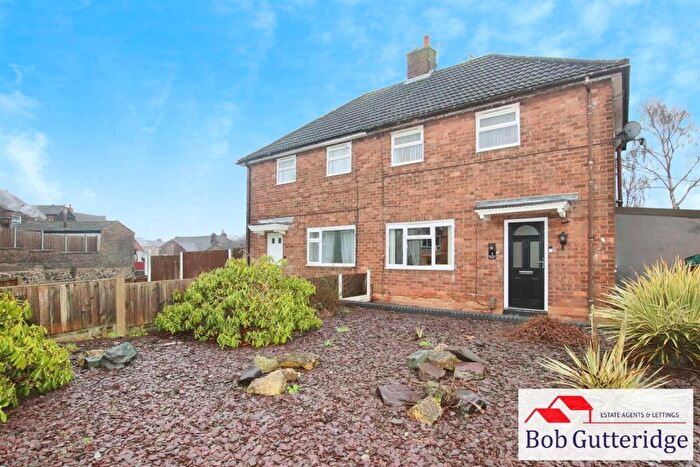
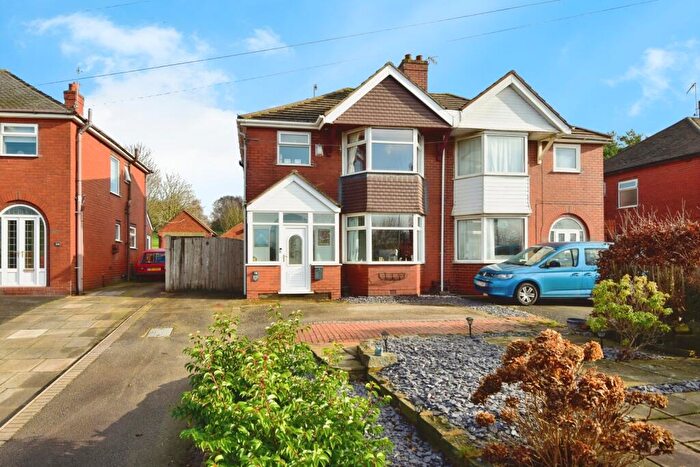
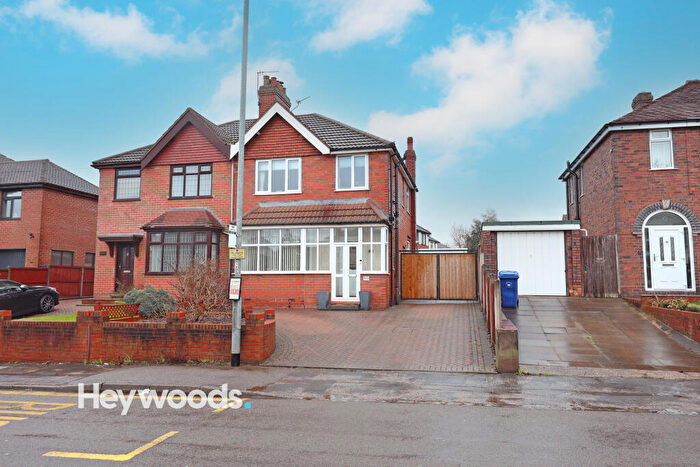
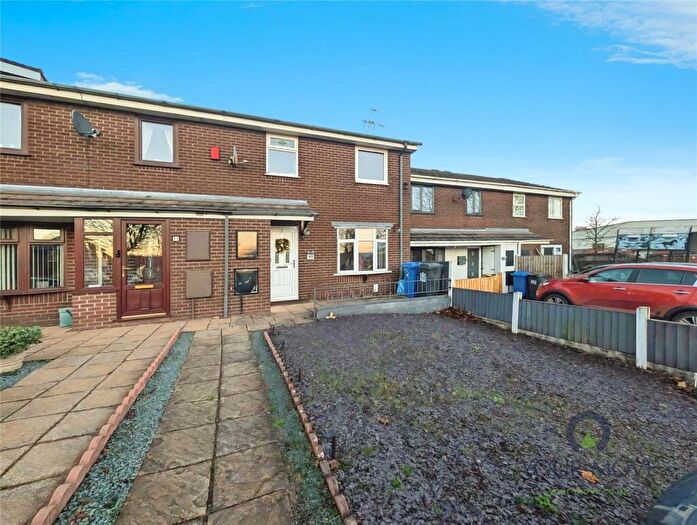
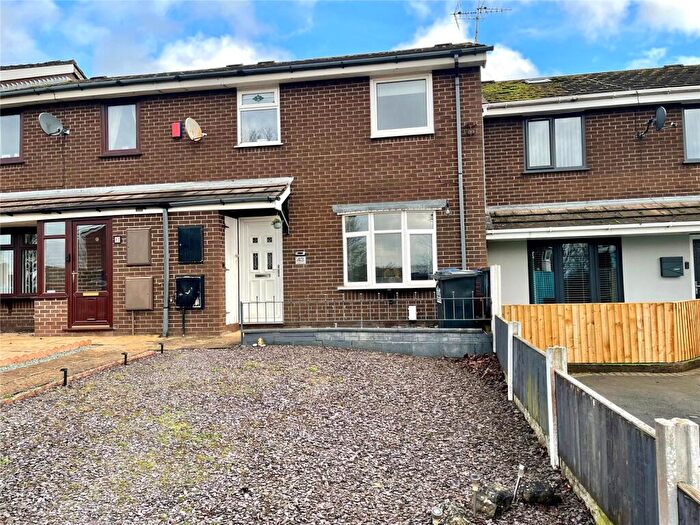
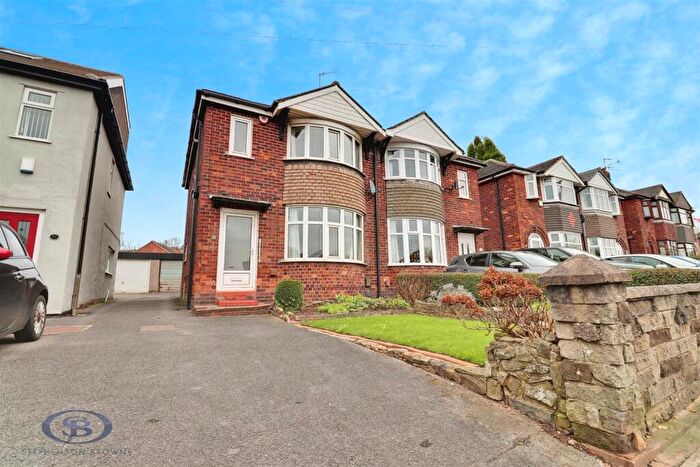
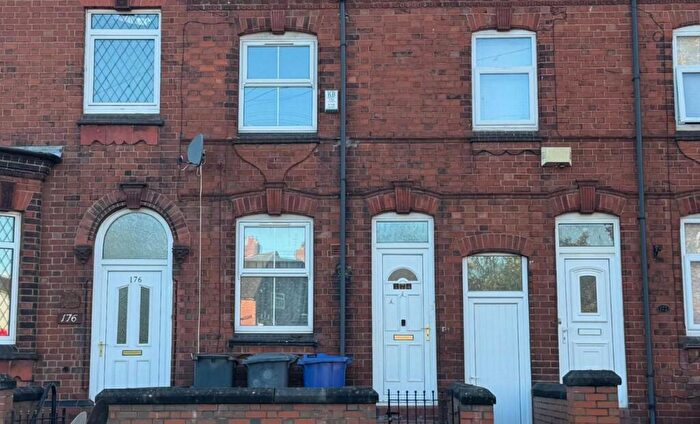
Houses for sale & to rent in Holditch, Newcastle
House Prices in Holditch
Properties in Holditch have an average house price of £140,399.00 and had 149 Property Transactions within the last 3 years¹.
Holditch is an area in Newcastle, Staffordshire with 1,830 households², where the most expensive property was sold for £328,000.00.
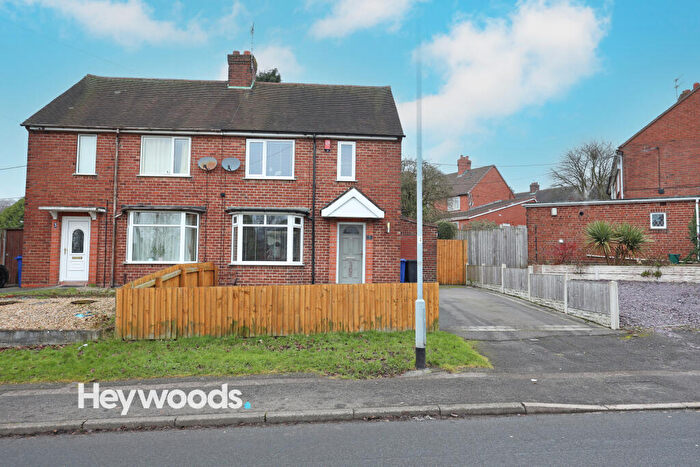
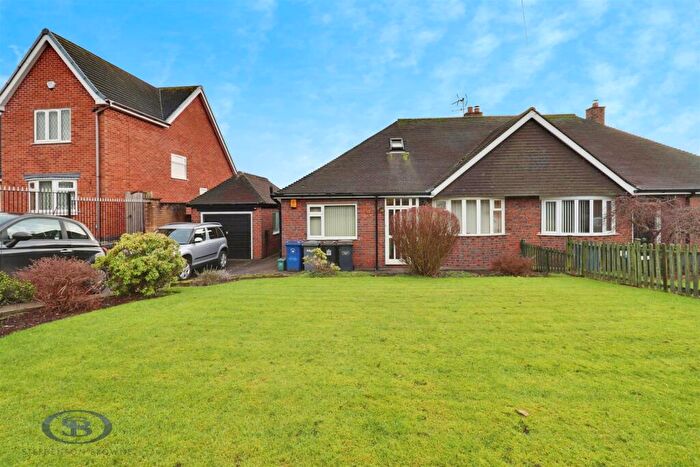
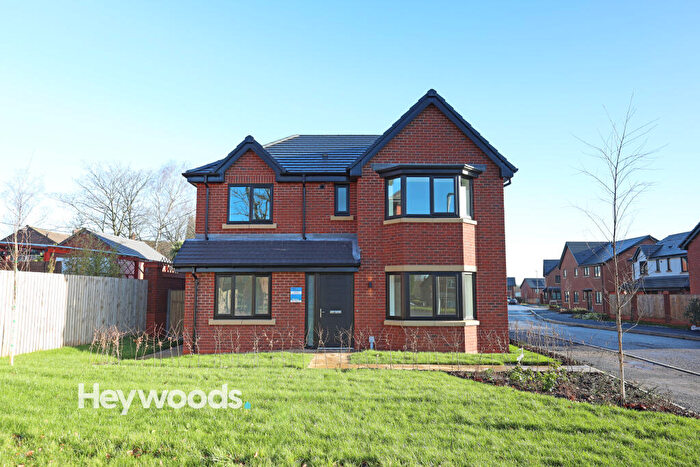
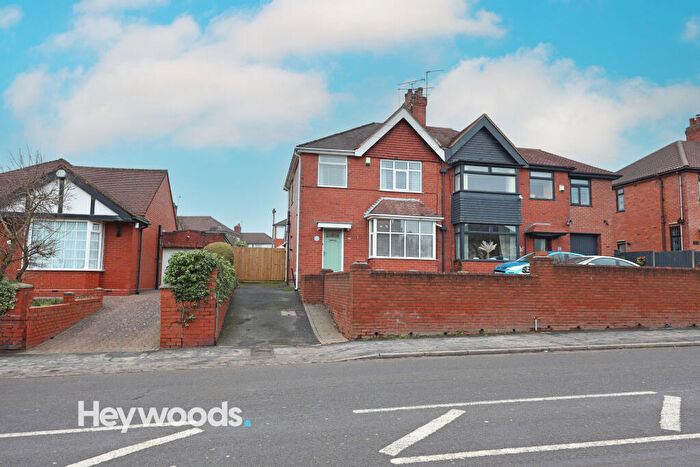
Properties for sale in Holditch
Roads and Postcodes in Holditch
Navigate through our locations to find the location of your next house in Holditch, Newcastle for sale or to rent.
| Streets | Postcodes |
|---|---|
| Albert Street | ST5 7JF |
| Apedale Road | ST5 6BH |
| Bamber Place | ST5 7PG |
| Beasley Avenue | ST5 7NN ST5 7PE ST5 7RW |
| Booth Street | ST5 7PU ST5 7PX |
| Brittain Avenue | ST5 7NT ST5 7NU |
| Brutus Road | ST5 7QE |
| Castle Street | ST5 7JJ ST5 7LP ST5 7LW |
| Chatsworth Place | ST5 7NR |
| Constable Avenue | ST5 7LD |
| Cooper Street | ST5 7LN |
| Croftstead Close | ST5 7NE |
| Emberton Street | ST5 7LJ |
| Farcroft Avenue | ST5 7NA |
| Forum Road | ST5 7QA |
| Gainsborough Road | ST5 7LF ST5 7LG |
| Hadrian Way | ST5 7QZ |
| Heath Street | ST5 7ND ST5 7PY |
| Hodgkinson Street | ST5 7HX |
| Hogarth Place | ST5 7JW |
| Horatius Road | ST5 7QG |
| Landseer Place | ST5 7LE |
| Leech Avenue | ST5 7PN ST5 7PP |
| London Road | ST5 7HT ST5 7HZ ST5 7JB ST5 7JD ST5 7JE ST5 7PS ST5 7PT |
| Loomer Road | ST5 7JS ST5 7JT ST5 7LB |
| Mount Pleasant | ST5 7LH ST5 7LQ |
| Palatine Drive | ST5 7QY |
| Park Court | ST5 7RS |
| Plymouth Grove | ST5 7NW |
| Reynolds Avenue | ST5 7JL |
| Roman Drive | ST5 7QB |
| Romney Avenue | ST5 7JN ST5 7JP ST5 7JR |
| Rosendale Avenue | ST5 7NG |
| Rowley Avenue | ST5 7NP ST5 7NX ST5 7NY |
| School Street | ST5 7HY |
| Sheldon Grove | ST5 7PW |
| Springfield Close | ST5 7LY |
| Sutton Street | ST5 7JH |
| Talke Road | ST5 7NH ST5 7NL ST5 7NQ |
| Taunton Place | ST5 7PA |
| Tenby Grove | ST5 7NZ |
| Tiber Drive | ST5 7QD |
| Tintern Place | ST5 7NS |
| Tuscan Way | ST5 7LL |
| Walton Place | ST5 7PR |
| Warwick Street | ST5 7JQ |
| Willard Close | ST5 7NB |
| Wolstanton Road | ST5 7LX ST5 7NF |
| Woodcastle Crescent | ST5 7GB |
| Wright Avenue | ST5 7PB |
Transport near Holditch
- FAQ
- Price Paid By Year
- Property Type Price
Frequently asked questions about Holditch
What is the average price for a property for sale in Holditch?
The average price for a property for sale in Holditch is £140,399. This amount is 30% lower than the average price in Newcastle. There are 416 property listings for sale in Holditch.
What streets have the most expensive properties for sale in Holditch?
The streets with the most expensive properties for sale in Holditch are Willard Close at an average of £254,333, Sheldon Grove at an average of £196,500 and Forum Road at an average of £190,000.
What streets have the most affordable properties for sale in Holditch?
The streets with the most affordable properties for sale in Holditch are Cooper Street at an average of £78,833, Landseer Place at an average of £87,000 and Apedale Road at an average of £99,750.
Which train stations are available in or near Holditch?
Some of the train stations available in or near Holditch are Longport, Kidsgrove and Stoke-On-Trent.
Property Price Paid in Holditch by Year
The average sold property price by year was:
| Year | Average Sold Price | Price Change |
Sold Properties
|
|---|---|---|---|
| 2025 | £143,751 | 1% |
33 Properties |
| 2024 | £142,240 | 4% |
53 Properties |
| 2023 | £137,095 | -1% |
63 Properties |
| 2022 | £138,909 | 7% |
55 Properties |
| 2021 | £129,434 | 10% |
77 Properties |
| 2020 | £115,849 | 9% |
53 Properties |
| 2019 | £105,055 | 2% |
50 Properties |
| 2018 | £103,044 | 1% |
47 Properties |
| 2017 | £102,405 | 10% |
68 Properties |
| 2016 | £92,642 | 6% |
68 Properties |
| 2015 | £87,139 | -1% |
50 Properties |
| 2014 | £88,157 | 9% |
60 Properties |
| 2013 | £80,224 | -16% |
34 Properties |
| 2012 | £93,305 | -3% |
35 Properties |
| 2011 | £96,239 | -9% |
32 Properties |
| 2010 | £104,922 | 10% |
28 Properties |
| 2009 | £94,845 | -6% |
35 Properties |
| 2008 | £100,740 | -5% |
35 Properties |
| 2007 | £106,137 | 12% |
99 Properties |
| 2006 | £93,242 | 11% |
101 Properties |
| 2005 | £83,112 | 12% |
75 Properties |
| 2004 | £72,923 | 23% |
90 Properties |
| 2003 | £56,455 | 25% |
69 Properties |
| 2002 | £42,128 | 19% |
104 Properties |
| 2001 | £34,205 | -8% |
68 Properties |
| 2000 | £37,034 | 15% |
57 Properties |
| 1999 | £31,525 | 5% |
49 Properties |
| 1998 | £30,073 | -2% |
50 Properties |
| 1997 | £30,568 | -12% |
57 Properties |
| 1996 | £34,189 | 8% |
47 Properties |
| 1995 | £31,504 | - |
61 Properties |
Property Price per Property Type in Holditch
Here you can find historic sold price data in order to help with your property search.
The average Property Paid Price for specific property types in the last three years are:
| Property Type | Average Sold Price | Sold Properties |
|---|---|---|
| Semi Detached House | £150,861.00 | 69 Semi Detached Houses |
| Detached House | £192,916.00 | 12 Detached Houses |
| Terraced House | £122,694.00 | 65 Terraced Houses |
| Flat | £73,316.00 | 3 Flats |

