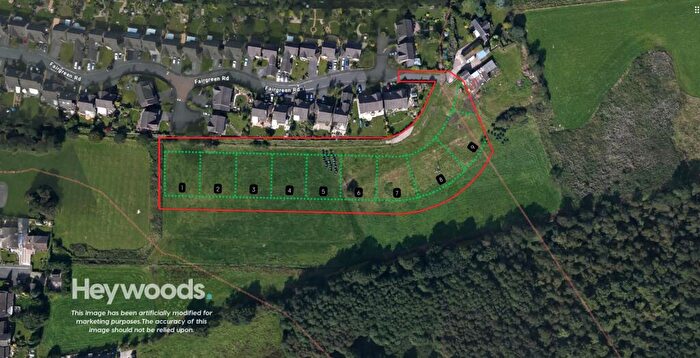
Houses for sale & to rent in Loggerheads And Whitmore, Newcastle
House Prices in Loggerheads And Whitmore
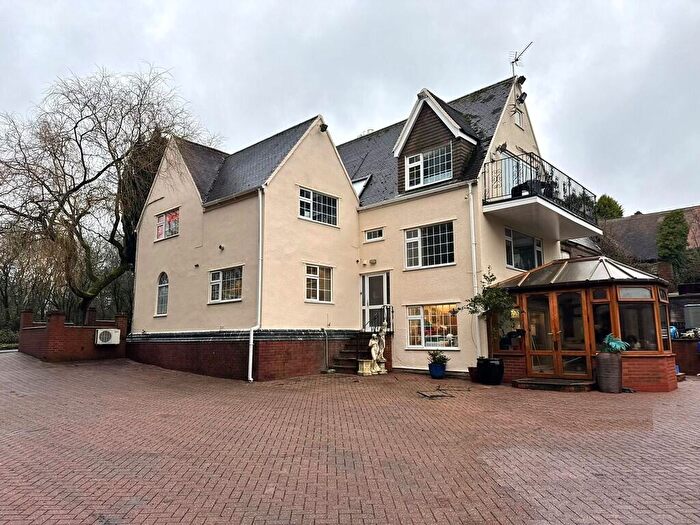
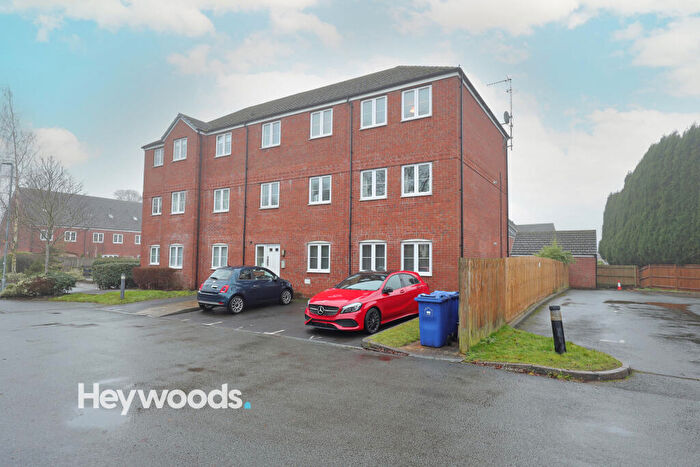
Properties in Loggerheads And Whitmore have an average house price of £449,147.00 and had 53 Property Transactions within the last 3 years¹.
Loggerheads And Whitmore is an area in Newcastle, Staffordshire with 834 households², where the most expensive property was sold for £1,900,000.00.
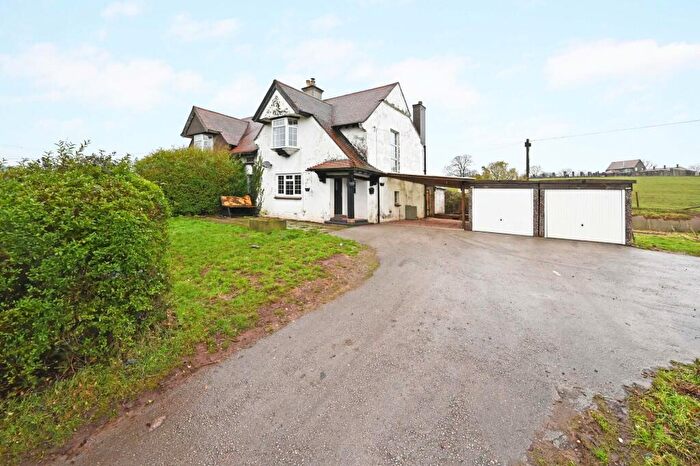
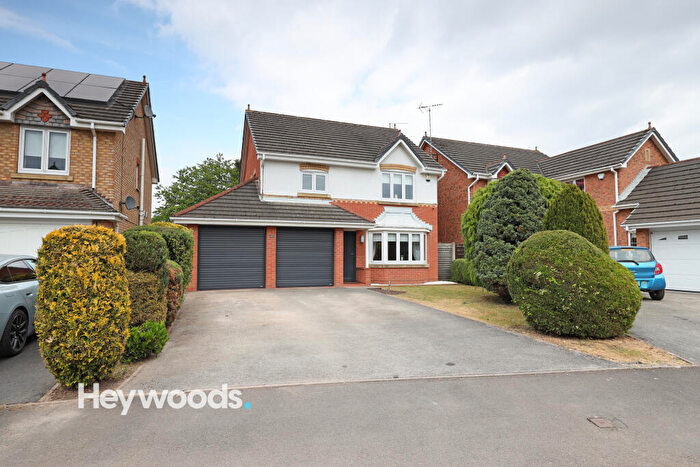
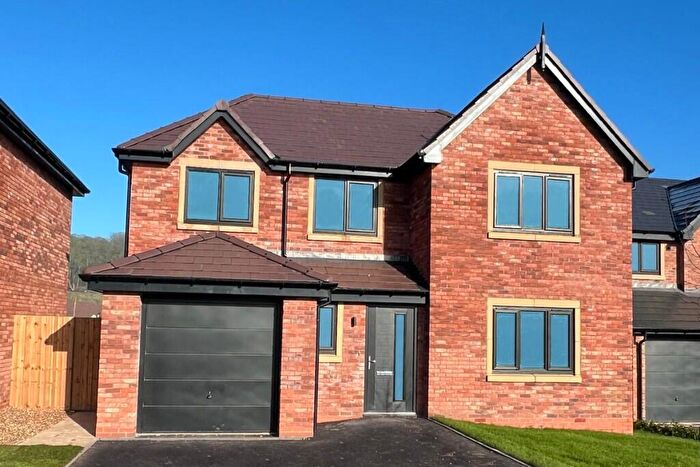
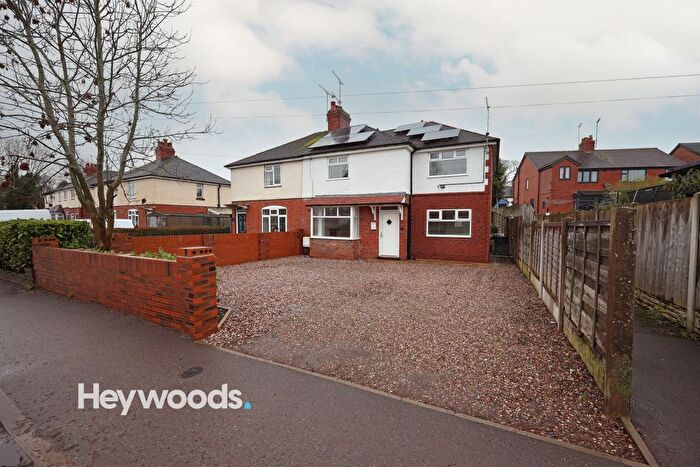
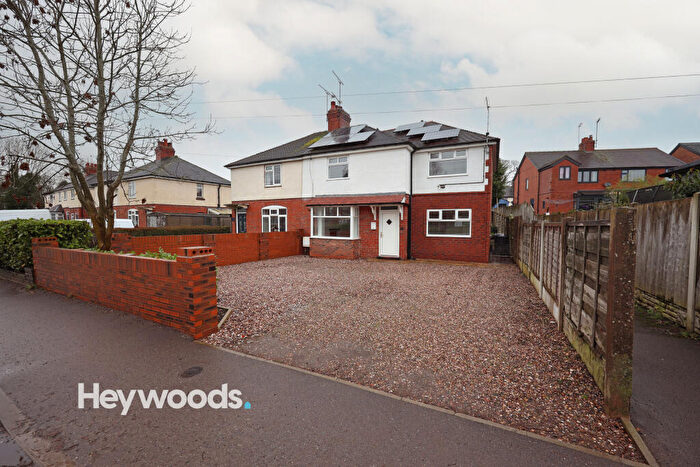
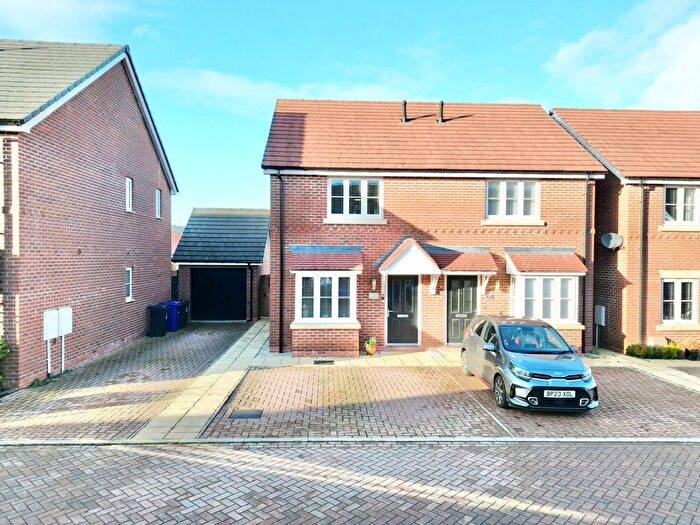
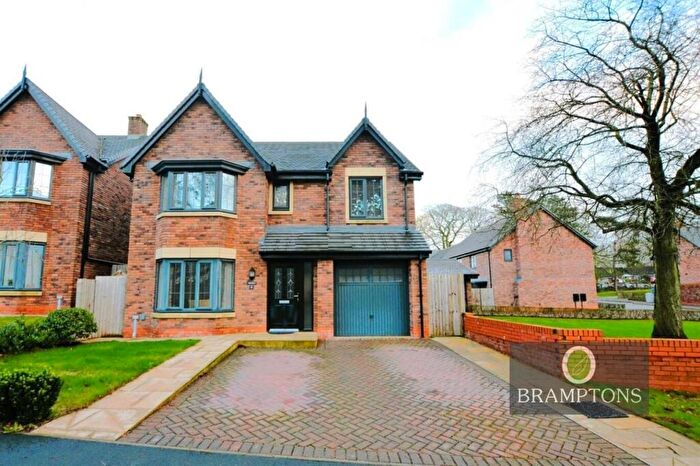
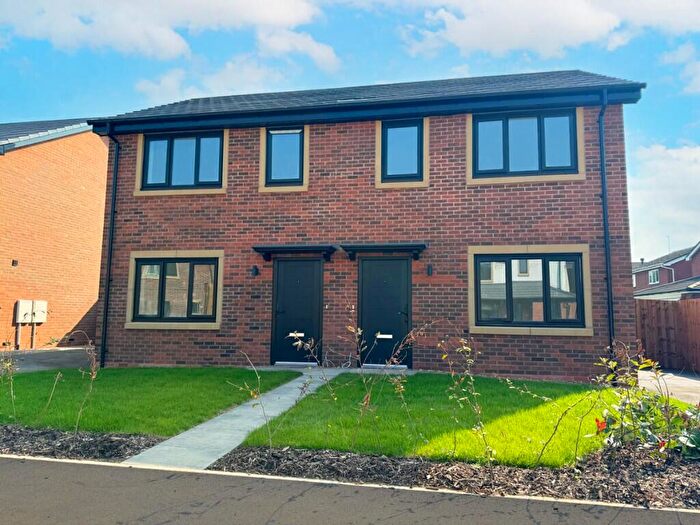
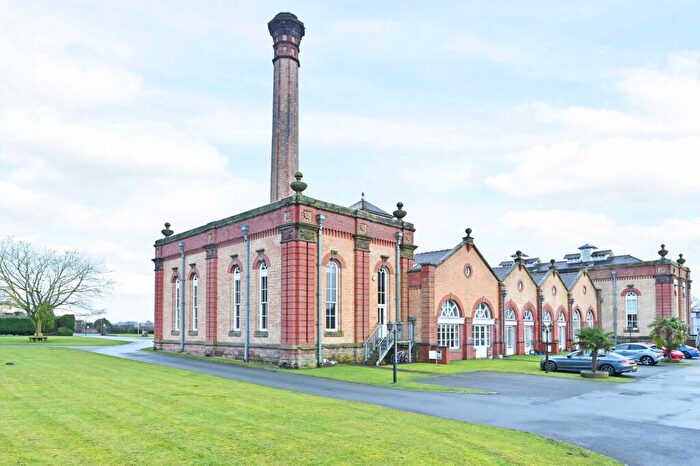
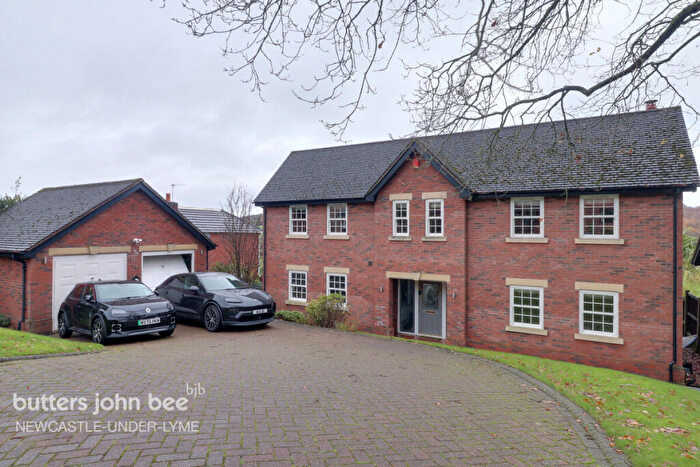
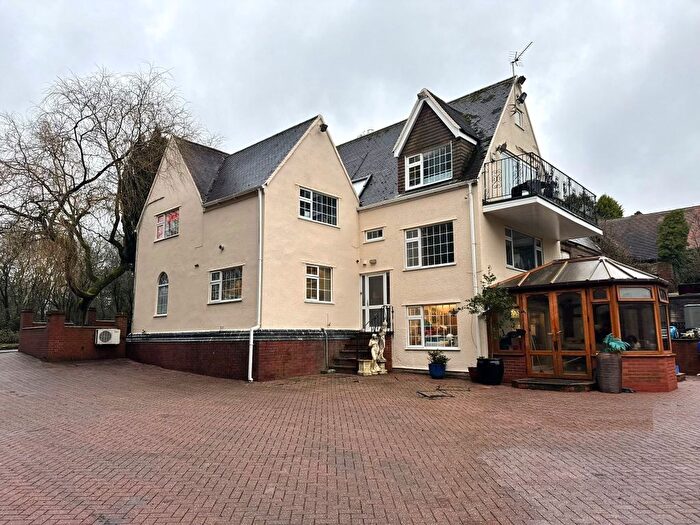
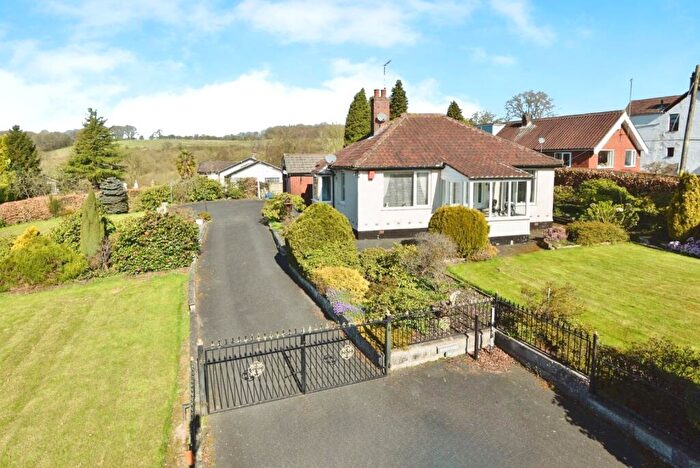
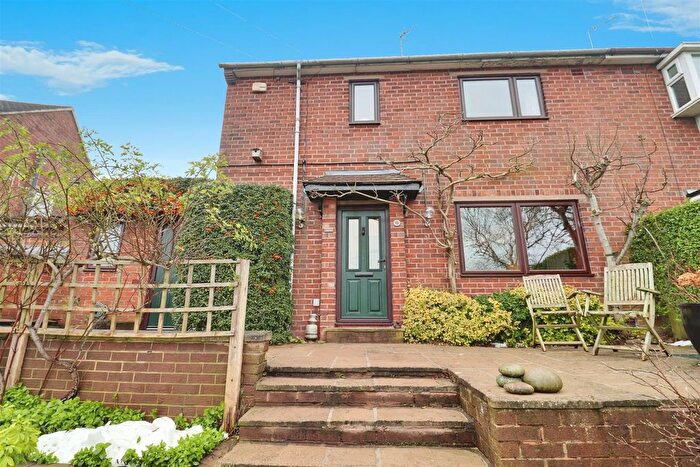
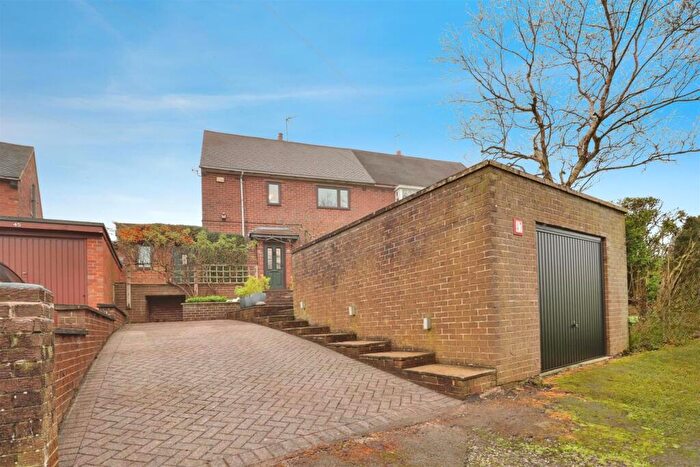
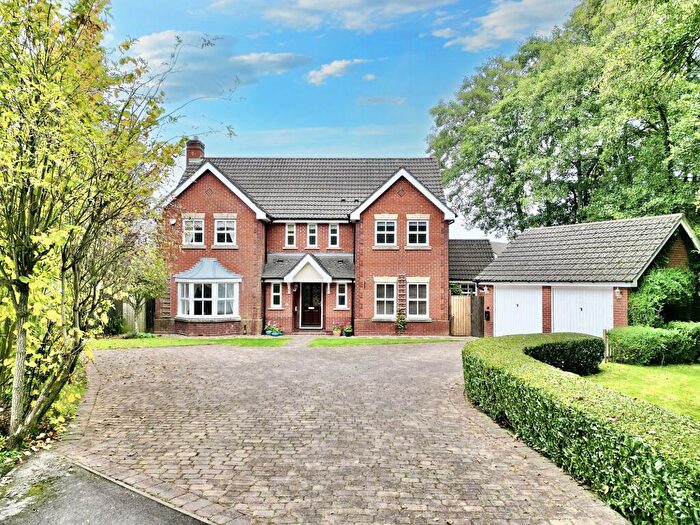
Properties for sale in Loggerheads And Whitmore
Roads and Postcodes in Loggerheads And Whitmore
Navigate through our locations to find the location of your next house in Loggerheads And Whitmore, Newcastle for sale or to rent.
| Streets | Postcodes |
|---|---|
| Acton Lane | ST5 4DW |
| Appleton Drive | ST5 5BT |
| Baldwins Gate | ST5 5DA ST5 5ES |
| Birch Tree Lane | ST5 5HE |
| Butterton Lane | ST5 4ED |
| Chorlton Moss | ST5 5DS |
| Common Lane | ST5 5HF |
| Coney Greave Lane | ST5 5HX |
| Dale Close | ST5 5DN |
| Eastwood Rise | ST5 5EX |
| Fair Green Road | ST5 5LS |
| Fairview Villas | ST5 5DB |
| Field Close | ST5 5DJ |
| Gateway Avenue | ST5 5DD |
| Haddon Lane | ST5 5JL |
| Heath Road | ST5 5HB |
| Heronpool Drive | ST5 5LJ |
| Hillview Crescent | ST5 5DE |
| Lakeside Close | ST5 5LH |
| Lea Close | ST5 5DH |
| Maer Heath | ST5 5EW |
| Maer Mews | ST5 5EE |
| Maerway Lane | ST5 5EN |
| Manor Glade | ST5 5EZ |
| Manor Road | ST5 5ET |
| Meadow Way | ST5 5DG |
| Moss Lane | ST5 5DL ST5 5EQ |
| Nantwich Road | ST5 5EH |
| Newcastle Road | ST5 5BU |
| Nursery Gardens | ST5 4GB |
| Park Road | ST5 4DZ |
| Parkwood Drive | ST5 5EU |
| Pasture Close | ST5 5DQ |
| Sandy Lane | ST5 5DP |
| Sandyfields | ST5 5DW |
| Shut Lane Head | ST5 4DS |
| Snape Hall Close | ST5 5HD |
| Snape Hall Road | ST5 5HS |
| Southwood | ST5 5EY |
| Stableford Court | ST5 5JH |
| Station Cottages | ST5 5BY |
| Stone Road | ST5 5DR ST5 5ED |
| Swanholme Way | ST5 5LN |
| Teal Close | ST5 5LL |
| The Croft | ST5 5EL |
| Three Mile Lane | ST5 5HW |
| Tollgate Avenue | ST5 5DF |
| Trentham Road | ST5 4DY |
| Walls Wood | ST5 5LD |
| Whitmore | ST5 5JE |
| Whitmore Heath | ST5 5JA |
| Whitmore Road | ST5 4DT |
| Wildfowl Walk | ST5 5LW |
| Wood Lane | ST5 5EJ |
| Woodside Villas | ST5 5EB |
| ST5 4DU ST5 4EB ST5 4EF ST5 4EG ST5 4EQ ST5 5EF ST5 5HR ST5 5JF ST5 5JG ST5 5JN ST5 5JQ |
Transport near Loggerheads And Whitmore
-
Stoke-On-Trent Station
-
Longport Station
-
Stone Station
-
Longton Station
-
Kidsgrove Station
-
Alsager Station
-
Blythe Bridge Station
- FAQ
- Price Paid By Year
- Property Type Price
Frequently asked questions about Loggerheads And Whitmore
What is the average price for a property for sale in Loggerheads And Whitmore?
The average price for a property for sale in Loggerheads And Whitmore is £449,147. This amount is 123% higher than the average price in Newcastle. There are 894 property listings for sale in Loggerheads And Whitmore.
What streets have the most expensive properties for sale in Loggerheads And Whitmore?
The streets with the most expensive properties for sale in Loggerheads And Whitmore are Manor Road at an average of £697,050, Snape Hall Road at an average of £628,750 and Southwood at an average of £619,833.
What streets have the most affordable properties for sale in Loggerheads And Whitmore?
The streets with the most affordable properties for sale in Loggerheads And Whitmore are The Croft at an average of £233,750, Hillview Crescent at an average of £273,333 and Stableford Court at an average of £300,250.
Which train stations are available in or near Loggerheads And Whitmore?
Some of the train stations available in or near Loggerheads And Whitmore are Stoke-On-Trent, Longport and Stone.
Property Price Paid in Loggerheads And Whitmore by Year
The average sold property price by year was:
| Year | Average Sold Price | Price Change |
Sold Properties
|
|---|---|---|---|
| 2025 | £407,230 | -35% |
13 Properties |
| 2024 | £548,452 | 28% |
18 Properties |
| 2023 | £392,665 | -30% |
22 Properties |
| 2022 | £509,082 | 13% |
32 Properties |
| 2021 | £441,486 | 2% |
38 Properties |
| 2020 | £433,928 | -9% |
28 Properties |
| 2019 | £471,342 | 19% |
35 Properties |
| 2018 | £380,228 | 3% |
38 Properties |
| 2017 | £368,228 | -1% |
35 Properties |
| 2016 | £370,130 | -13% |
38 Properties |
| 2015 | £417,910 | 29% |
33 Properties |
| 2014 | £297,352 | 12% |
36 Properties |
| 2013 | £260,832 | -17% |
25 Properties |
| 2012 | £304,000 | -9% |
23 Properties |
| 2011 | £332,410 | -8% |
23 Properties |
| 2010 | £358,945 | 22% |
26 Properties |
| 2009 | £279,039 | -49% |
24 Properties |
| 2008 | £415,912 | 15% |
14 Properties |
| 2007 | £352,014 | 20% |
30 Properties |
| 2006 | £282,092 | -5% |
32 Properties |
| 2005 | £297,571 | 6% |
26 Properties |
| 2004 | £279,540 | 19% |
35 Properties |
| 2003 | £227,059 | 13% |
37 Properties |
| 2002 | £198,323 | -7% |
38 Properties |
| 2001 | £213,182 | 26% |
28 Properties |
| 2000 | £158,676 | -1% |
27 Properties |
| 1999 | £160,474 | 12% |
50 Properties |
| 1998 | £141,077 | -11% |
42 Properties |
| 1997 | £156,305 | 31% |
47 Properties |
| 1996 | £108,412 | 4% |
29 Properties |
| 1995 | £104,322 | - |
20 Properties |
Property Price per Property Type in Loggerheads And Whitmore
Here you can find historic sold price data in order to help with your property search.
The average Property Paid Price for specific property types in the last three years are:
| Property Type | Average Sold Price | Sold Properties |
|---|---|---|
| Semi Detached House | £354,333.00 | 9 Semi Detached Houses |
| Detached House | £487,645.00 | 40 Detached Houses |
| Terraced House | £277,500.00 | 4 Terraced Houses |

