Houses for sale & to rent in May Bank, Newcastle
House Prices in May Bank
Properties in May Bank have an average house price of £218,673.00 and had 267 Property Transactions within the last 3 years¹.
May Bank is an area in Newcastle, Staffordshire with 2,892 households², where the most expensive property was sold for £1,200,000.00.
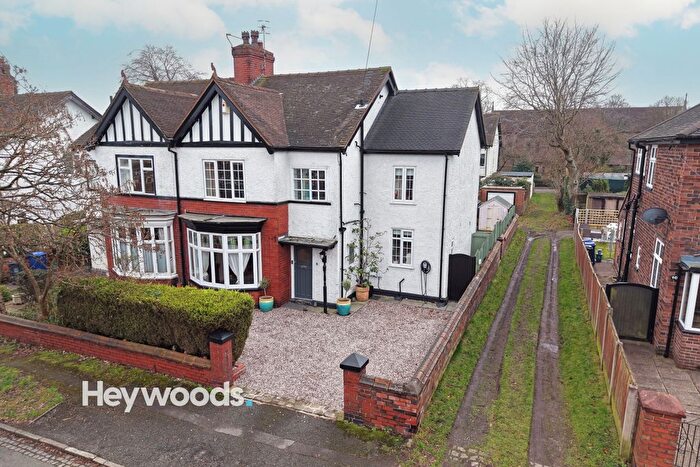
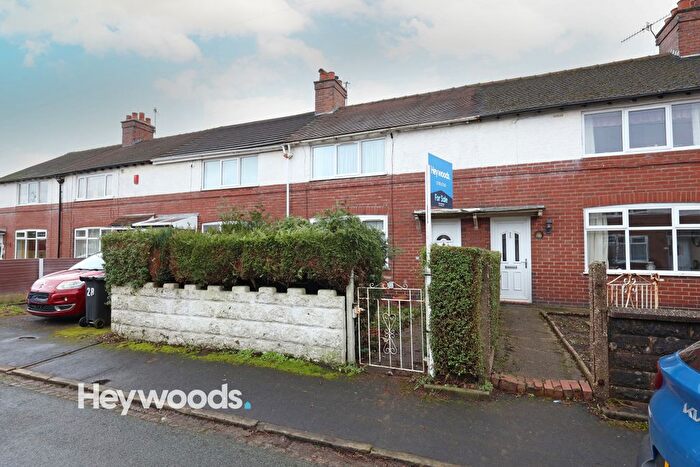
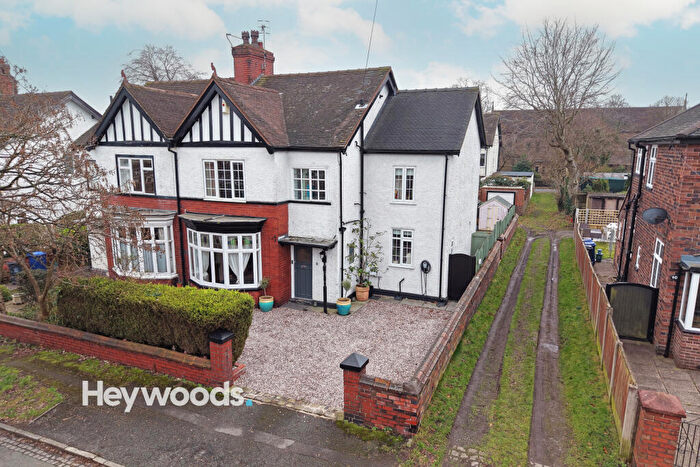
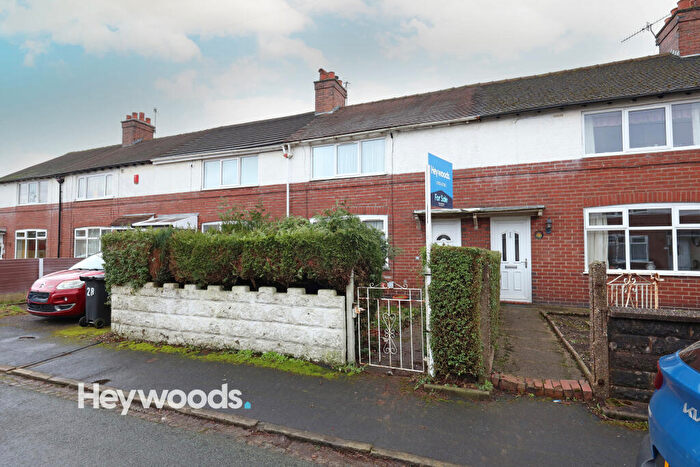
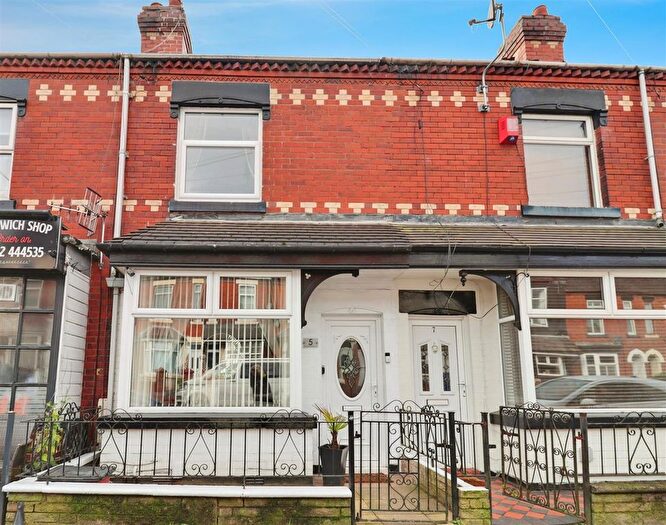
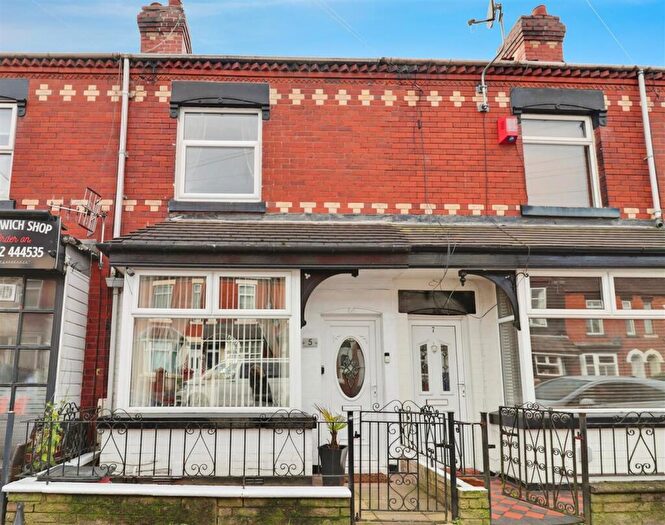
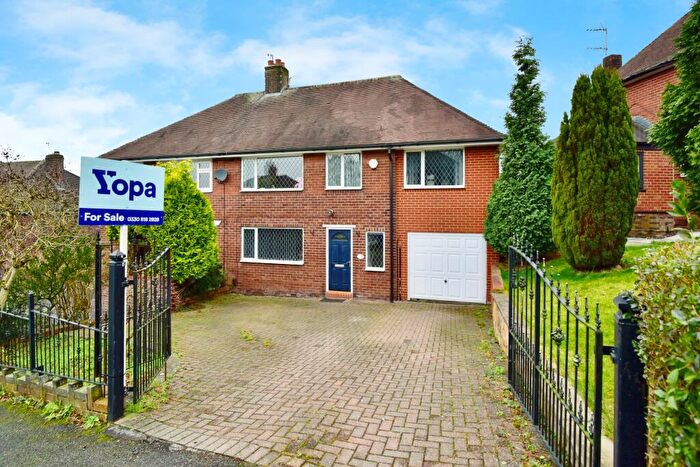
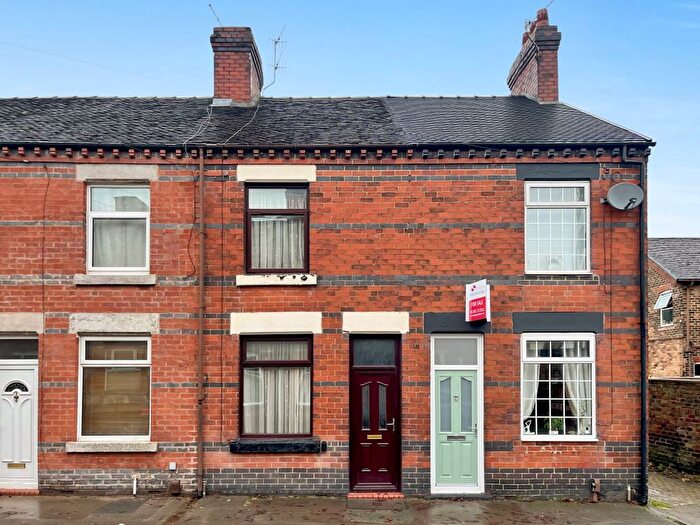
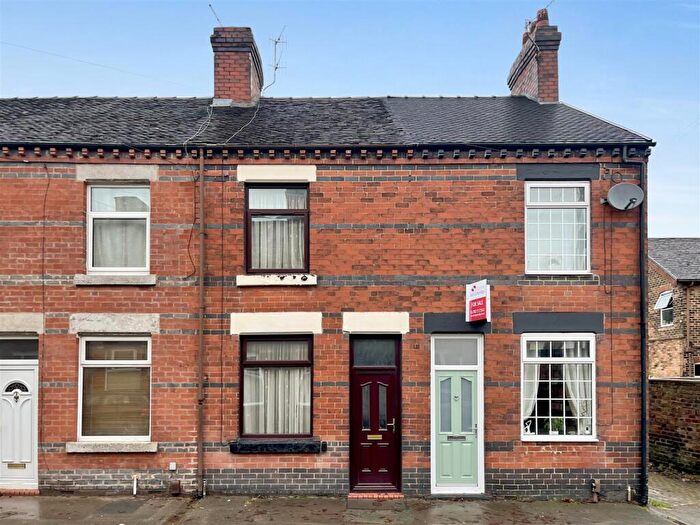
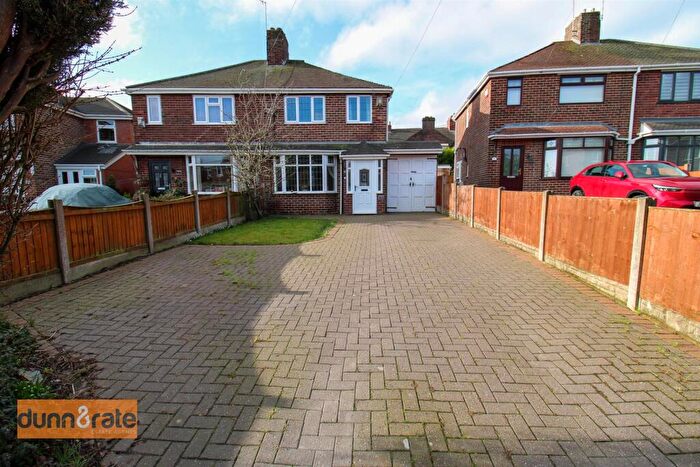
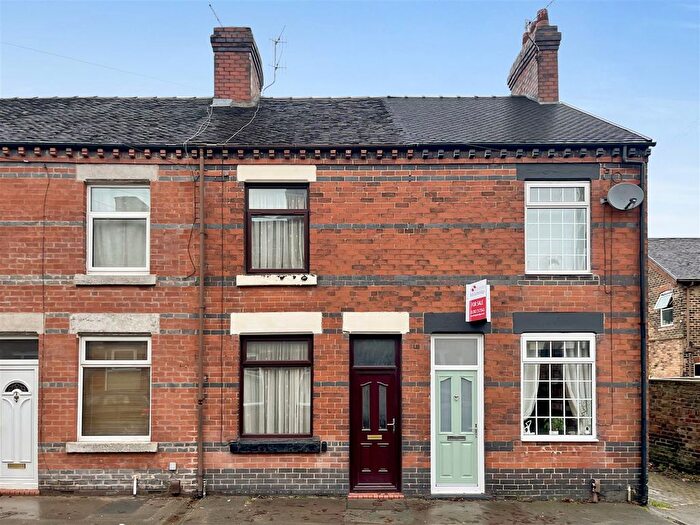
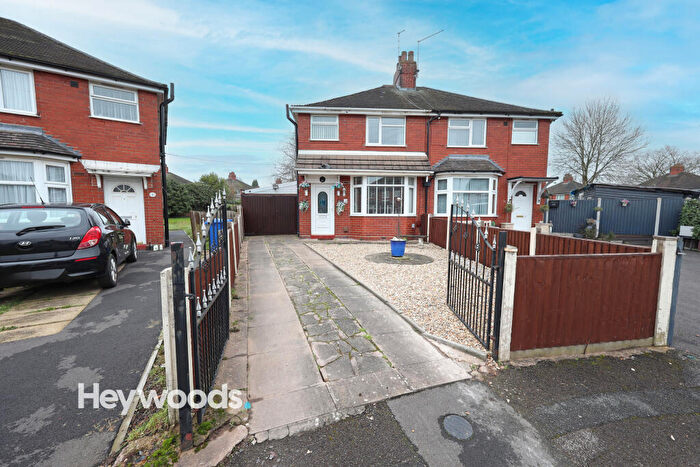
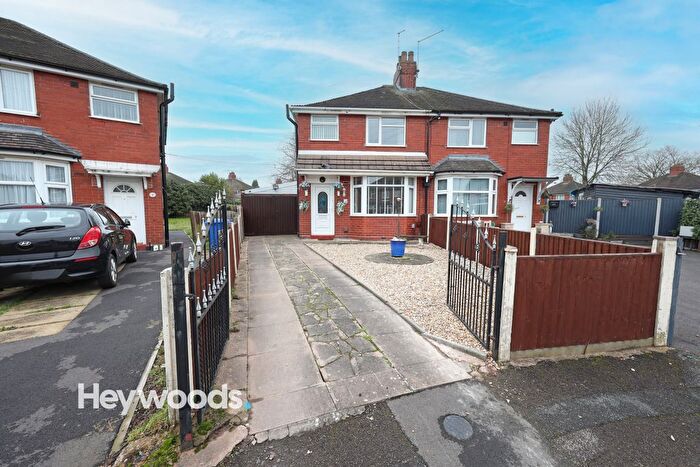
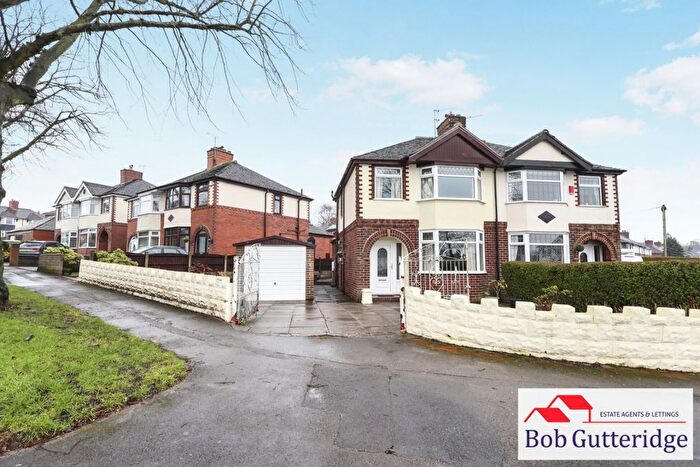
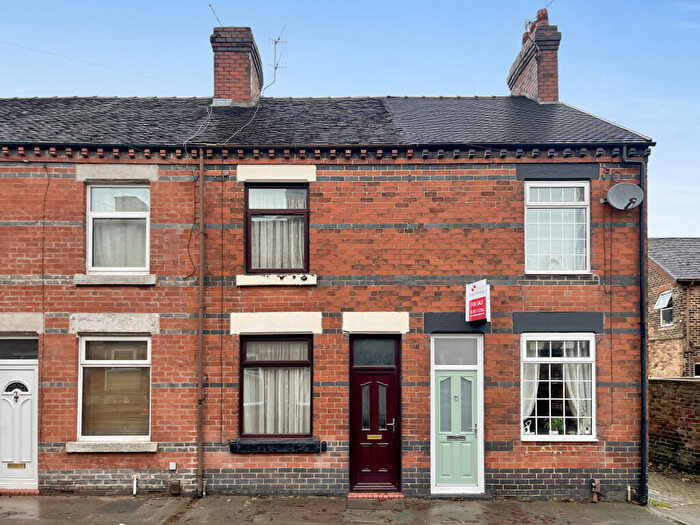
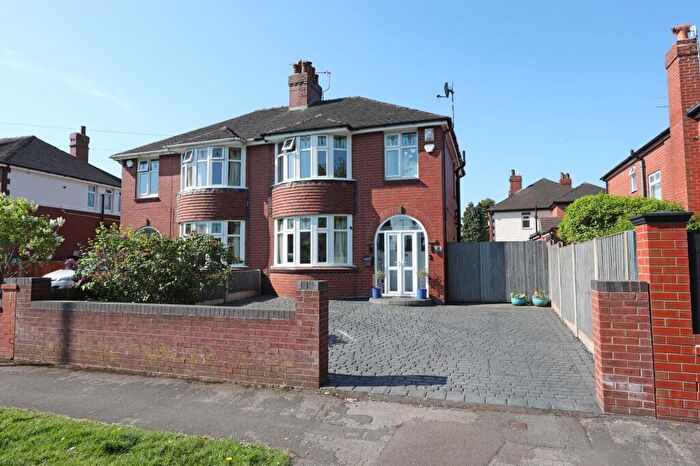
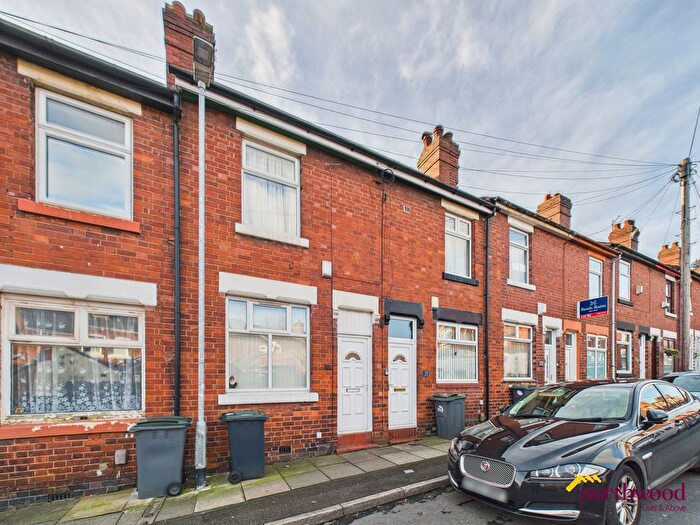
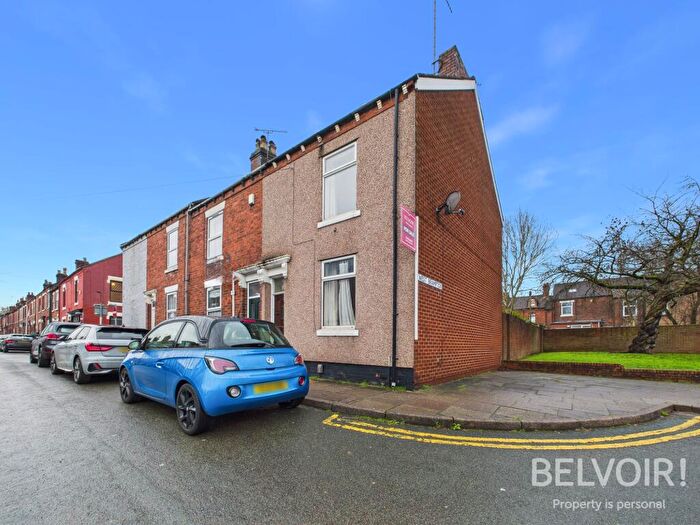
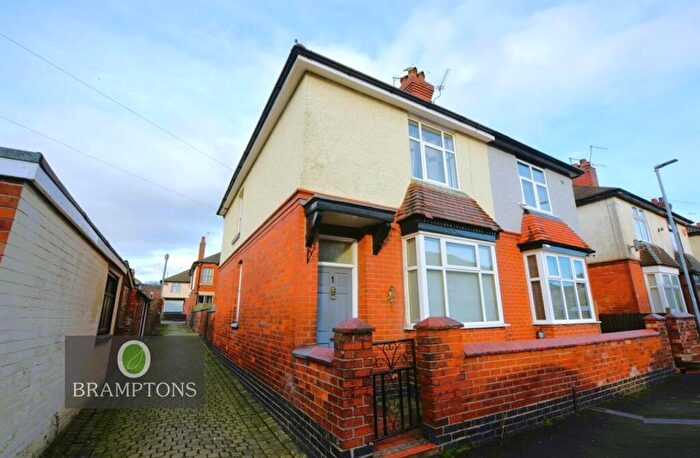
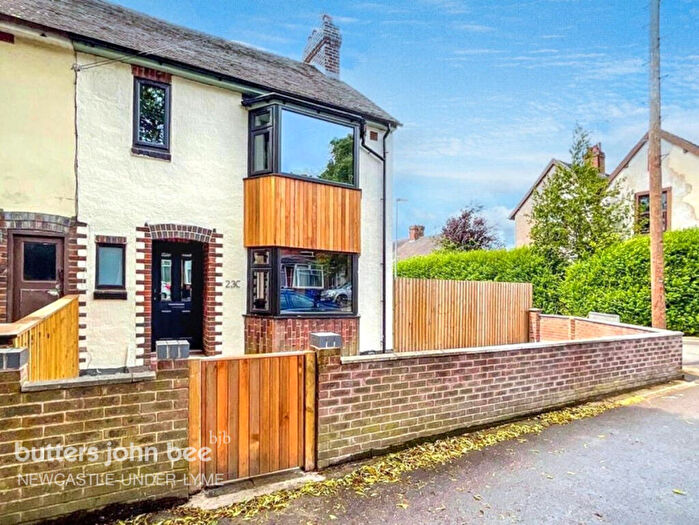
Properties for sale in May Bank
Roads and Postcodes in May Bank
Navigate through our locations to find the location of your next house in May Bank, Newcastle for sale or to rent.
| Streets | Postcodes |
|---|---|
| Adams Street | ST5 9PJ |
| Alexandra Road | ST5 9PL ST5 9PQ |
| Ashley Grove | ST5 9NF |
| Bankhouse Drive | ST5 0QQ |
| Barrington Court | ST5 0JZ |
| Basford Park Road | ST5 0PG ST5 0PH ST5 0PN ST5 0PP ST5 0PS ST5 0PT |
| Basford Villas | ST5 0TQ |
| Beech Grove | ST5 9NN |
| Belfield Avenue | ST5 9NG ST5 9NH |
| Bellefield View | ST5 9LX |
| Blunt Street | ST5 9NA |
| Bramfield Drive | ST5 0ST |
| Brampton Court | ST5 0QR |
| Brampton Gardens | ST5 0RL |
| Brampton Road | ST5 0PA ST5 0RF ST5 0RQ ST5 0SJ |
| Brampton Vale Gardens | ST5 0UJ |
| Brampton Wood | ST5 0QP ST5 0GP |
| Broughton Road | ST5 0PF ST5 0PQ |
| Burleigh Grove | ST5 0JT |
| Burlington Avenue | ST5 0LA |
| Campion Avenue | ST5 0PW |
| Chapel Street | ST5 9LY |
| Charles Street | ST5 0PX |
| Church Lane | ST5 0ED |
| Cooper Avenue | ST5 0QG |
| Croft Road | ST5 0TX |
| Curzon Street | ST5 0PD ST5 0PL |
| Delamere Grove | ST5 0HD |
| Dorridge Grove | ST5 0HX |
| Downing Avenue | ST5 0JY ST5 0LB ST5 0LG |
| East Crescent | ST5 0NW |
| Elm Street | ST5 0QD |
| Eltham Gardens | ST5 0JR |
| Etruria Road | ST5 0SX ST5 0SY ST5 0JG ST5 0LU ST5 0SU |
| Etruria Trading Estate | ST4 6JQ |
| Gower Street | ST5 1JQ |
| Granville Avenue | ST5 1JH |
| Greenbank Road | ST5 0RT ST5 0RU |
| Greenbrook Court | ST5 9QB |
| Heath Avenue | ST5 9NP ST5 9NU |
| Heath Place | ST5 9NX |
| Hempstalls Lane | ST5 0SE ST5 0SQ ST5 0SS ST5 9NR ST5 9NZ ST5 0SP |
| High Street | ST5 0JA ST5 0JB ST5 0FB |
| Highfield Grange | ST5 0TF |
| Hilltop Avenue | ST5 0QF |
| Holden Avenue | ST5 0NX |
| Irene Avenue | ST5 0NE |
| Kenilworth Grove | ST5 0LE |
| King Street | ST5 1JE ST5 1JF |
| Larkspur Grove | ST5 0SG |
| Leamington Gardens | ST5 0JX |
| Lower Oxford Road | ST5 0PB |
| Marina Drive | ST5 0RR ST5 0RS ST5 0SB ST5 9NL |
| Maureen Grove | ST5 9NW |
| May Avenue | ST5 0NH ST5 0NP ST5 0NS ST5 0NU |
| May Place | ST5 0RJ ST5 0SL |
| Mayfield Place | ST5 9LZ |
| Milehouse Lane | ST5 9JU |
| Norman Grove | ST5 0NF |
| Northcote Place | ST5 1HU ST5 1HY |
| Oxford Road | ST5 0PZ ST5 0QA ST5 0QB ST5 0RN |
| Oxhay View | ST5 0RX ST5 0SA |
| Parkside Drive | ST5 0NL ST5 0NN |
| Parkside Grove | ST5 0NJ |
| Pitfield Avenue | ST5 0NY |
| Primrose Grove | ST5 0SF |
| Rangemore Terrace | ST5 0PY |
| Rathbone Avenue | ST5 0NZ |
| Richmond Grove | ST5 0LF |
| Rudyard Grove | ST5 9ND |
| Sandy Lane | ST5 0LT ST5 0LX ST5 0LZ |
| Showan Avenue | ST5 0NT |
| Sidmouth Avenue | ST5 0QN |
| Somerville Avenue | ST5 0LH ST5 0LJ |
| Sparch Hollow | ST5 9NJ ST5 9PE ST5 9PF ST5 9PZ |
| Stanley Grove | ST5 0PJ |
| Stanley Road | ST5 0PE |
| Steel Close | ST5 0FE |
| Stratford Avenue | ST5 0JS ST5 0JU |
| Sunny Hollow | ST5 0RW |
| Sycamore Grove | ST5 0LQ |
| Sydney Street | ST5 0QE |
| Taylor Avenue | ST5 9NE |
| Taylor Street | ST5 9NB |
| The Avenue | ST5 0LY ST5 0ND ST5 0NQ |
| The Brampton | ST5 0QW |
| The Crossway | ST5 0RZ |
| The Greenway | ST5 0RY |
| The Hollies | ST5 0QT ST5 0QY |
| The Uplands | ST5 0TS |
| Trentham Grove | ST5 9NQ |
| Tulip Grove | ST5 0SH ST5 0SZ |
| Upper Marsh | ST5 0PU |
| Walklate Avenue | ST5 0PR |
| Walleys Drive | ST5 0NG |
| Warwick Grove | ST5 0LD |
| Wayside Avenue | ST5 9PH |
| West Avenue | ST5 0NB |
| Woodstock Close | ST5 0RP |
| Woolliscroft Avenue | ST5 0NR |
| Wulstan Drive | ST5 0RE ST5 0RG ST5 0RH |
Transport near May Bank
- FAQ
- Price Paid By Year
- Property Type Price
Frequently asked questions about May Bank
What is the average price for a property for sale in May Bank?
The average price for a property for sale in May Bank is £218,673. This amount is 9% higher than the average price in Newcastle. There are 1,385 property listings for sale in May Bank.
What streets have the most expensive properties for sale in May Bank?
The streets with the most expensive properties for sale in May Bank are Brampton Vale Gardens at an average of £617,333, Sidmouth Avenue at an average of £562,083 and Wulstan Drive at an average of £479,166.
What streets have the most affordable properties for sale in May Bank?
The streets with the most affordable properties for sale in May Bank are Bellefield View at an average of £100,000, The Hollies at an average of £103,500 and Blunt Street at an average of £107,500.
Which train stations are available in or near May Bank?
Some of the train stations available in or near May Bank are Longport, Stoke-On-Trent and Longton.
Property Price Paid in May Bank by Year
The average sold property price by year was:
| Year | Average Sold Price | Price Change |
Sold Properties
|
|---|---|---|---|
| 2025 | £235,981 | 6% |
74 Properties |
| 2024 | £221,249 | 10% |
109 Properties |
| 2023 | £200,084 | -1% |
84 Properties |
| 2022 | £201,738 | 5% |
110 Properties |
| 2021 | £191,069 | -3% |
113 Properties |
| 2020 | £196,632 | 9% |
96 Properties |
| 2019 | £179,844 | 2% |
92 Properties |
| 2018 | £176,015 | 9% |
95 Properties |
| 2017 | £160,784 | -2% |
99 Properties |
| 2016 | £163,483 | 3% |
119 Properties |
| 2015 | £158,562 | 1% |
103 Properties |
| 2014 | £157,429 | 11% |
98 Properties |
| 2013 | £139,447 | 3% |
67 Properties |
| 2012 | £135,171 | 7% |
80 Properties |
| 2011 | £126,358 | -16% |
78 Properties |
| 2010 | £145,964 | 6% |
74 Properties |
| 2009 | £137,118 | -17% |
79 Properties |
| 2008 | £159,775 | 8% |
70 Properties |
| 2007 | £147,740 | -3% |
139 Properties |
| 2006 | £151,621 | 15% |
125 Properties |
| 2005 | £128,366 | 1% |
95 Properties |
| 2004 | £127,239 | 12% |
102 Properties |
| 2003 | £111,595 | 32% |
119 Properties |
| 2002 | £76,227 | 4% |
159 Properties |
| 2001 | £72,863 | 17% |
121 Properties |
| 2000 | £60,201 | 6% |
97 Properties |
| 1999 | £56,755 | -2% |
113 Properties |
| 1998 | £57,609 | 6% |
118 Properties |
| 1997 | £53,933 | 8% |
96 Properties |
| 1996 | £49,825 | 7% |
125 Properties |
| 1995 | £46,424 | - |
95 Properties |
Property Price per Property Type in May Bank
Here you can find historic sold price data in order to help with your property search.
The average Property Paid Price for specific property types in the last three years are:
| Property Type | Average Sold Price | Sold Properties |
|---|---|---|
| Flat | £145,245.00 | 8 Flats |
| Semi Detached House | £224,521.00 | 145 Semi Detached Houses |
| Detached House | £435,025.00 | 29 Detached Houses |
| Terraced House | £141,794.00 | 85 Terraced Houses |

