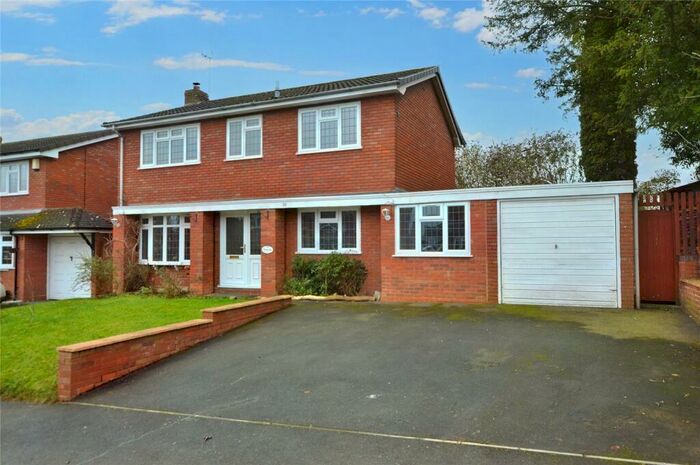
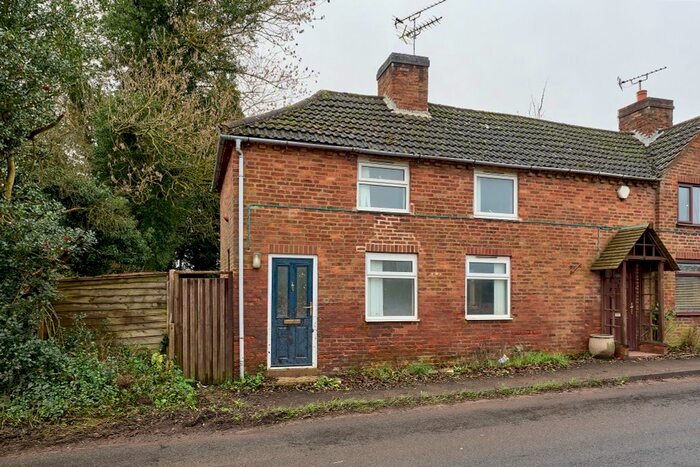
Houses for sale & to rent in Trysull And Seisdon, Stourbridge
House Prices in Trysull And Seisdon
Properties in Trysull And Seisdon have an average house price of £496,404.00 and had 11 Property Transactions within the last 3 years¹.
Trysull And Seisdon is an area in Stourbridge, Staffordshire with 405 households², where the most expensive property was sold for £850,000.00.
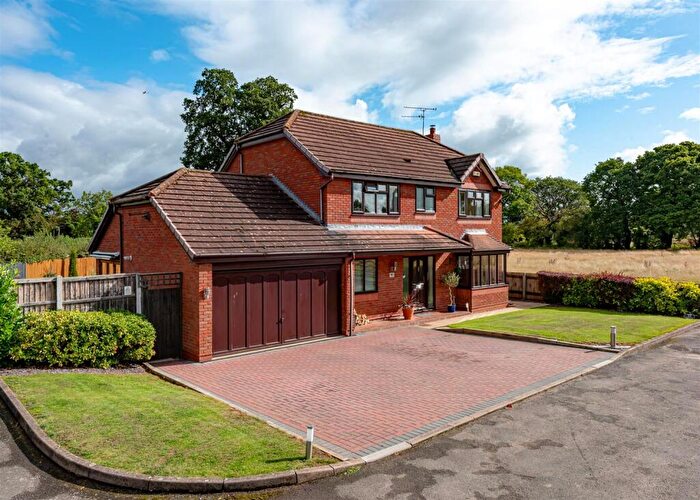
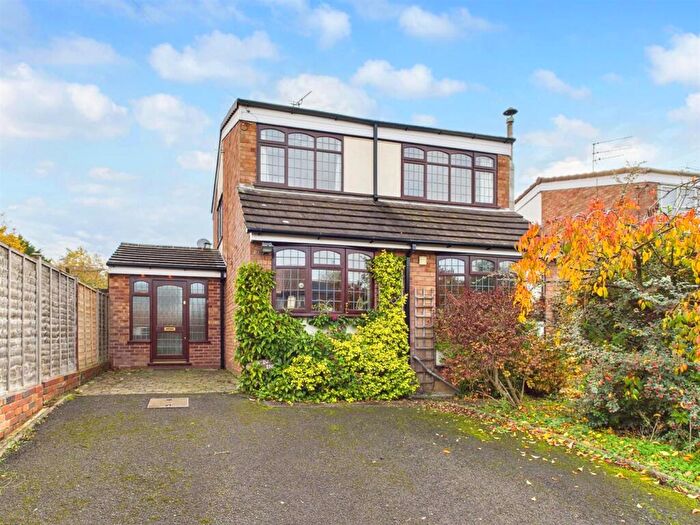
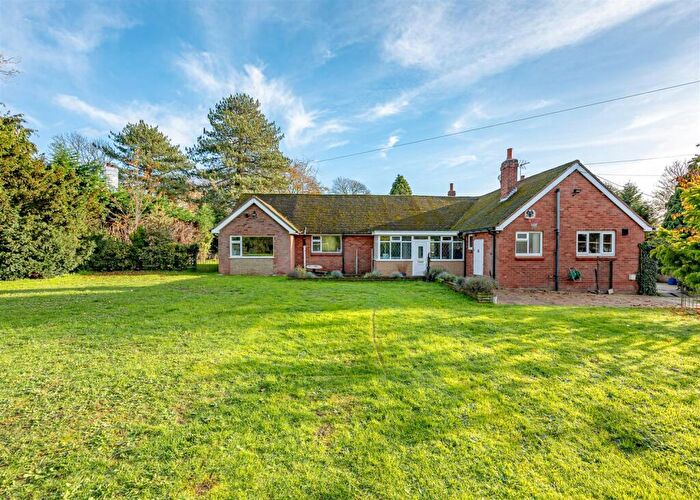
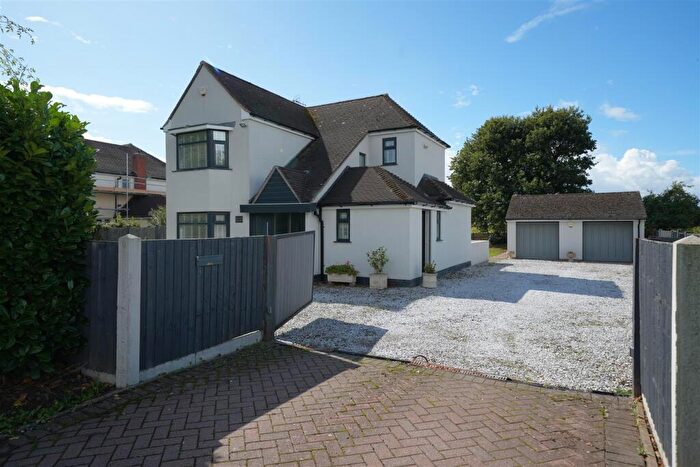
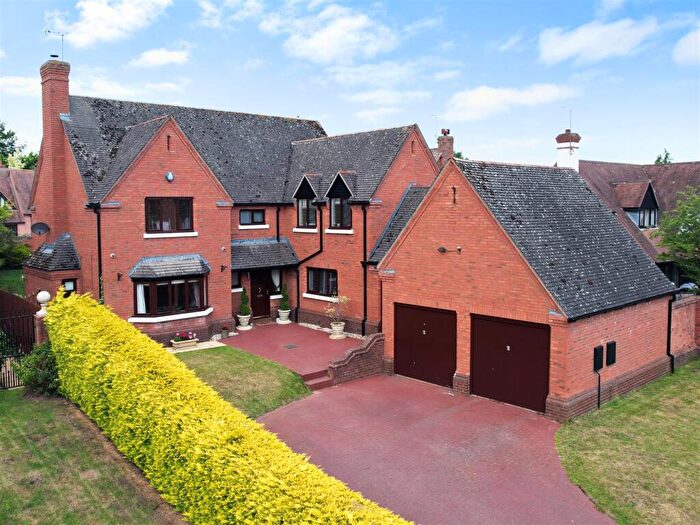
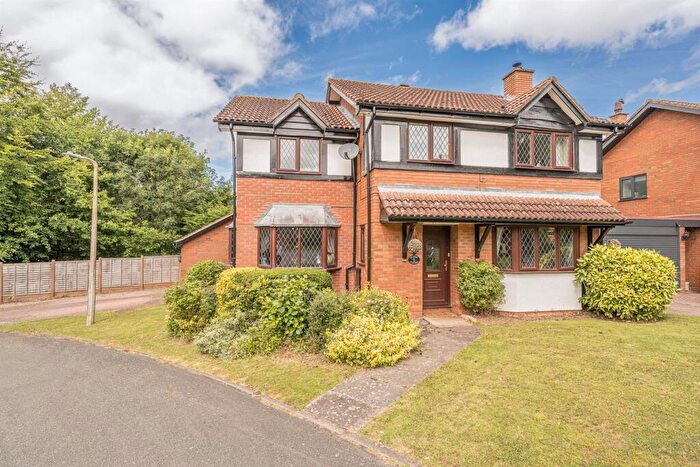
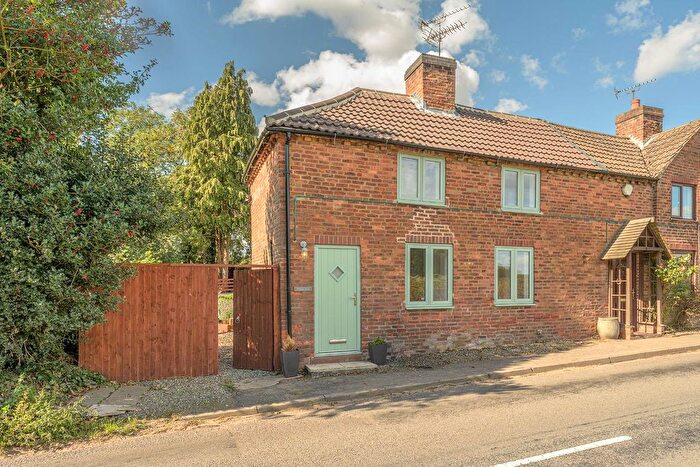
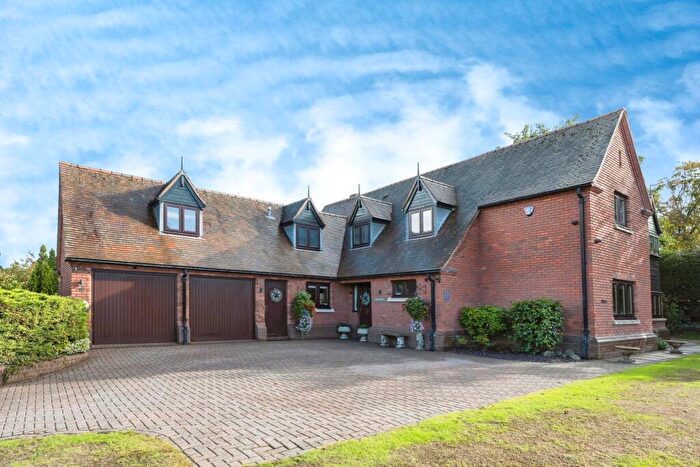
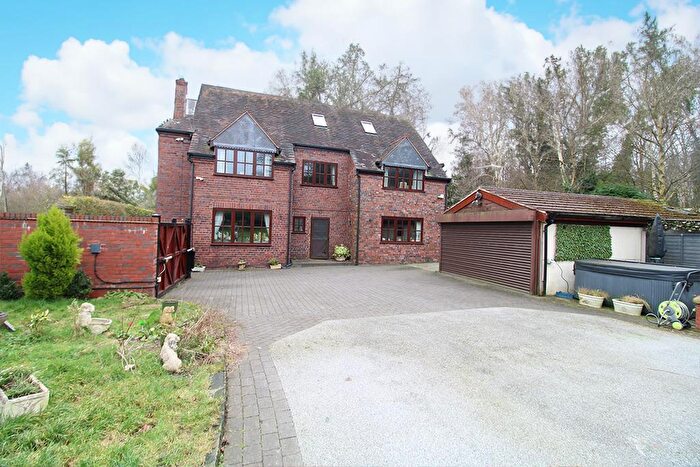
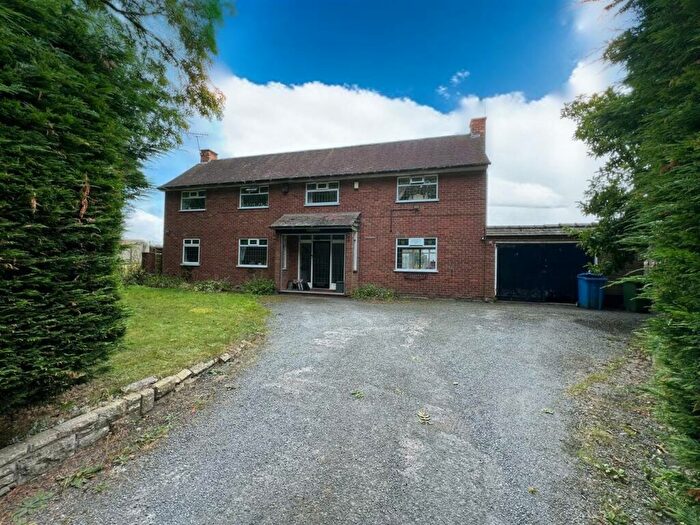
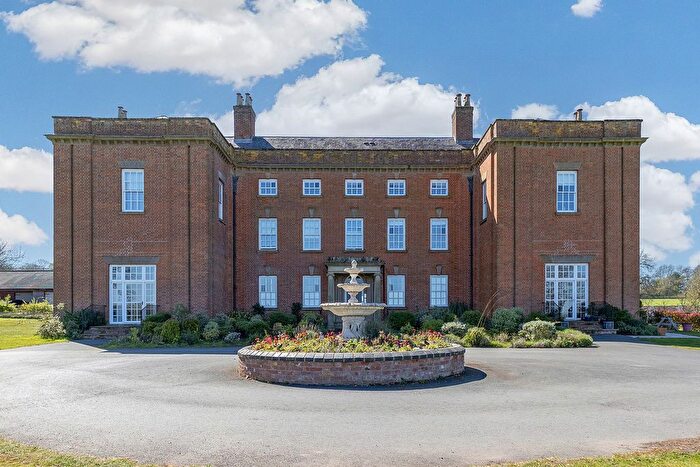
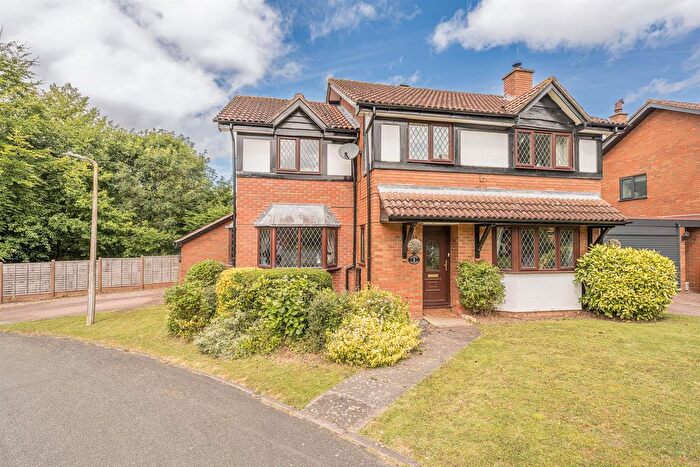
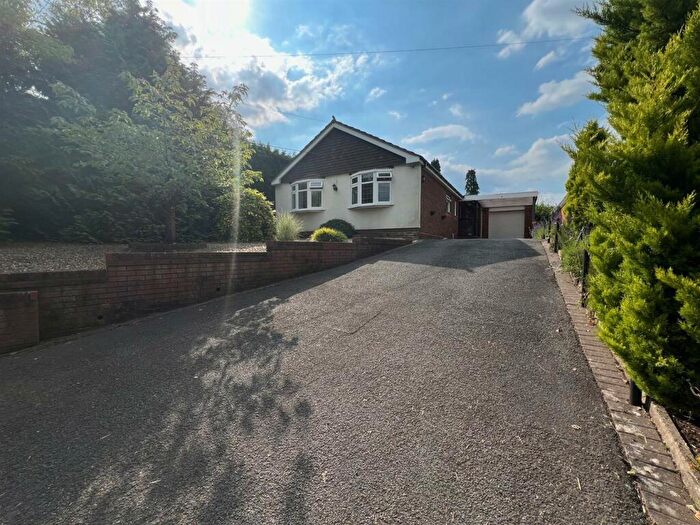
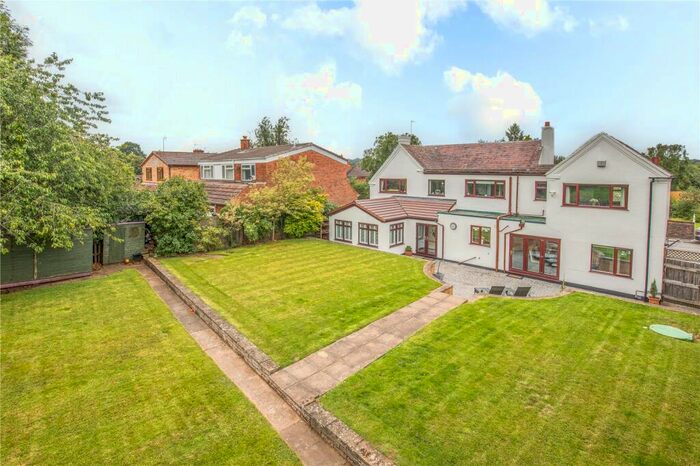
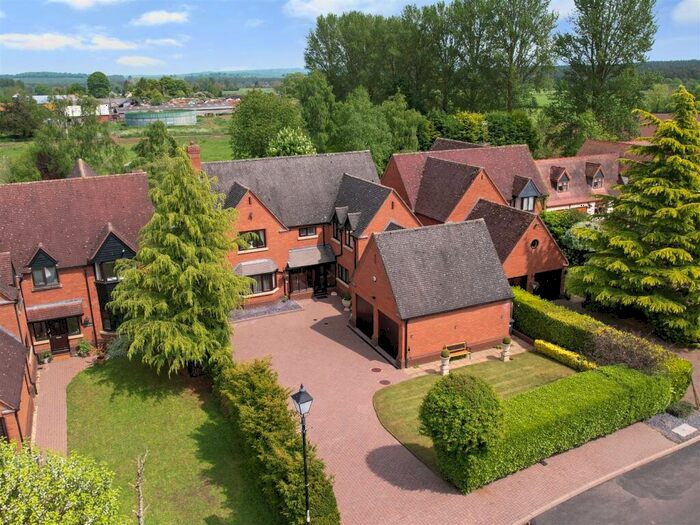
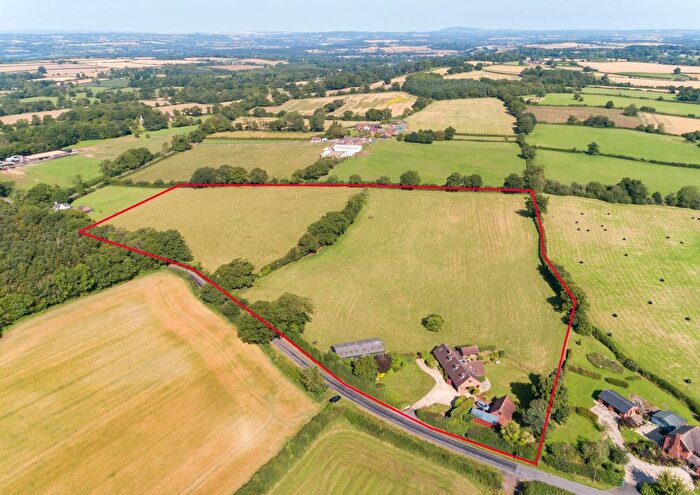
Properties for sale in Trysull And Seisdon
Previously listed properties in Trysull And Seisdon
Roads and Postcodes in Trysull And Seisdon
Navigate through our locations to find the location of your next house in Trysull And Seisdon, Stourbridge for sale or to rent.
| Streets | Postcodes |
|---|---|
| Blundies Lane | DY7 5HP DY7 5HU |
| Bradburys Lane | DY7 5JG |
| Brantley Crescent | DY7 5DB |
| Brantley Lane | DY7 5DA |
| Bridgnorth Road | DY7 5JB DY7 5JF DY7 5HA DY7 5JD DY7 5JE DY7 5LB |
| Brookside | DY7 5HS |
| Browns Lake | DY7 5HR |
| Chester Road | DY7 5HN |
| Church Lane | DY7 5DH DY7 5DF |
| Commonside | DY7 5HG |
| Cote Lane | DY7 5HF DY7 5HJ |
| Coxgreen | DY7 5LD DY7 5LE DY7 5LG |
| Crab Lane | DY7 5DZ |
| Enville Estate | DY7 5HH |
| Forest Lane | DY7 5EB |
| Glebelands | DY7 5DL |
| Gospel Ash Road | DY7 5ED DY7 5EE DY7 5EF DY7 5EQ |
| Grove Lane | DY7 5JH |
| Halfpenny Green | DY7 5EL DY7 5EN DY7 5EH DY7 5EW |
| Halfpenny Green Cottages | DY7 5EJ |
| Hall Drive | DY7 5HB |
| Highgate Common | DY7 5BS DY7 5BN |
| Hollies Lane | DY7 5LQ |
| Hoo Lane | DY7 5HW |
| Kinver Road | DY7 5HE |
| Land Associated With | DY7 5JA |
| Leaton Lane | DY7 5DE |
| Lutley Lane | DY7 5DJ DY7 5DQ DY7 5JJ |
| Manor Lane | DY7 5EG |
| Mere Lane | DY7 5BP DY7 5JL |
| Morfe | DY7 5JN DY7 5JP DY7 5JW |
| Morfe Hall Lane | DY7 5HT DY7 5JU |
| Morfe Lane | DY7 5JR DY7 5JS DY7 5JT DY7 5JX |
| School Courtyard | DY7 5JQ |
| Six Ashes Road | DY7 5BU DY7 5BY DY7 5BZ DY7 5DD DY7 5DP DY7 5DU DY7 5EA DY7 5BT DY7 5BX DY7 5DT DY7 5DX |
| The Close | DY7 5HX |
| Upper Whittimere | DY7 5EP |
| Whittimere Lane | DY7 5ES DY7 5ET |
| Wolverhampton Business Airport | DY7 5DY |
| DY7 5HD |
Transport near Trysull And Seisdon
-
Stourbridge Town Station
-
Stourbridge Junction Station
-
Lye Station
-
Hagley Station
-
Blakedown Station
-
Cradley Heath Station
-
Kidderminster Station
-
Coseley Station
-
Tipton Station
-
Wolverhampton Station
- FAQ
- Price Paid By Year
- Property Type Price
Frequently asked questions about Trysull And Seisdon
What is the average price for a property for sale in Trysull And Seisdon?
The average price for a property for sale in Trysull And Seisdon is £496,404. This amount is 14% higher than the average price in Stourbridge. There are 33 property listings for sale in Trysull And Seisdon.
What streets have the most expensive properties for sale in Trysull And Seisdon?
The streets with the most expensive properties for sale in Trysull And Seisdon are The Close at an average of £755,316, Blundies Lane at an average of £490,000 and Crab Lane at an average of £475,000.
What streets have the most affordable properties for sale in Trysull And Seisdon?
The streets with the most affordable properties for sale in Trysull And Seisdon are Chester Road at an average of £107,000 and Six Ashes Road at an average of £408,125.
Which train stations are available in or near Trysull And Seisdon?
Some of the train stations available in or near Trysull And Seisdon are Stourbridge Town, Stourbridge Junction and Lye.
Property Price Paid in Trysull And Seisdon by Year
The average sold property price by year was:
| Year | Average Sold Price | Price Change |
Sold Properties
|
|---|---|---|---|
| 2025 | £520,000 | 2% |
3 Properties |
| 2024 | £511,741 | 19% |
6 Properties |
| 2023 | £415,000 | -21% |
2 Properties |
| 2022 | £502,350 | 0,1% |
8 Properties |
| 2021 | £501,772 | 13% |
11 Properties |
| 2020 | £436,500 | 29% |
6 Properties |
| 2019 | £311,250 | 16% |
8 Properties |
| 2018 | £261,000 | -1% |
8 Properties |
| 2017 | £262,771 | -3% |
7 Properties |
| 2016 | £271,083 | -38% |
6 Properties |
| 2015 | £373,000 | 5% |
5 Properties |
| 2014 | £352,954 | 7% |
11 Properties |
| 2013 | £327,681 | 3% |
11 Properties |
| 2012 | £317,800 | -3% |
10 Properties |
| 2011 | £327,666 | 23% |
6 Properties |
| 2010 | £253,916 | -20% |
6 Properties |
| 2009 | £305,000 | 13% |
1 Property |
| 2008 | £264,285 | -26% |
7 Properties |
| 2007 | £333,961 | 2% |
13 Properties |
| 2006 | £328,428 | 20% |
14 Properties |
| 2005 | £264,086 | -32% |
11 Properties |
| 2004 | £348,583 | 30% |
6 Properties |
| 2003 | £244,375 | 20% |
8 Properties |
| 2002 | £196,628 | 48% |
19 Properties |
| 2001 | £103,157 | -68% |
7 Properties |
| 2000 | £173,782 | 9% |
14 Properties |
| 1999 | £158,081 | -7% |
8 Properties |
| 1998 | £168,695 | 3% |
10 Properties |
| 1997 | £163,095 | 9% |
10 Properties |
| 1996 | £148,492 | -13% |
14 Properties |
| 1995 | £168,166 | - |
9 Properties |
Property Price per Property Type in Trysull And Seisdon
Here you can find historic sold price data in order to help with your property search.
The average Property Paid Price for specific property types in the last three years are:
| Property Type | Average Sold Price | Sold Properties |
|---|---|---|
| Detached House | £559,550.00 | 9 Detached Houses |
| Semi Detached House | £212,250.00 | 2 Semi Detached Houses |

