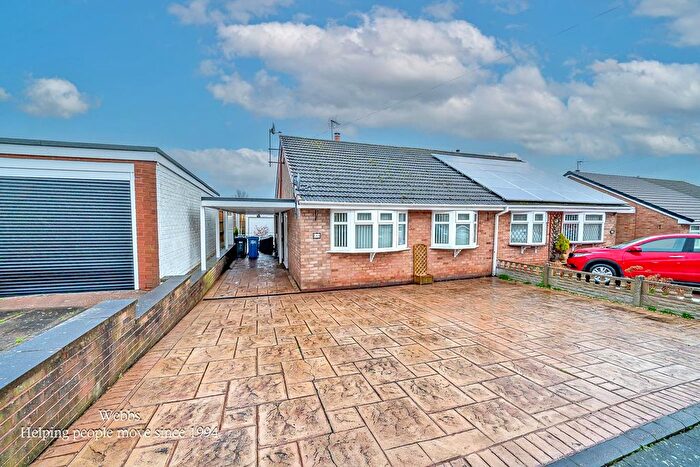
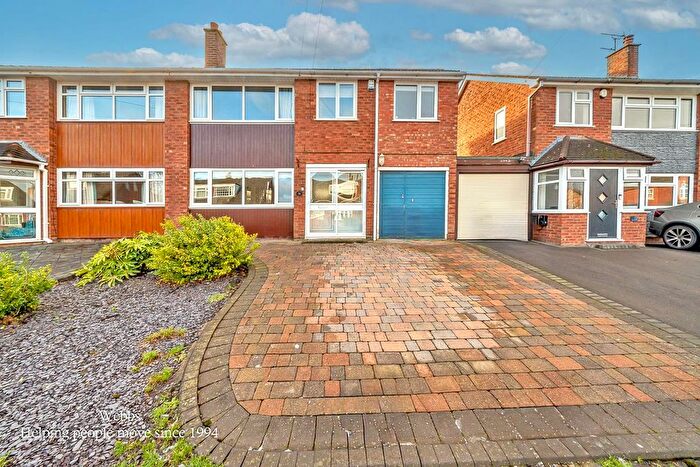
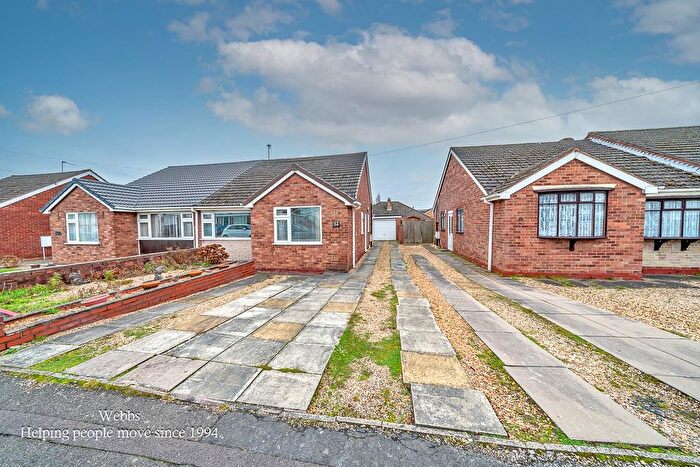
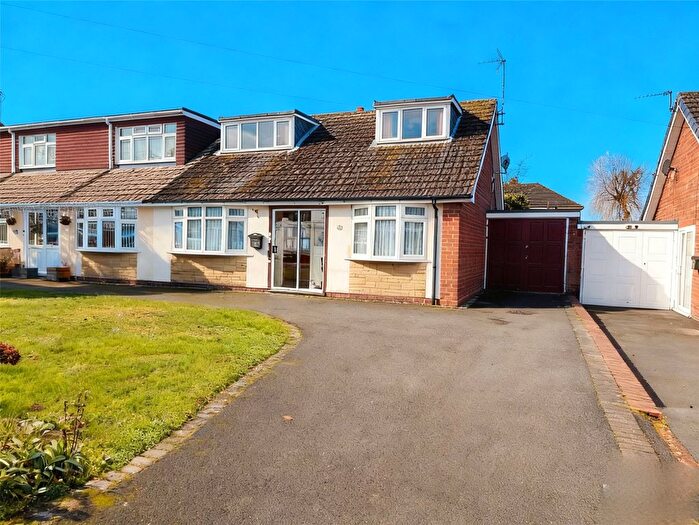
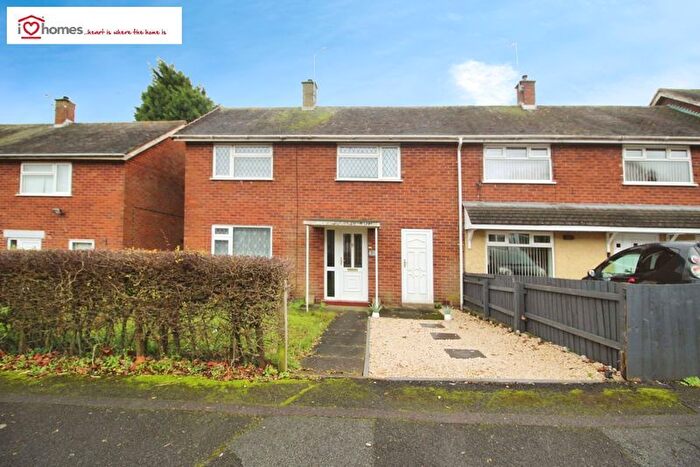
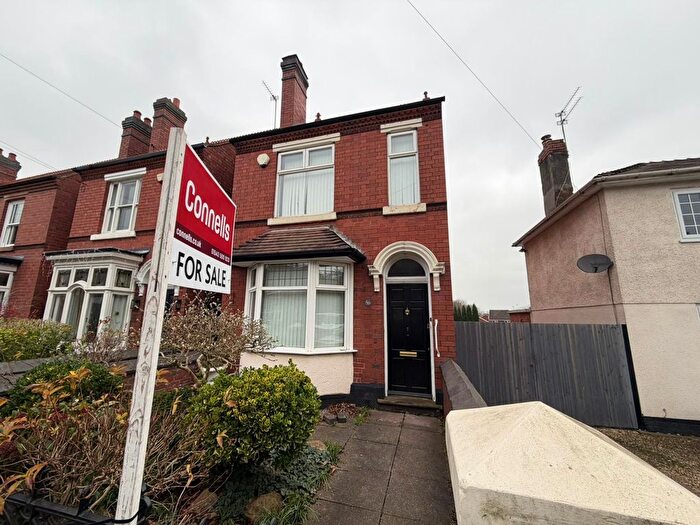
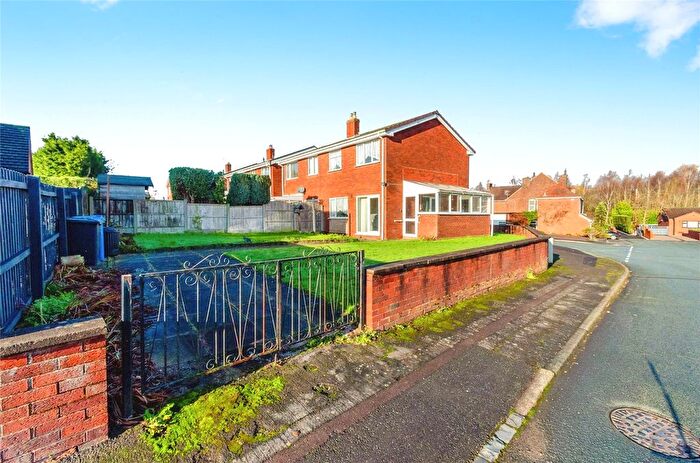
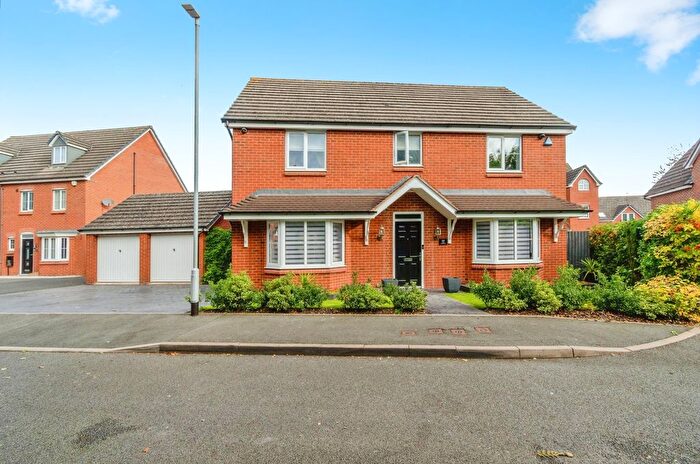
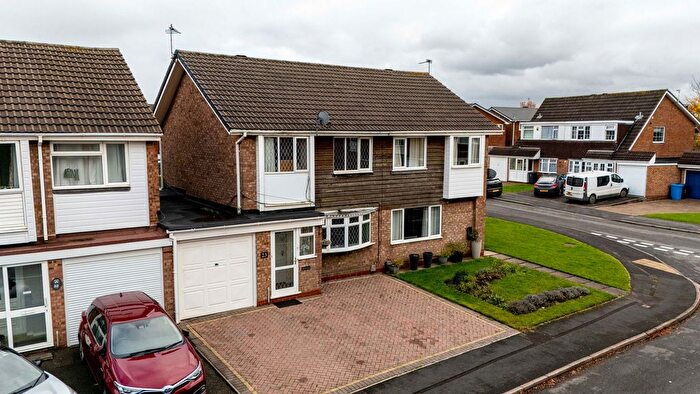
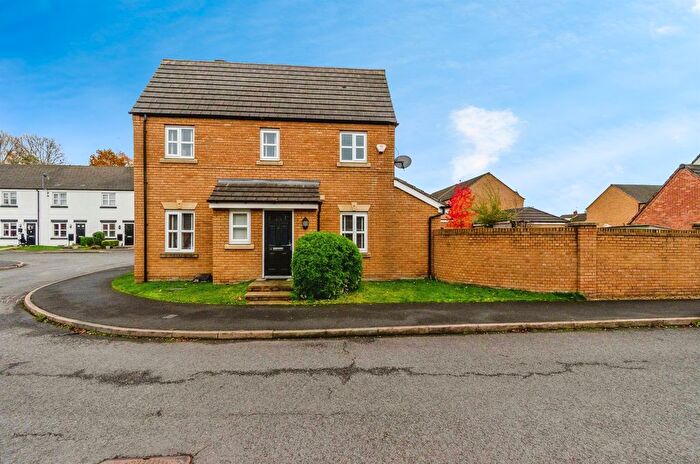
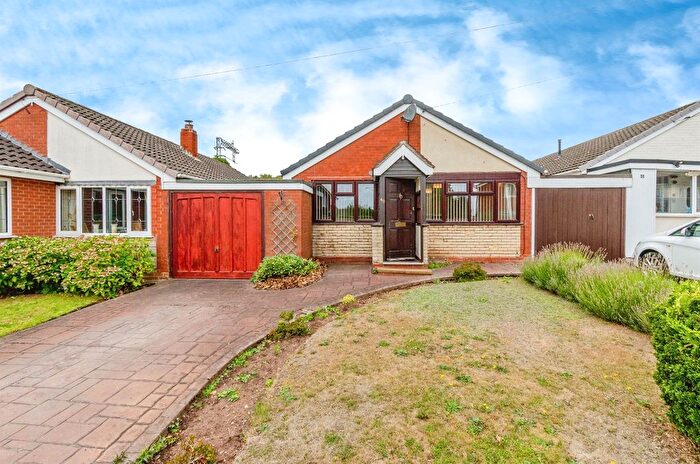
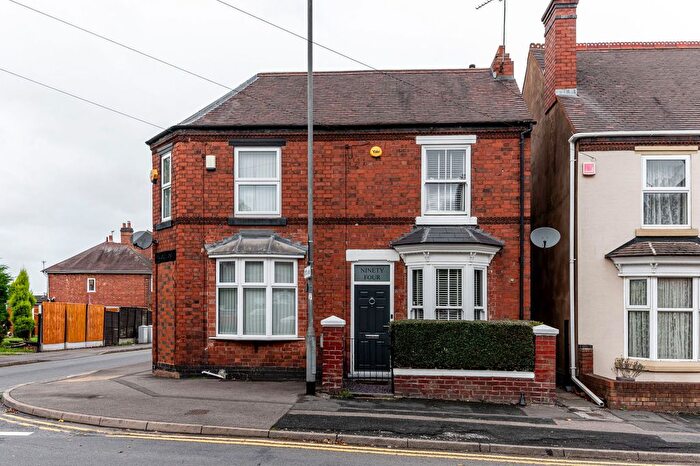
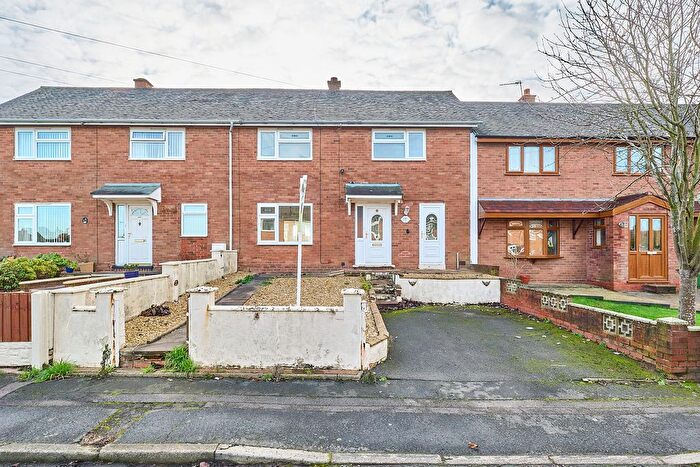
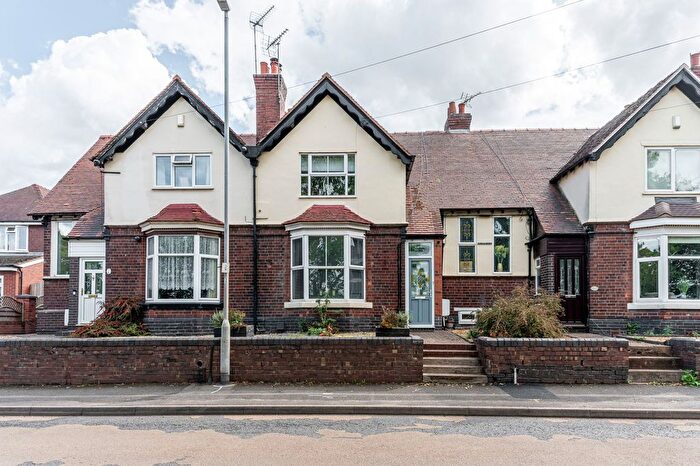
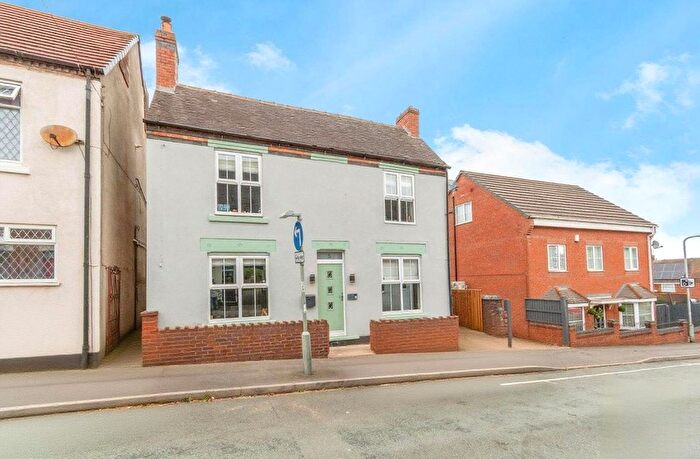
Houses for sale & to rent in Cheslyn Hay South, Walsall
House Prices in Cheslyn Hay South
Properties in Cheslyn Hay South have an average house price of £261,548.00 and had 149 Property Transactions within the last 3 years¹.
Cheslyn Hay South is an area in Walsall, Staffordshire with 1,525 households², where the most expensive property was sold for £592,500.00.
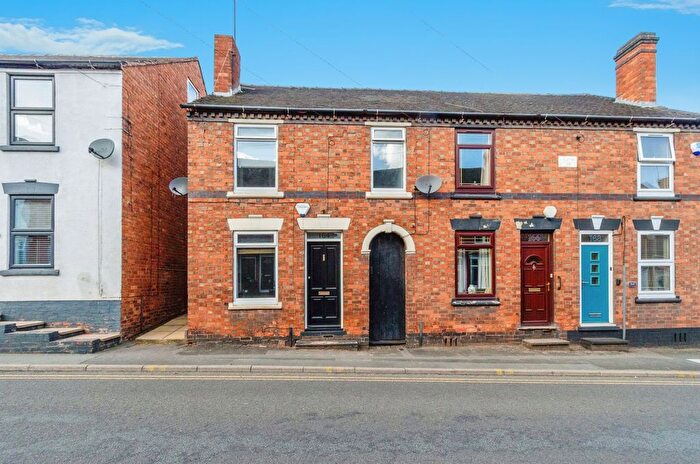
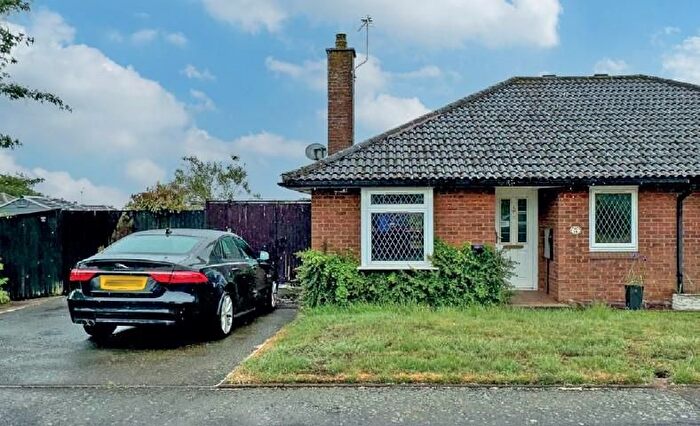
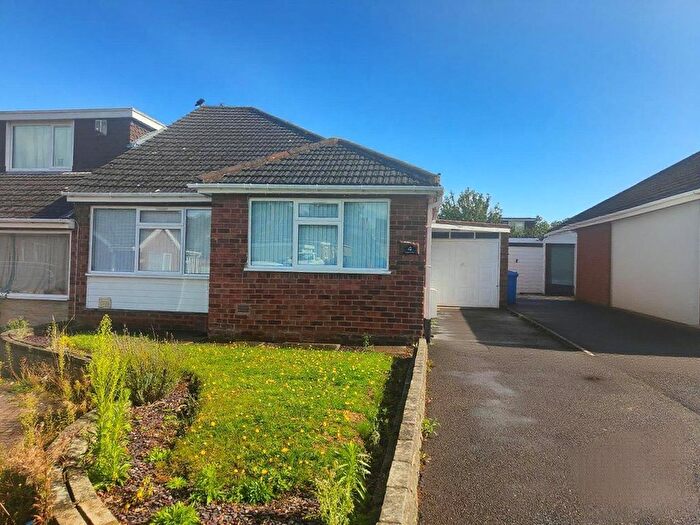
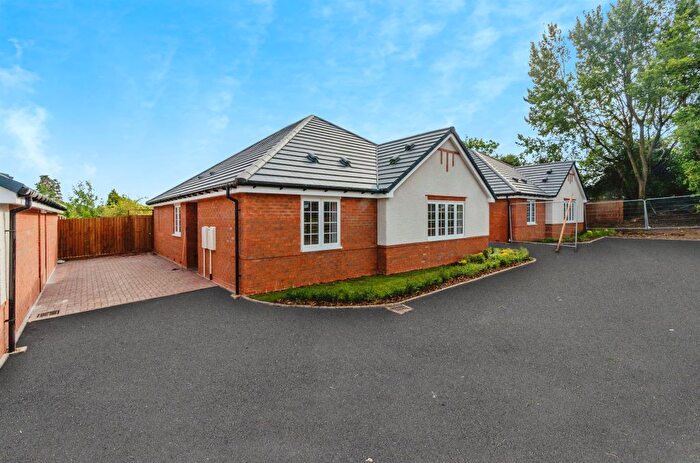
Properties for sale in Cheslyn Hay South
Previously listed properties in Cheslyn Hay South
Roads and Postcodes in Cheslyn Hay South
Navigate through our locations to find the location of your next house in Cheslyn Hay South, Walsall for sale or to rent.
| Streets | Postcodes |
|---|---|
| Anstree Close | WS6 7LS |
| Berwyn Grove | WS6 7DW |
| Besom Way | WS6 7NZ |
| Boleyn Close | WS6 7LW |
| Campians Avenue | WS6 7HW |
| Chase Avenue | WS6 7BU |
| Cleves Crescent | WS6 7LR |
| Collier Close | WS6 7JJ |
| Coltsfoot View | WS6 7BG |
| Cranmer Close | WS6 7LT |
| Dundalk Lane | WS6 7AZ WS6 7BA WS6 7BB |
| Eagle Close | WS6 7LA |
| Fairview Close | WS6 7JH |
| Falcon Close | WS6 7LJ |
| Forest Glade | WS6 7QY |
| Glenthorne Drive | WS6 7BZ |
| Hawks Close | WS6 7LE |
| Hazelwood Close | WS6 7HE |
| High Street | WS6 7AD WS6 7AF |
| Kestrel Way | WS6 7LB WS6 7LG WS6 7LQ |
| Landywood Green | WS6 7QX |
| Landywood Lane | WS6 7AH WS6 7AJ WS6 7AQ WS6 7AL |
| Lapwing Close | WS6 7LL |
| Leveson Avenue | WS6 7BN |
| Magna Close | WS6 7DB |
| Merrill Close | WS6 7BQ |
| Mitre Road | WS6 7HL WS6 7HN |
| Moons Lane | WS6 7AY |
| Mount Close | WS6 7BP |
| New Horse Road | WS6 7BL |
| Oak Ridge Drive | WS6 7QZ |
| Oakdene Close | WS6 7HF |
| Orchard Close | WS6 7DG |
| Pinfold Lane | WS6 7HP WS6 7NY |
| Quarry Close | WS6 7BY |
| Raven Close | WS6 7LH |
| Rosewood Park | WS6 7HD |
| Seymour Close | WS6 7LP |
| Short Lane | WS6 7DE |
| Sutherland Road | WS6 7BS WS6 7BT WS6 7BW |
| Swan Close | WS6 7LF |
| Tennscore Avenue | WS6 7BX |
| The Croft | WS6 7QB |
| The Nook | WS6 7LD |
| Tudor Way | WS6 7LN |
| Valley Green | WS6 7QD |
| Westbourne Avenue | WS6 7DF |
| Woody Bank | WS6 7QA |
Transport near Cheslyn Hay South
- FAQ
- Price Paid By Year
- Property Type Price
Frequently asked questions about Cheslyn Hay South
What is the average price for a property for sale in Cheslyn Hay South?
The average price for a property for sale in Cheslyn Hay South is £261,548. This amount is 6% lower than the average price in Walsall. There are 208 property listings for sale in Cheslyn Hay South.
What streets have the most expensive properties for sale in Cheslyn Hay South?
The streets with the most expensive properties for sale in Cheslyn Hay South are Rosewood Park at an average of £533,750, Tudor Way at an average of £525,000 and Boleyn Close at an average of £442,500.
What streets have the most affordable properties for sale in Cheslyn Hay South?
The streets with the most affordable properties for sale in Cheslyn Hay South are Oak Ridge Drive at an average of £166,000, Mitre Road at an average of £188,500 and Woody Bank at an average of £202,750.
Which train stations are available in or near Cheslyn Hay South?
Some of the train stations available in or near Cheslyn Hay South are Landywood, Cannock and Bloxwich North.
Property Price Paid in Cheslyn Hay South by Year
The average sold property price by year was:
| Year | Average Sold Price | Price Change |
Sold Properties
|
|---|---|---|---|
| 2025 | £288,683 | 8% |
34 Properties |
| 2024 | £265,988 | 12% |
39 Properties |
| 2023 | £235,030 | -9% |
33 Properties |
| 2022 | £256,417 | 5% |
43 Properties |
| 2021 | £244,434 | 2% |
53 Properties |
| 2020 | £240,473 | 3% |
28 Properties |
| 2019 | £233,477 | 11% |
45 Properties |
| 2018 | £208,605 | 5% |
37 Properties |
| 2017 | £198,681 | -0,3% |
38 Properties |
| 2016 | £199,260 | 11% |
49 Properties |
| 2015 | £177,437 | 11% |
45 Properties |
| 2014 | £157,682 | -0,2% |
35 Properties |
| 2013 | £158,067 | 1% |
39 Properties |
| 2012 | £157,212 | -11% |
27 Properties |
| 2011 | £174,758 | 3% |
31 Properties |
| 2010 | £169,475 | -14% |
22 Properties |
| 2009 | £192,628 | 10% |
21 Properties |
| 2008 | £172,473 | 6% |
23 Properties |
| 2007 | £162,747 | -12% |
40 Properties |
| 2006 | £182,221 | 12% |
53 Properties |
| 2005 | £161,088 | 1% |
61 Properties |
| 2004 | £160,233 | 18% |
69 Properties |
| 2003 | £131,054 | 10% |
62 Properties |
| 2002 | £117,510 | 5% |
66 Properties |
| 2001 | £111,102 | 18% |
92 Properties |
| 2000 | £90,917 | 25% |
87 Properties |
| 1999 | £67,918 | -7% |
62 Properties |
| 1998 | £72,957 | 10% |
47 Properties |
| 1997 | £65,638 | 8% |
88 Properties |
| 1996 | £60,504 | 11% |
80 Properties |
| 1995 | £53,613 | - |
79 Properties |
Property Price per Property Type in Cheslyn Hay South
Here you can find historic sold price data in order to help with your property search.
The average Property Paid Price for specific property types in the last three years are:
| Property Type | Average Sold Price | Sold Properties |
|---|---|---|
| Semi Detached House | £244,128.00 | 74 Semi Detached Houses |
| Detached House | £341,812.00 | 32 Detached Houses |
| Terraced House | £234,934.00 | 42 Terraced Houses |
| Flat | £100,000.00 | 1 Flat |

