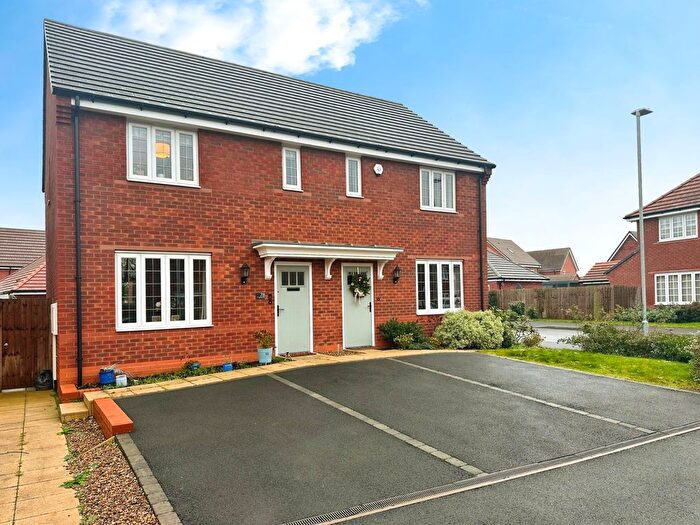
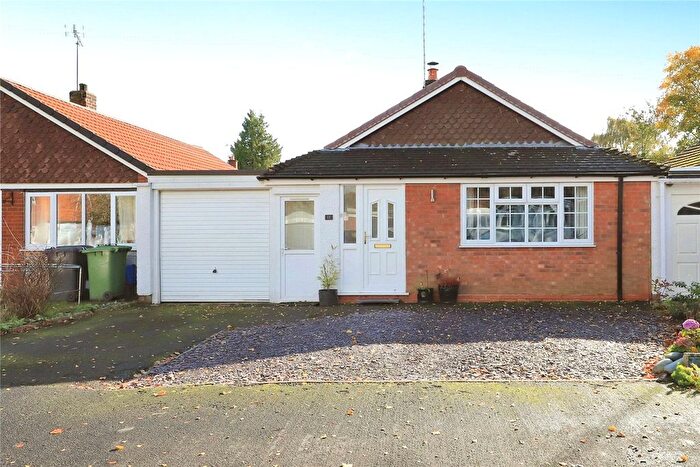
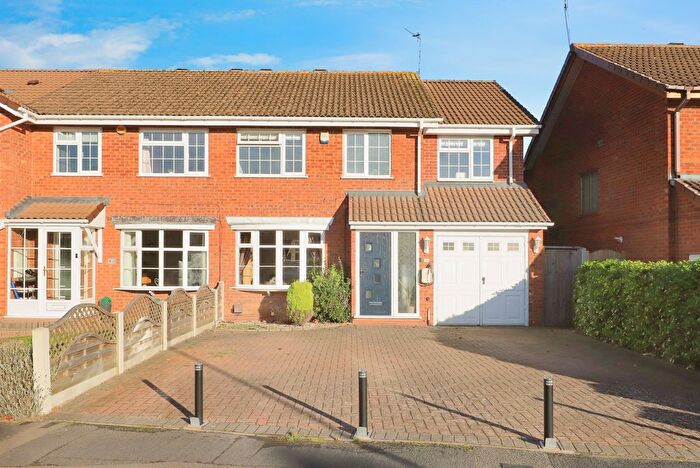
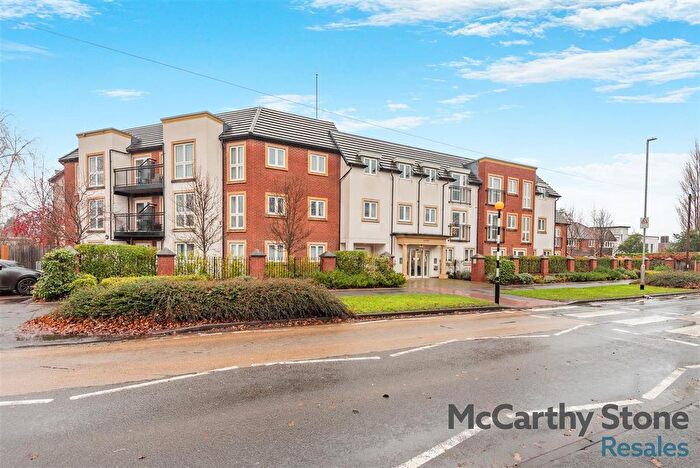
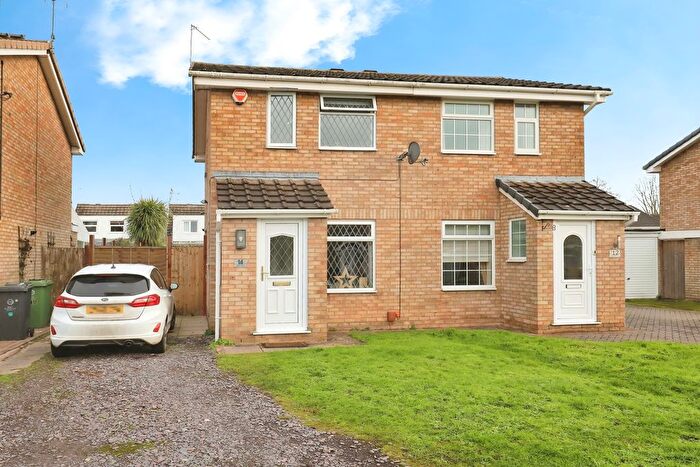
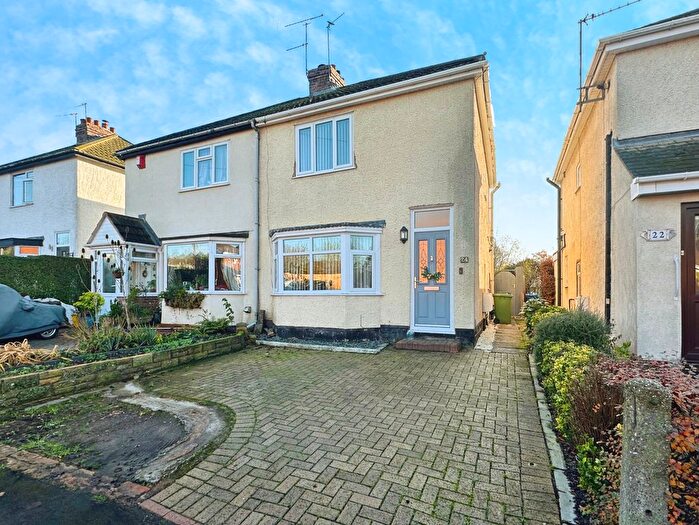
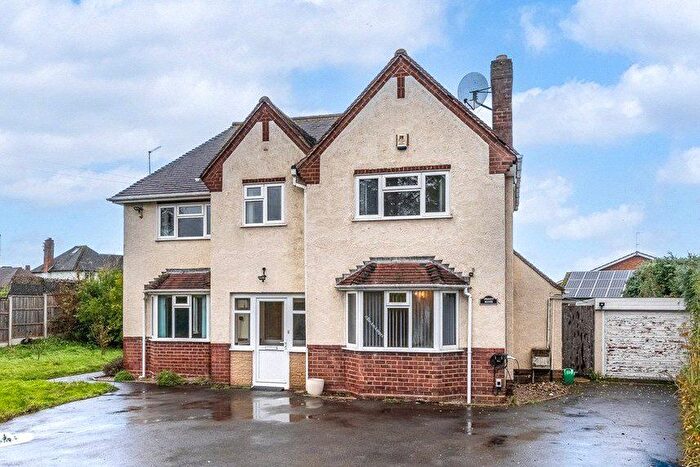
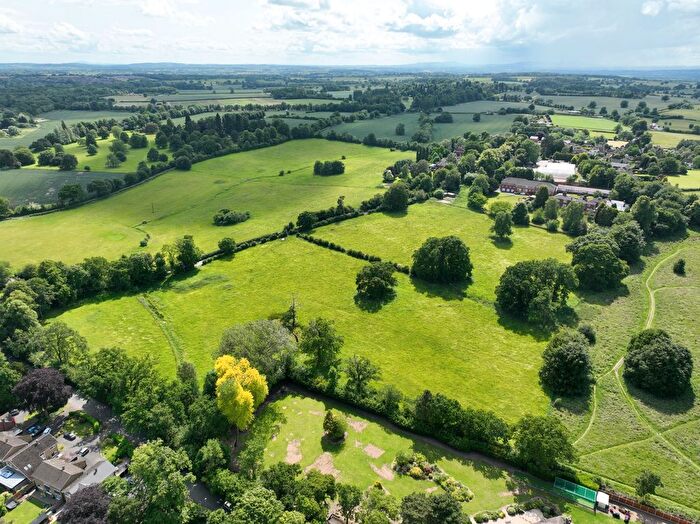
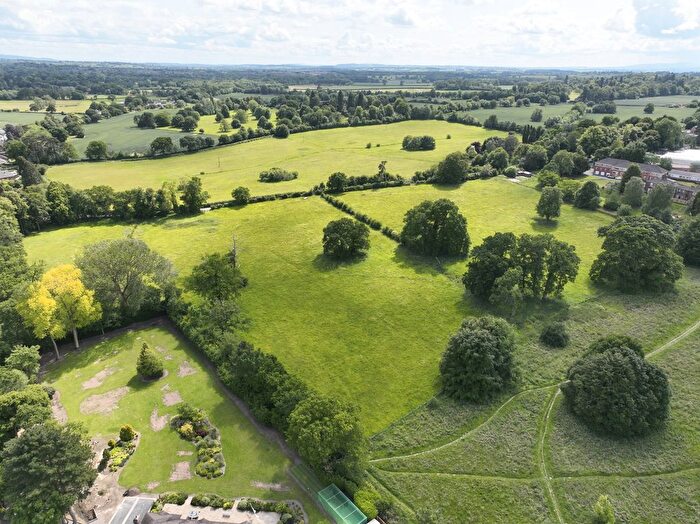
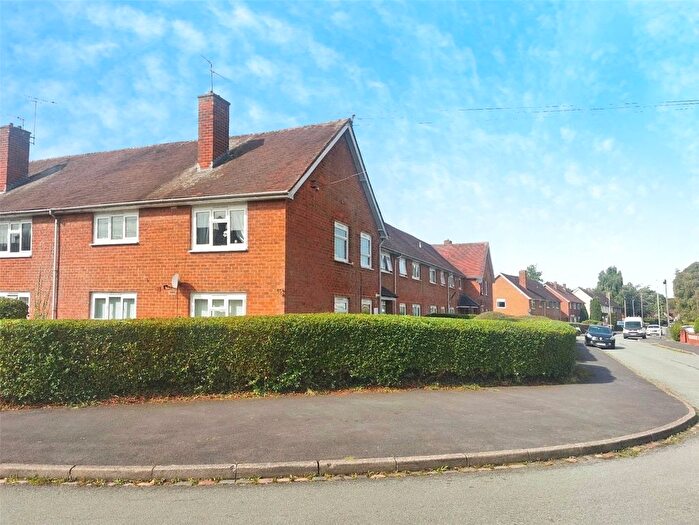
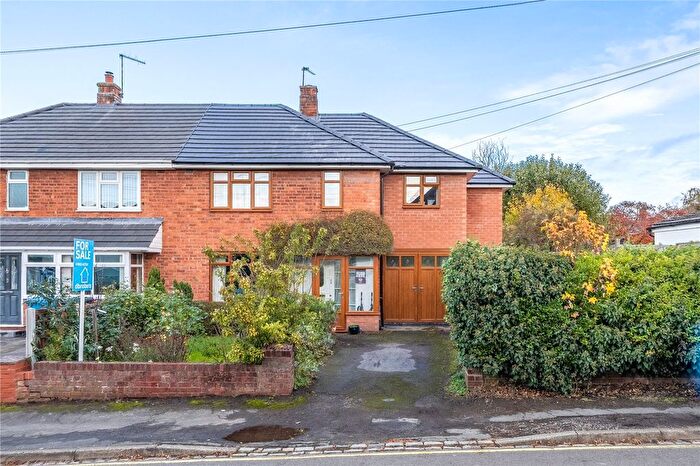
Houses for sale & to rent in Codsall South, Wolverhampton
House Prices in Codsall South
Properties in Codsall South have an average house price of £379,146.00 and had 201 Property Transactions within the last 3 years¹.
Codsall South is an area in Wolverhampton, Staffordshire with 1,634 households², where the most expensive property was sold for £925,000.00.
Properties for sale in Codsall South
Previously listed properties in Codsall South
Roads and Postcodes in Codsall South
Navigate through our locations to find the location of your next house in Codsall South, Wolverhampton for sale or to rent.
| Streets | Postcodes |
|---|---|
| Acorn Grove | WV8 2AU |
| Beech Gardens | WV8 2BU |
| Birches Avenue | WV8 2JG |
| Birches Park Road | WV8 2DT |
| Birches Road | WV8 2JE WV8 2JF WV8 2JJ WV8 2JP WV8 2JQ WV8 2JR WV8 2JW |
| Broadway | WV8 2EL |
| Chapel Lane | WV8 2EH WV8 2EJ |
| Charters Avenue | WV8 2JH |
| Chestnut Close | WV8 2EZ |
| Codsall Road | WV6 9QG WV8 2LA |
| County Lane | WV7 3AH |
| Dam Mill Close | WV8 1TZ |
| Eastward Glen | WV8 2JB |
| Farway Gardens | WV8 2QA |
| Greenacre Drive | WV8 2JA |
| Hawthorne Lane | WV8 2DA |
| Heath House Lane | WV8 2DD WV8 2HW |
| Heathfields | WV8 2HF |
| Histons Drive | WV8 2ET |
| Histons Hill | WV8 2AP WV8 2ER WV8 2ES WV8 2EW WV8 2EY WV8 2HA |
| Hollybush Lane | WV8 2AT |
| Holyhead Road | WV8 2HX |
| Keepers Lane | WV8 1QJ WV8 2DP WV8 2DR WV8 2DW |
| Kingsley Gardens | WV8 2AJ |
| Kynaston Crescent | WV8 2JL |
| Lane Green Avenue | WV8 2JT |
| Lane Green Road | WV8 2JS WV8 2JU WV8 2JZ |
| Lansdowne Avenue | WV8 2EN |
| Long Acre | WV8 2EG |
| Madeira Avenue | WV8 2DS |
| Meadow Way | WV8 2AS |
| Meadowvale | WV8 2LB |
| Middle Lane | WV8 2BE |
| Oaken Covert | WV8 2BG |
| Oaken Drive | WV8 2AZ WV8 2EE |
| Oaken Grove | WV8 2AL |
| Oaken Lane | WV8 2BD WV8 2LD |
| Oaken Lanes | WV8 2AH WV8 2AN WV8 2AQ WV8 2AR WV8 2AW |
| Oaken Lawn | WV7 3AL |
| Oaken Park | WV8 2BW |
| Palmers Close | WV8 2JX |
| Palmers Way | WV8 2JY |
| Parkes Avenue | WV8 2DU WV8 2DX |
| Pine Walk | WV8 2HB |
| Popes Lane | WV6 8TX |
| Poplars Drive | WV8 2BX |
| Princes Drive | WV8 2DJ |
| Princes Gardens | WV8 2DH WV8 2DL |
| Queens Gardens | WV8 2EP |
| Red Rock Drive | WV8 2EU |
| Shop Lane | WV8 2AX |
| South View Close | WV8 2JD |
| Stafford Lane | WV8 2HN |
| Station Road | WV8 1BZ |
| Strawmoor Lane | WV8 2HY |
| Suckling Green Lane | WV8 2BL WV8 2BP WV8 2BT WV8 2BY WV8 2BZ WV8 2DN |
| The Drive | WV8 2EB |
| The Fold | WV8 2BB |
| The Paddock | WV8 2BN |
| Wayside Acres | WV8 2BS |
| Wergs Hall Road | WV8 2DB WV8 2HG WV8 2HH WV8 2HJ WV8 2HQ |
| Windsor Gardens | WV8 2EX |
| WV8 2AY WV8 2BA |
Transport near Codsall South
- FAQ
- Price Paid By Year
- Property Type Price
Frequently asked questions about Codsall South
What is the average price for a property for sale in Codsall South?
The average price for a property for sale in Codsall South is £379,146. This amount is 20% higher than the average price in Wolverhampton. There are 482 property listings for sale in Codsall South.
What streets have the most expensive properties for sale in Codsall South?
The streets with the most expensive properties for sale in Codsall South are Lansdowne Avenue at an average of £590,357, Oaken Lanes at an average of £580,571 and Wayside Acres at an average of £542,500.
What streets have the most affordable properties for sale in Codsall South?
The streets with the most affordable properties for sale in Codsall South are Dam Mill Close at an average of £165,611, Lane Green Road at an average of £204,285 and Palmers Way at an average of £218,500.
Which train stations are available in or near Codsall South?
Some of the train stations available in or near Codsall South are Bilbrook, Codsall and Albrighton.
Property Price Paid in Codsall South by Year
The average sold property price by year was:
| Year | Average Sold Price | Price Change |
Sold Properties
|
|---|---|---|---|
| 2025 | £385,860 | -0,4% |
35 Properties |
| 2024 | £387,523 | 3% |
57 Properties |
| 2023 | £376,510 | 2% |
46 Properties |
| 2022 | £369,762 | 8% |
63 Properties |
| 2021 | £339,734 | 2% |
89 Properties |
| 2020 | £332,507 | 1% |
61 Properties |
| 2019 | £329,227 | 11% |
72 Properties |
| 2018 | £292,733 | 4% |
56 Properties |
| 2017 | £281,926 | -1% |
57 Properties |
| 2016 | £285,068 | 18% |
56 Properties |
| 2015 | £235,089 | -14% |
71 Properties |
| 2014 | £268,673 | 8% |
65 Properties |
| 2013 | £248,321 | -11% |
47 Properties |
| 2012 | £275,987 | 13% |
49 Properties |
| 2011 | £240,444 | -5% |
39 Properties |
| 2010 | £252,608 | 6% |
36 Properties |
| 2009 | £236,440 | 19% |
46 Properties |
| 2008 | £191,608 | -34% |
55 Properties |
| 2007 | £257,683 | 4% |
61 Properties |
| 2006 | £246,963 | 5% |
65 Properties |
| 2005 | £233,575 | 2% |
80 Properties |
| 2004 | £228,172 | 11% |
95 Properties |
| 2003 | £203,127 | 13% |
72 Properties |
| 2002 | £176,008 | 16% |
67 Properties |
| 2001 | £148,027 | 14% |
59 Properties |
| 2000 | £127,262 | 9% |
54 Properties |
| 1999 | £115,811 | 2% |
76 Properties |
| 1998 | £113,010 | 10% |
74 Properties |
| 1997 | £102,039 | -1% |
50 Properties |
| 1996 | £102,659 | 2% |
74 Properties |
| 1995 | £100,457 | - |
64 Properties |
Property Price per Property Type in Codsall South
Here you can find historic sold price data in order to help with your property search.
The average Property Paid Price for specific property types in the last three years are:
| Property Type | Average Sold Price | Sold Properties |
|---|---|---|
| Semi Detached House | £319,045.00 | 70 Semi Detached Houses |
| Detached House | £481,294.00 | 93 Detached Houses |
| Terraced House | £251,160.00 | 25 Terraced Houses |
| Flat | £218,150.00 | 13 Flats |

