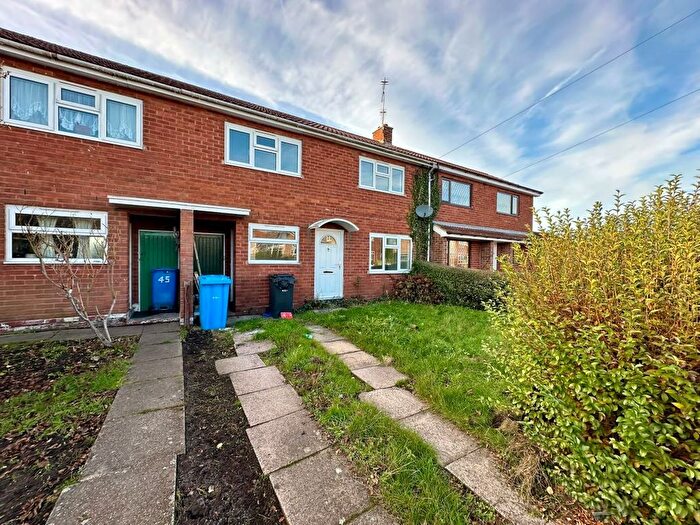
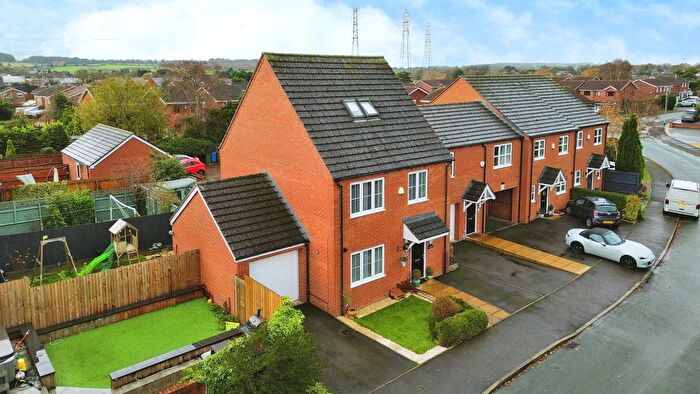
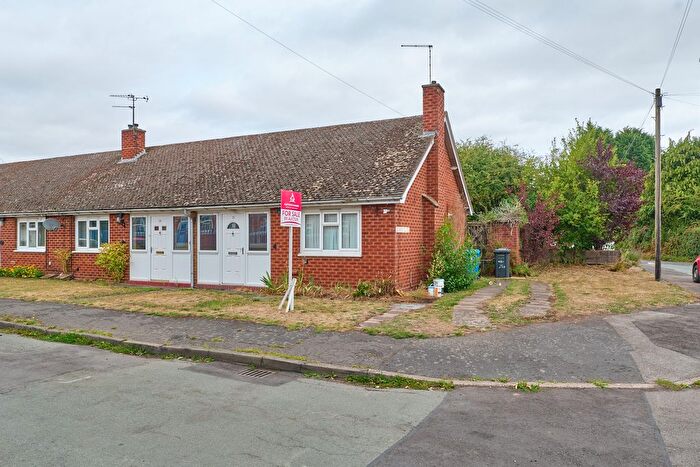
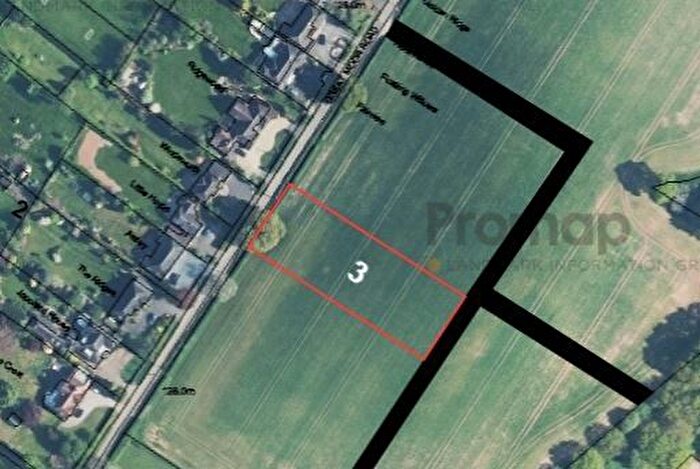
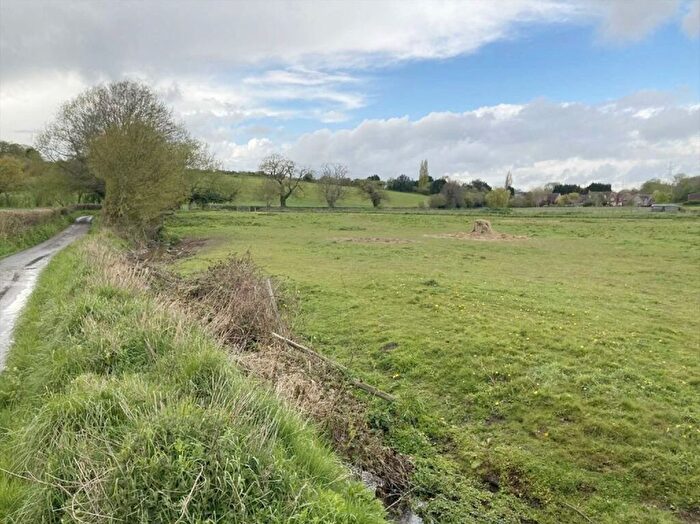
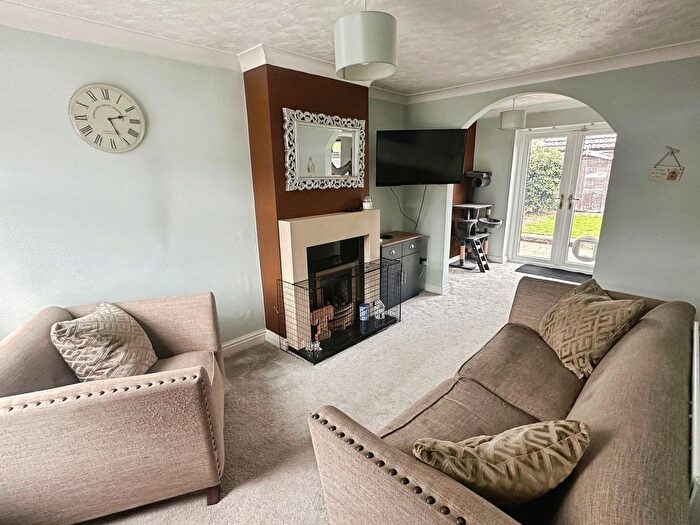
Houses for sale & to rent in Trysull And Seisdon, Wolverhampton
House Prices in Trysull And Seisdon
Properties in Trysull And Seisdon have an average house price of £593,868.00 and had 41 Property Transactions within the last 3 years¹.
Trysull And Seisdon is an area in Wolverhampton, Staffordshire with 447 households², where the most expensive property was sold for £1,985,000.00.
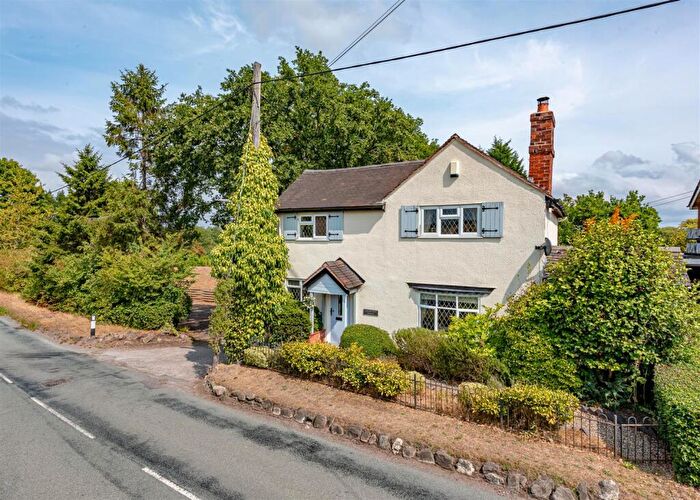
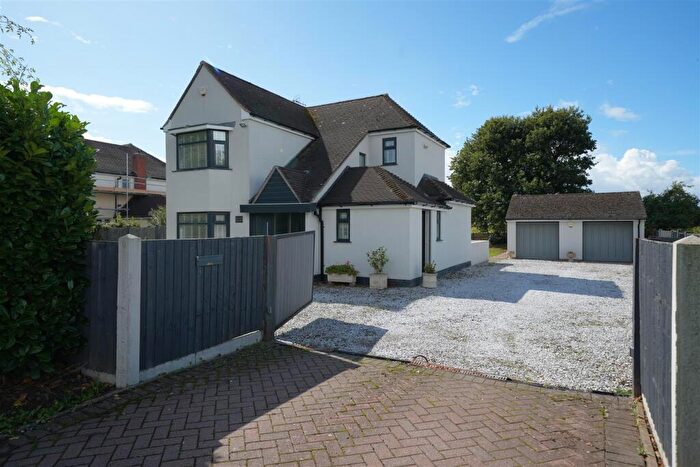
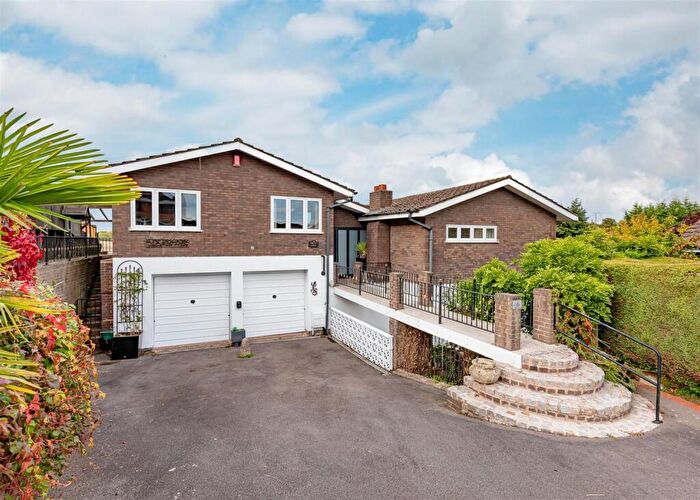
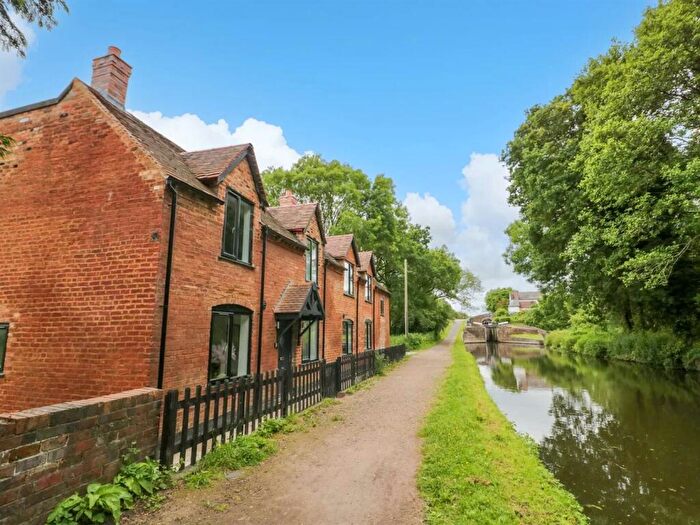
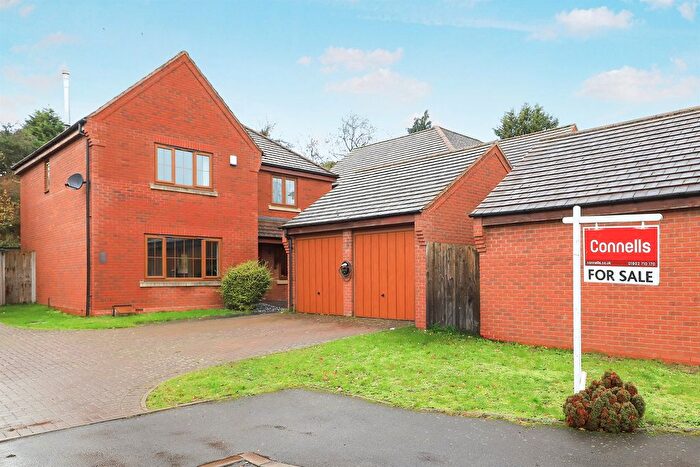
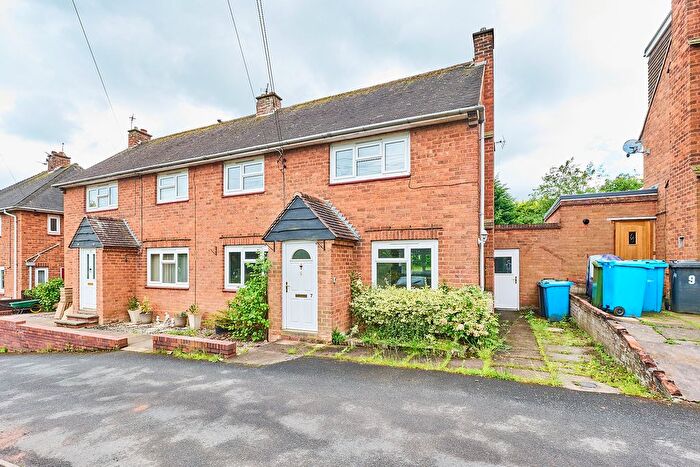
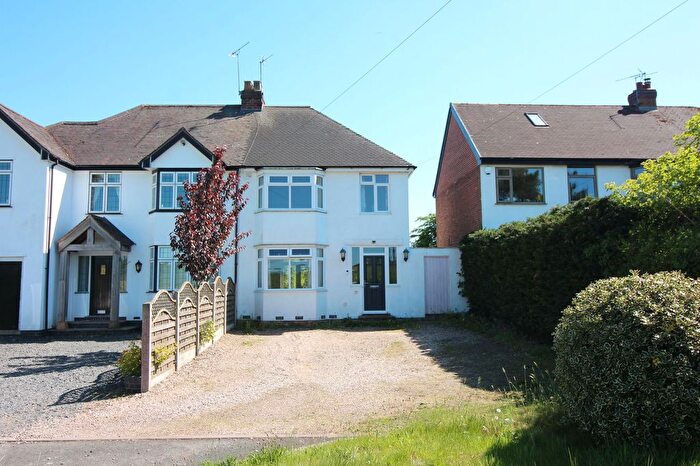
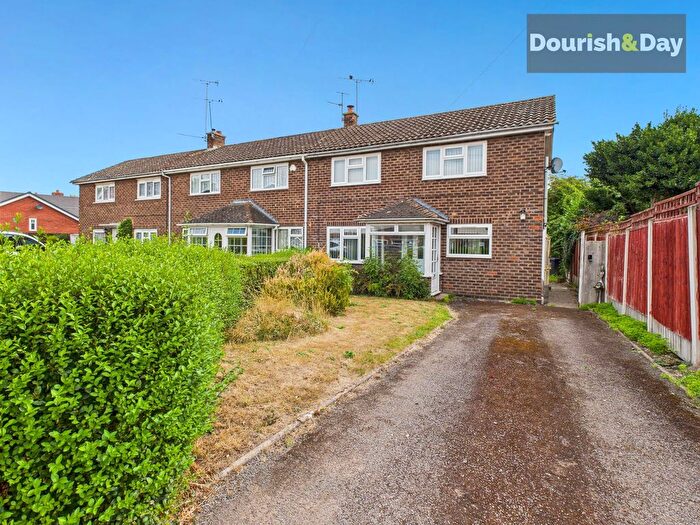
Properties for sale in Trysull And Seisdon
Previously listed properties in Trysull And Seisdon
Roads and Postcodes in Trysull And Seisdon
Navigate through our locations to find the location of your next house in Trysull And Seisdon, Wolverhampton for sale or to rent.
| Streets | Postcodes |
|---|---|
| Beech House Lane | WV5 7EP |
| Beech Hurst Gardens | WV5 7HQ |
| Bell Road | WV5 7JB |
| Bridgnorth Road | WV5 8AY WV6 7EH WV6 7EZ WV6 7EJ WV6 7HA |
| Church Lane | WV5 7EZ |
| Clap Gate Road | WV5 8DB |
| Crockington Close | WV5 7EL |
| Crockington Lane | WV5 7EJ WV5 7EN |
| Ebstree Meadow | WV5 7JJ |
| Ebstree Road | WV5 7ES |
| Feiashill Close | WV5 7JQ |
| Feiashill Road | WV5 7HN WV5 7HT |
| Fox Close | WV5 7HE |
| Fox Road | WV5 7HD WV6 7EL |
| Lower Lanes Meadow | WV5 7HH |
| Oak Drive | WV5 7ET |
| Post Office Road | WV5 7HA |
| School Close | WV5 7HS |
| School Road | WV5 7HR |
| Seisdon Hollaway | WV5 7EY |
| Seisdon Road | WV5 7ER WV5 7JF |
| The Beeches | WV5 7EU |
| The Fold | WV5 7EX |
| The Green | WV5 7HW |
| The Millpool | WV5 7EG |
| Tinkers Castle Road | WV5 7HF |
| Trysull Holloway | WV5 7JA |
| Union Lane | WV5 7JD |
| Wolmore Lane | WV5 7HG |
| Woodford Lane | WV5 7HP WV5 8DS |
Transport near Trysull And Seisdon
-
Wolverhampton Station
-
Bilbrook Station
-
Codsall Station
-
Coseley Station
-
Albrighton Station
-
Cosford Station
-
Tipton Station
-
Stourbridge Town Station
-
Lye Station
-
Dudley Port Station
- FAQ
- Price Paid By Year
- Property Type Price
Frequently asked questions about Trysull And Seisdon
What is the average price for a property for sale in Trysull And Seisdon?
The average price for a property for sale in Trysull And Seisdon is £593,868. This amount is 87% higher than the average price in Wolverhampton. There are 189 property listings for sale in Trysull And Seisdon.
What streets have the most expensive properties for sale in Trysull And Seisdon?
The streets with the most expensive properties for sale in Trysull And Seisdon are Union Lane at an average of £950,000, Post Office Road at an average of £761,361 and Ebstree Road at an average of £700,625.
What streets have the most affordable properties for sale in Trysull And Seisdon?
The streets with the most affordable properties for sale in Trysull And Seisdon are Fox Close at an average of £255,000, Lower Lanes Meadow at an average of £398,000 and Trysull Holloway at an average of £400,000.
Which train stations are available in or near Trysull And Seisdon?
Some of the train stations available in or near Trysull And Seisdon are Wolverhampton, Bilbrook and Codsall.
Property Price Paid in Trysull And Seisdon by Year
The average sold property price by year was:
| Year | Average Sold Price | Price Change |
Sold Properties
|
|---|---|---|---|
| 2025 | £549,000 | -1% |
15 Properties |
| 2024 | £557,041 | -21% |
12 Properties |
| 2023 | £673,508 | 25% |
14 Properties |
| 2022 | £501,916 | 3% |
9 Properties |
| 2021 | £486,633 | 26% |
15 Properties |
| 2020 | £362,125 | -4% |
16 Properties |
| 2019 | £378,400 | -13% |
15 Properties |
| 2018 | £428,760 | 2% |
19 Properties |
| 2017 | £420,494 | 10% |
19 Properties |
| 2016 | £377,597 | -14% |
20 Properties |
| 2015 | £429,767 | -4% |
14 Properties |
| 2014 | £445,857 | 30% |
7 Properties |
| 2013 | £310,875 | -53% |
12 Properties |
| 2012 | £474,431 | 35% |
11 Properties |
| 2011 | £307,437 | 16% |
8 Properties |
| 2010 | £257,818 | -11% |
8 Properties |
| 2009 | £285,000 | -12% |
7 Properties |
| 2008 | £320,016 | 7% |
6 Properties |
| 2007 | £296,095 | -40% |
10 Properties |
| 2006 | £415,535 | 26% |
14 Properties |
| 2005 | £307,501 | 0,5% |
15 Properties |
| 2004 | £306,114 | 24% |
17 Properties |
| 2003 | £233,880 | 2% |
13 Properties |
| 2002 | £229,559 | 13% |
16 Properties |
| 2001 | £200,090 | 3% |
10 Properties |
| 2000 | £193,810 | 31% |
21 Properties |
| 1999 | £134,285 | -19% |
14 Properties |
| 1998 | £160,385 | 3% |
22 Properties |
| 1997 | £155,340 | 25% |
16 Properties |
| 1996 | £116,389 | -9% |
14 Properties |
| 1995 | £126,487 | - |
7 Properties |
Property Price per Property Type in Trysull And Seisdon
Here you can find historic sold price data in order to help with your property search.
The average Property Paid Price for specific property types in the last three years are:
| Property Type | Average Sold Price | Sold Properties |
|---|---|---|
| Semi Detached House | £435,000.00 | 4 Semi Detached Houses |
| Detached House | £667,986.00 | 28 Detached Houses |
| Terraced House | £433,888.00 | 9 Terraced Houses |

