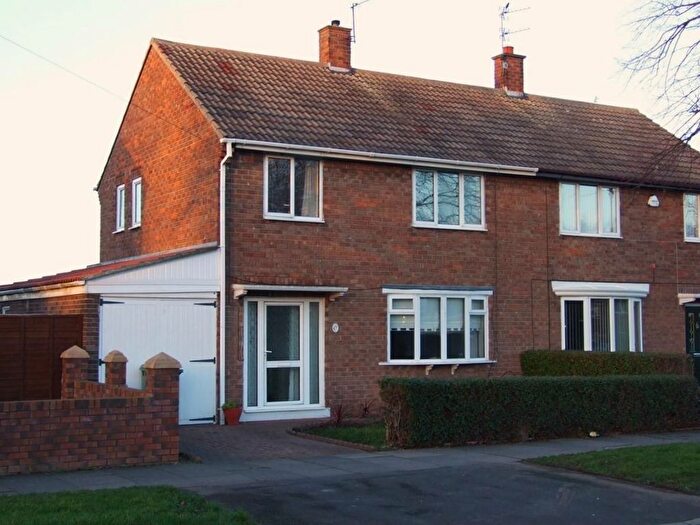
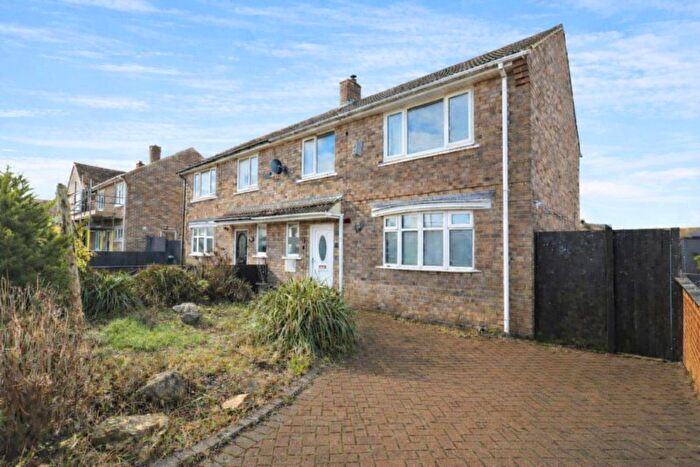
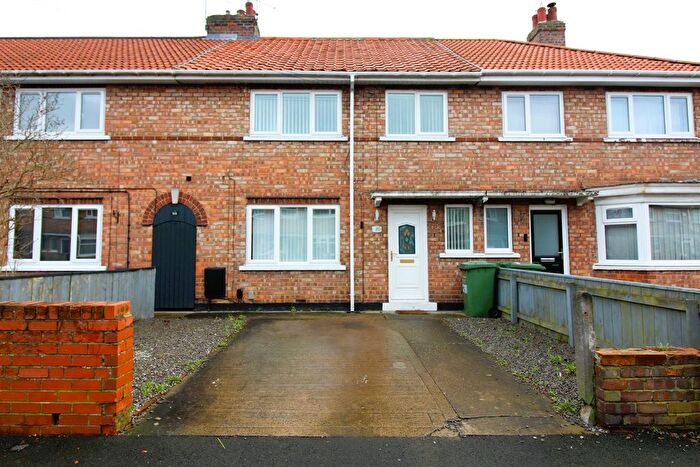
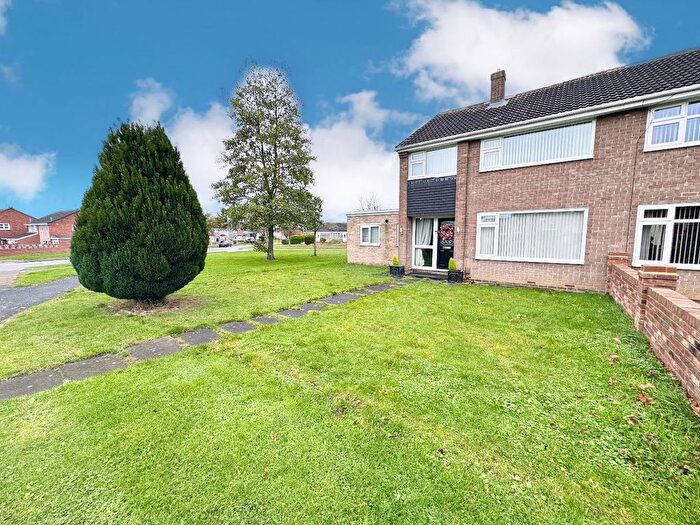
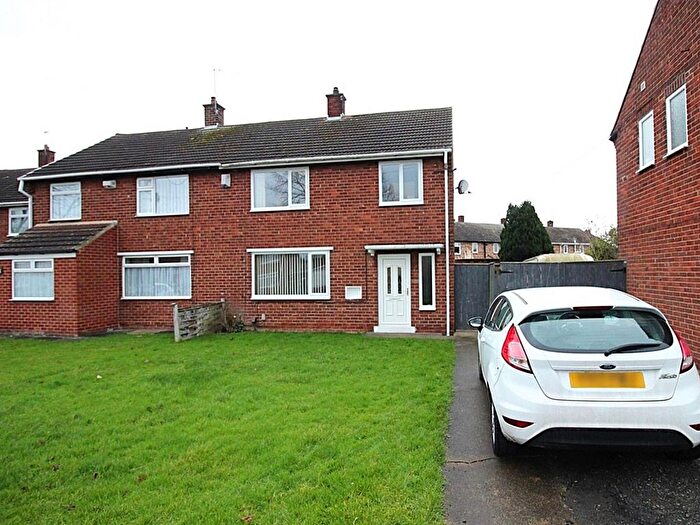
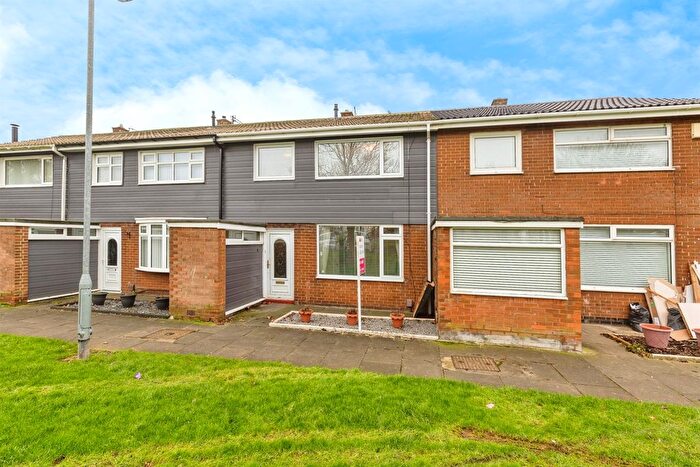
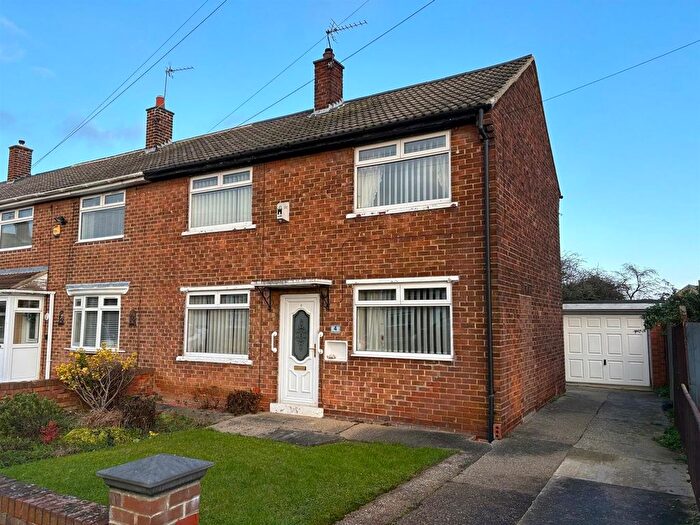
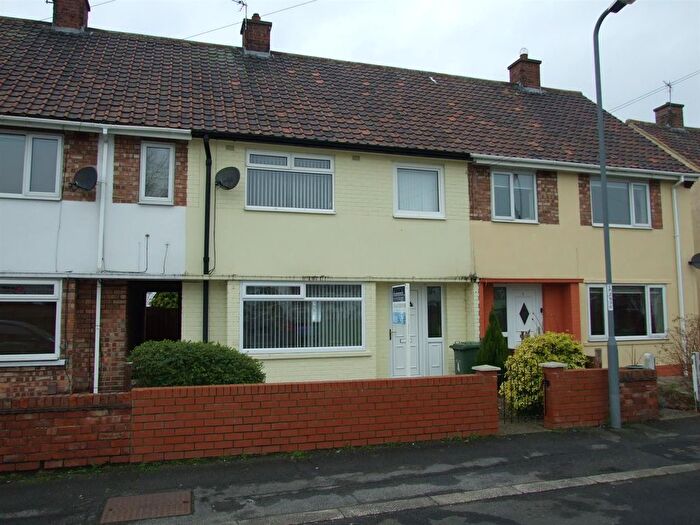
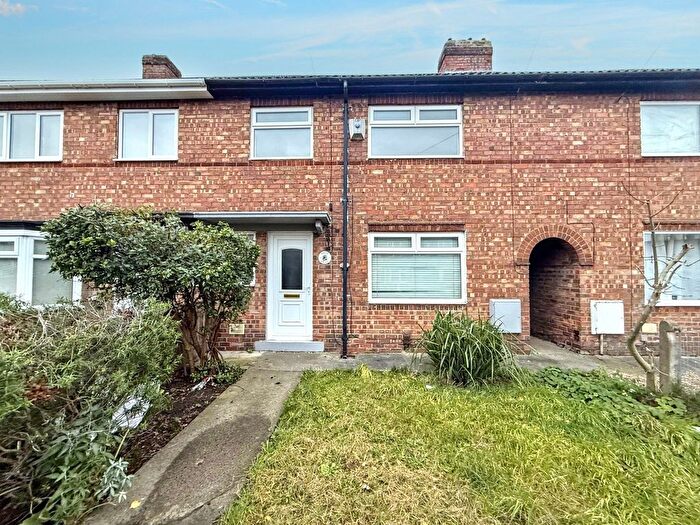
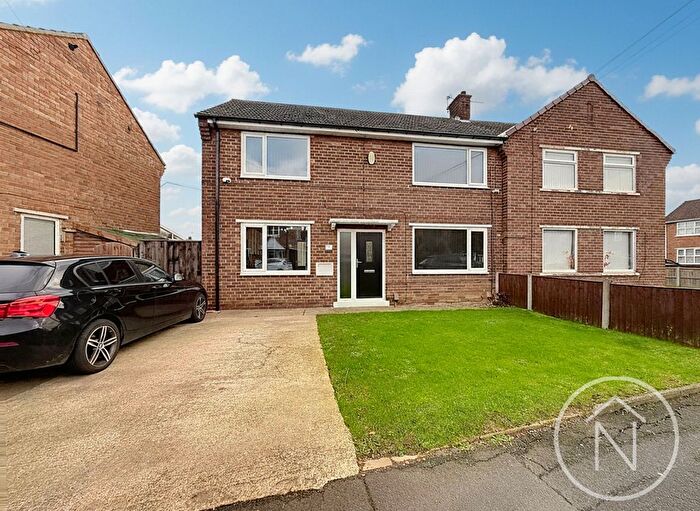
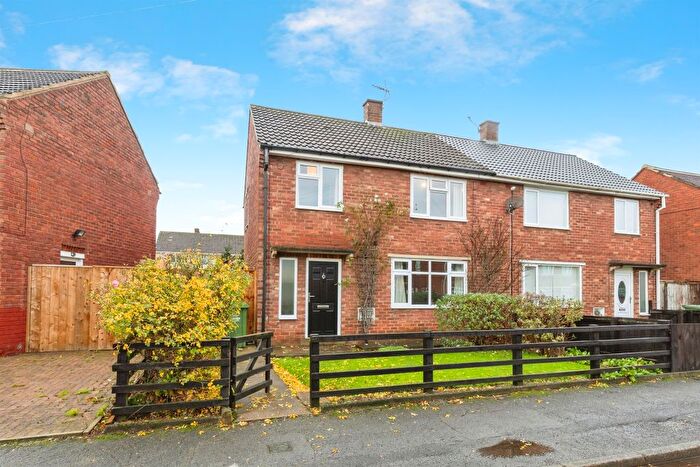
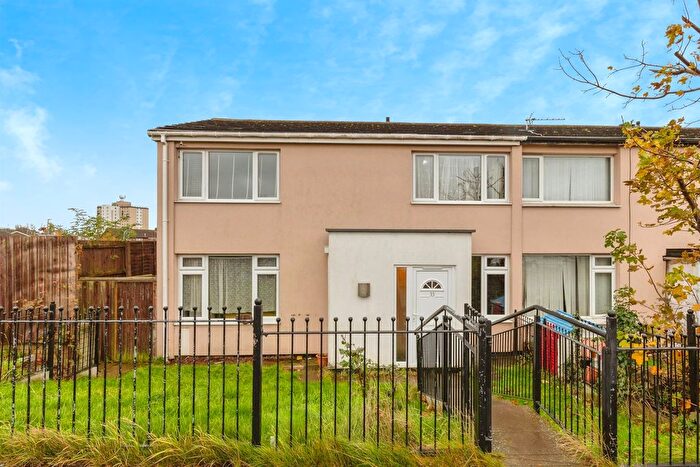
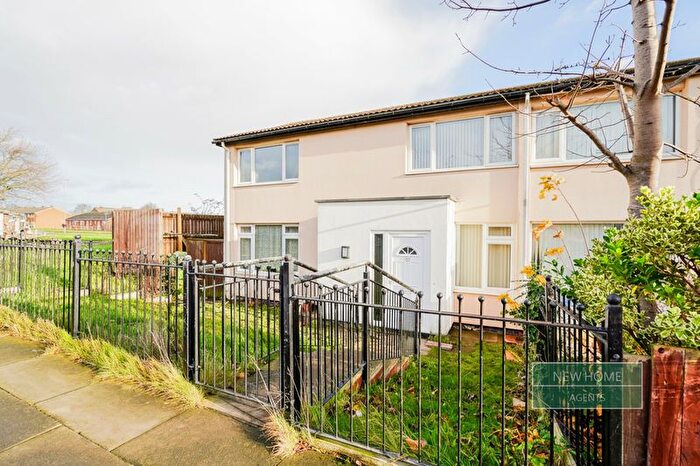
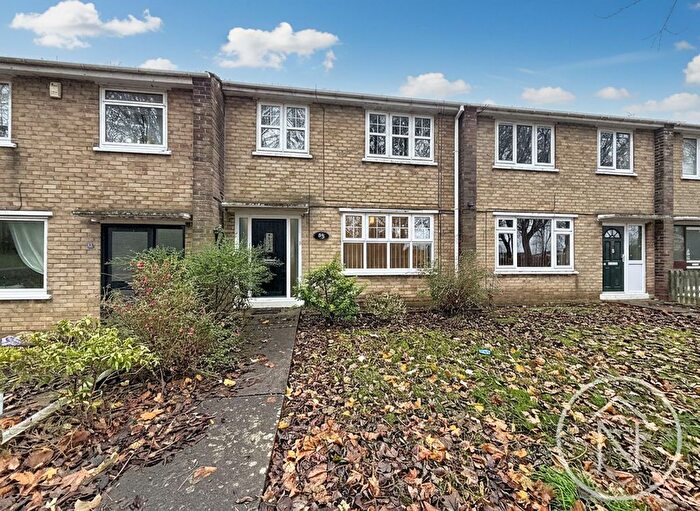
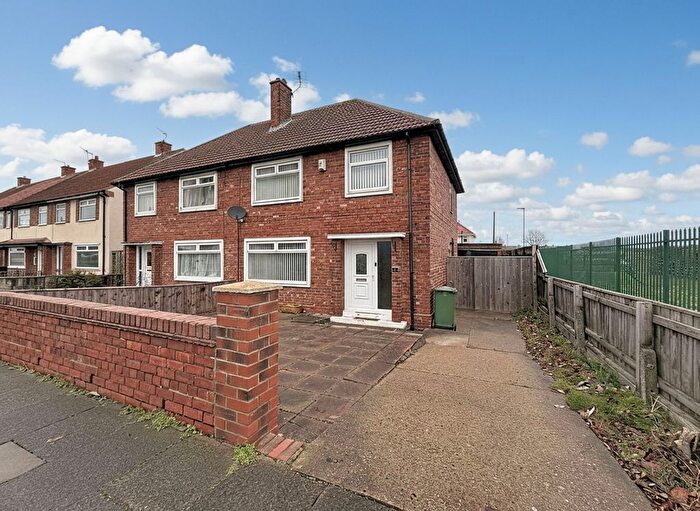
Houses for sale & to rent in Billingham East, Billingham
House Prices in Billingham East
Properties in Billingham East have an average house price of £101,798.00 and had 235 Property Transactions within the last 3 years¹.
Billingham East is an area in Billingham, Stockton-on-Tees with 2,993 households², where the most expensive property was sold for £583,994.00.
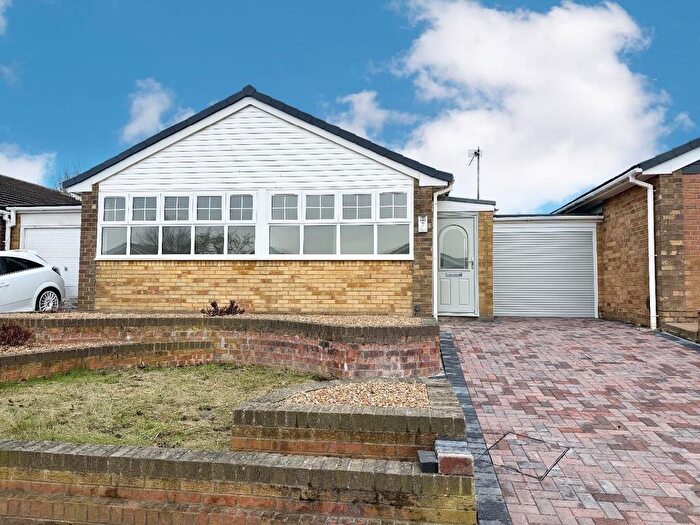
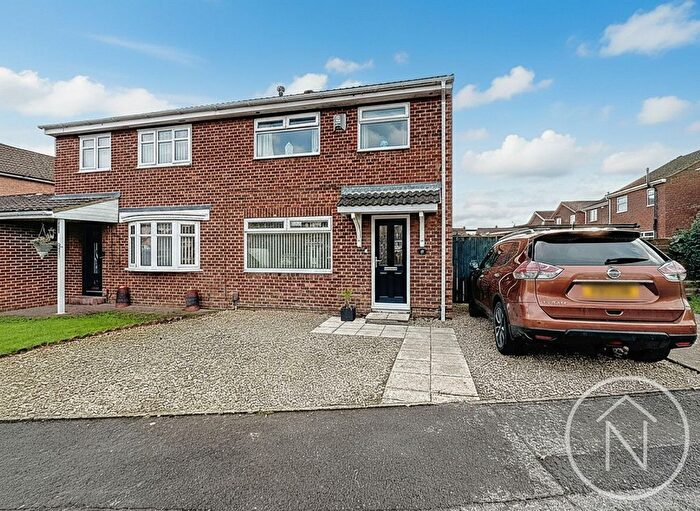
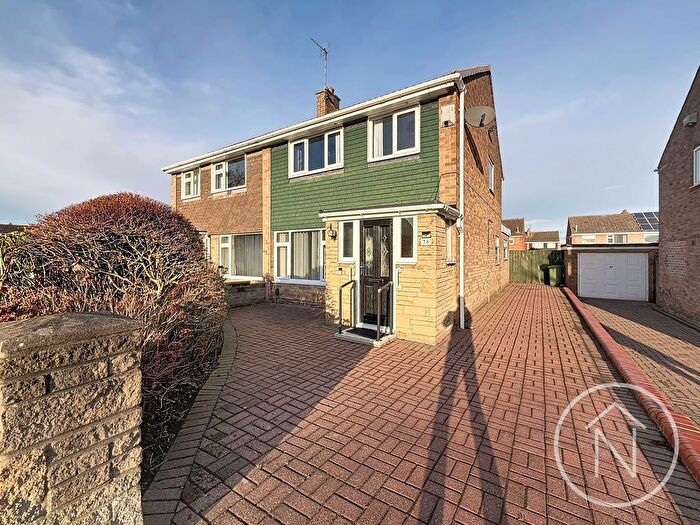
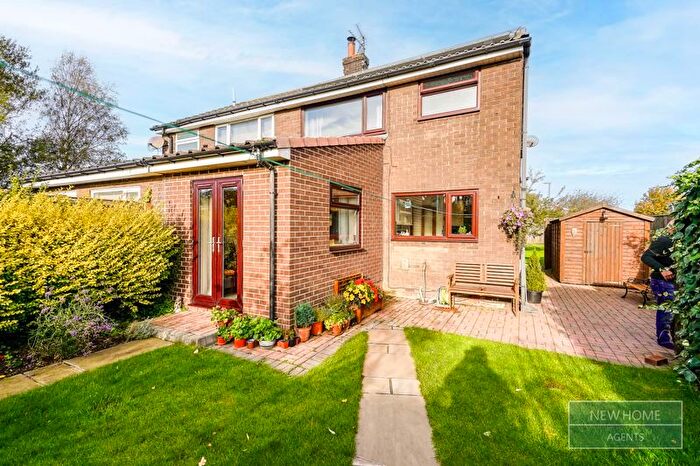
Properties for sale in Billingham East
Previously listed properties in Billingham East
Roads and Postcodes in Billingham East
Navigate through our locations to find the location of your next house in Billingham East, Billingham for sale or to rent.
| Streets | Postcodes |
|---|---|
| Alvis Close | TS23 4JB |
| Alvis Court | TS23 4JG |
| Ampleforth Road | TS23 3AW |
| Ashdown Way | TS23 3EF |
| Bannockburn Way | TS23 3QL TS23 3QN TS23 3QP TS23 3QW TS23 3QR |
| Barnet Way | TS23 3LS |
| Beamish Road | TS23 3DT TS23 3DU TS23 3DY TS23 3DX |
| Beaumont Park | TS23 4HF |
| Bedford Terrace | TS23 4AE TS23 4AF |
| Belasis Avenue | TS23 1LQ |
| Bentley Avenue | TS23 4BU |
| Blackwell Close | TS23 3DZ |
| Blakeston Road | TS23 3JL |
| Bosworth Way | TS23 3PA |
| Bowhill Way | TS23 3LN TS23 3LP |
| Bradley Court | TS23 3DB |
| Bylands Way | TS23 4EB |
| Charlton Close | TS23 4DG |
| Coleshill Close | TS23 3AG |
| Colmans Nook | TS23 4EG |
| Cornwall Crescent | TS23 4BG TS23 4BQ |
| Cowpen Bewley Road | TS23 4HR |
| Cowpen Lane | TS23 4AB TS23 4AD TS23 4AP TS23 4AR TS23 4AS TS23 4AT TS23 4BT TS23 4BW TS23 4HU TS23 4DB TS23 4DD TS23 4JE |
| Coxhoe Road | TS23 3BL |
| Coxwold Way | TS23 4EA |
| Croxdale Road | TS23 3DD |
| Culloden Way | TS23 3PD |
| Daimler Drive | TS23 4JD |
| Delaval Road | TS23 3BP TS23 3BS TS23 3BT TS23 3BU TS23 3BW TS23 3BX |
| Devon Crescent | TS23 4BP TS23 4BS |
| Dinsdale Court | TS23 3DW |
| Dorset Crescent | TS23 4AU TS23 4AX |
| Earls Nook | TS23 4EF |
| Edgehill Way | TS23 3LE |
| Egglestone Court | TS23 3DE |
| Elemere Court | TS23 3EW |
| Essex Crescent | TS23 4AN TS23 4AW |
| Evesham Way | TS23 3LW |
| Flodden Way | TS23 3LF TS23 3LG TS23 3LQ |
| Fulbeck Court | TS23 3HS |
| Gainford Road | TS23 3HP TS23 3HW |
| Gilside Road | TS23 3HY TS23 3HZ TS23 3JB TS23 3JD |
| Gisburn Road | TS23 3JA |
| Gloucester Terrace | TS23 4BB TS23 4BD TS23 4BE |
| Greenwood Road | TS23 4AY TS23 4AZ TS23 4BA |
| Hale Road | TS23 3EP |
| Halidon Way | TS23 3NS |
| Hardwick Road | TS23 3JX |
| Hastings Way | TS23 3EB TS23 3ED |
| Hatfield Road | TS23 3AJ TS23 3AL TS23 3AP |
| Headlam Road | TS23 3DA |
| Hereford Terrace | TS23 4AA |
| Heswall Road | TS23 3HT |
| Hollinside Road | TS23 3JH |
| Horden Road | TS23 3BY |
| Hylton Road | TS23 3JJ TS23 3JT TS23 3JU |
| Kirby Close | TS23 3AX |
| Knole Road | TS23 3AH TS23 3AQ TS23 3AT TS23 3BE TS23 3BG TS23 3BH TS23 3BJ TS23 3BN TS23 3BQ TS23 3AD TS23 3AS |
| Lagonda Court | TS23 4JF |
| Lagonda Road | TS23 4JA |
| Lambton Road | TS23 3JG |
| Lansdown Way | TS23 3PE |
| Leeholme Gardens | TS23 3TJ |
| Leeholme Road | TS23 3TA |
| Lewes Way | TS23 3LT |
| Lincoln Crescent | TS23 4BH TS23 4BJ TS23 4BN TS23 4BL |
| Low Grange Avenue | TS23 3DL TS23 3DN TS23 3DP TS23 3DR TS23 3EG TS23 3EH TS23 3EJ TS23 3LL TS23 3PB TS23 3PF TS23 3PH TS23 3EA TS23 3EQ TS23 3LH TS23 3NN TS23 3NR |
| Macklin Avenue | TS23 4BY TS23 4DU TS23 4ET |
| Manor Way | TS23 4HN |
| Marsh House Avenue | TS23 3AA TS23 3AB TS23 3EL TS23 3ES TS23 3DF TS23 3HB TS23 3TG |
| Melsonby Court | TS23 3PJ |
| Naseby Court | TS23 3LJ |
| Neasham Avenue | TS23 3NW TS23 3NX TS23 3QU TS23 3QX TS23 3QY TS23 3NU TS23 3QT |
| Nelson Avenue | TS23 4HA |
| Newburgh Court | TS23 4EE |
| Newbury Way | TS23 3NP TS23 3NT |
| Nuffield Road | TS23 4DA |
| Nutley Road | TS23 3AN |
| Otterburn Way | TS23 3QS |
| Penshurst Place | TS23 3AY TS23 3BB |
| Prior Court | TS23 3PL |
| Quenby Road | TS23 3AE TS23 3AF |
| Redworth Road | TS23 3JE TS23 3JF TS23 3JQ |
| Royce Avenue | TS23 4BX |
| Royce Court | TS23 4DE |
| Saunton Road | TS23 3HN TS23 3HR |
| Seal Sands Link Road | TS23 3NF |
| Sedgemoor Way | TS23 3PQ |
| Shotton Court | TS23 3BZ |
| Sledwick Road | TS23 3HU TS23 3HX |
| Stamford Court | TS23 3TP |
| Stanhope Road | TS23 3JY |
| Streatlam Road | TS23 3DS |
| Surrey Terrace | TS23 4AG TS23 4AQ |
| Sutton Place | TS23 3AZ TS23 3BA |
| The Linkway | TS23 3HH |
| The Moat | TS23 4ED |
| Veryan Road | TS23 3AR |
| Warwick Crescent | TS23 4AH TS23 4AL TS23 4AJ |
| Westholme Court | TS23 3JR |
| Windlestone Road | TS23 3JN TS23 3JW TS23 3JP |
| Witton Court | TS23 3JS |
| Wollaton Road | TS23 3AU TS23 3BD |
| Wolviston Back Lane | TS23 3LR TS23 4HW |
| TS23 4HS |
Transport near Billingham East
-
Billingham Station
-
Middlesbrough Station
-
Stockton Station
-
Thornaby Station
-
South Bank Station
-
Seaton Carew Station
-
James Cook University Hospital Station
- FAQ
- Price Paid By Year
- Property Type Price
Frequently asked questions about Billingham East
What is the average price for a property for sale in Billingham East?
The average price for a property for sale in Billingham East is £101,798. This amount is 44% lower than the average price in Billingham. There are 404 property listings for sale in Billingham East.
What streets have the most expensive properties for sale in Billingham East?
The streets with the most expensive properties for sale in Billingham East are Charlton Close at an average of £163,750, Newbury Way at an average of £151,515 and Leeholme Gardens at an average of £134,100.
What streets have the most affordable properties for sale in Billingham East?
The streets with the most affordable properties for sale in Billingham East are Halidon Way at an average of £54,000, Otterburn Way at an average of £64,083 and Kirby Close at an average of £71,125.
Which train stations are available in or near Billingham East?
Some of the train stations available in or near Billingham East are Billingham, Middlesbrough and Stockton.
Property Price Paid in Billingham East by Year
The average sold property price by year was:
| Year | Average Sold Price | Price Change |
Sold Properties
|
|---|---|---|---|
| 2025 | £106,192 | 6% |
79 Properties |
| 2024 | £99,689 | 0,3% |
84 Properties |
| 2023 | £99,437 | -3% |
72 Properties |
| 2022 | £102,554 | 9% |
92 Properties |
| 2021 | £93,225 | 16% |
105 Properties |
| 2020 | £78,513 | 2% |
80 Properties |
| 2019 | £77,150 | -1% |
80 Properties |
| 2018 | £77,790 | -8% |
77 Properties |
| 2017 | £83,914 | 10% |
62 Properties |
| 2016 | £75,227 | -10% |
70 Properties |
| 2015 | £82,700 | 7% |
67 Properties |
| 2014 | £76,546 | -2% |
62 Properties |
| 2013 | £78,002 | 8% |
57 Properties |
| 2012 | £71,419 | -18% |
39 Properties |
| 2011 | £84,544 | -12% |
46 Properties |
| 2010 | £94,525 | 9% |
72 Properties |
| 2009 | £85,877 | -6% |
56 Properties |
| 2008 | £90,617 | -9% |
57 Properties |
| 2007 | £98,371 | 6% |
143 Properties |
| 2006 | £92,910 | 18% |
130 Properties |
| 2005 | £76,639 | 8% |
111 Properties |
| 2004 | £70,400 | 32% |
154 Properties |
| 2003 | £47,743 | 22% |
128 Properties |
| 2002 | £37,426 | 11% |
147 Properties |
| 2001 | £33,210 | 3% |
100 Properties |
| 2000 | £32,254 | 1% |
69 Properties |
| 1999 | £32,038 | -9% |
65 Properties |
| 1998 | £34,791 | 13% |
66 Properties |
| 1997 | £30,332 | -9% |
77 Properties |
| 1996 | £33,184 | 0,2% |
52 Properties |
| 1995 | £33,103 | - |
52 Properties |
Property Price per Property Type in Billingham East
Here you can find historic sold price data in order to help with your property search.
The average Property Paid Price for specific property types in the last three years are:
| Property Type | Average Sold Price | Sold Properties |
|---|---|---|
| Flat | £83,400.00 | 5 Flats |
| Semi Detached House | £105,054.00 | 104 Semi Detached Houses |
| Detached House | £215,000.00 | 4 Detached Houses |
| Terraced House | £96,065.00 | 122 Terraced Houses |

