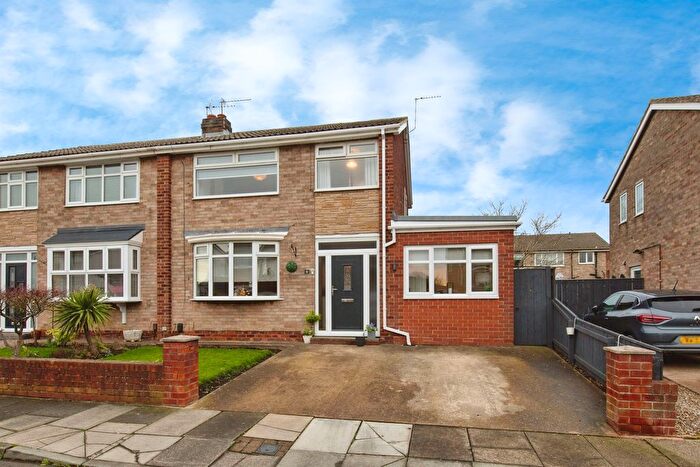
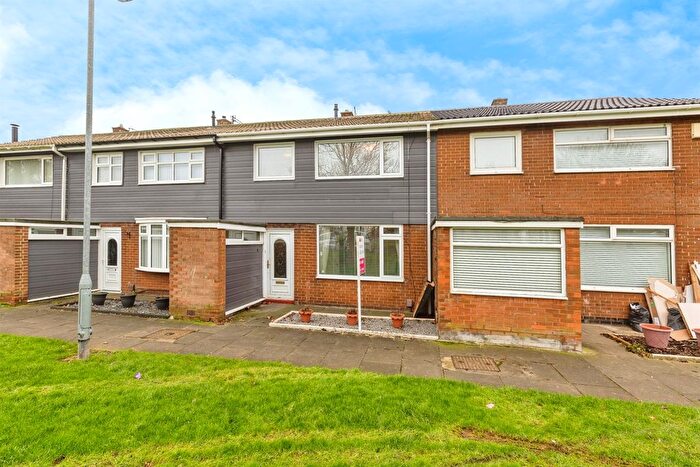
Houses for sale & to rent in Billingham South, Billingham
House Prices in Billingham South
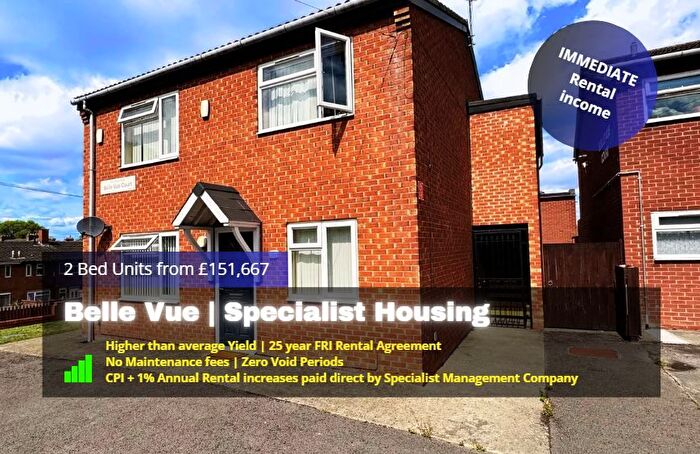
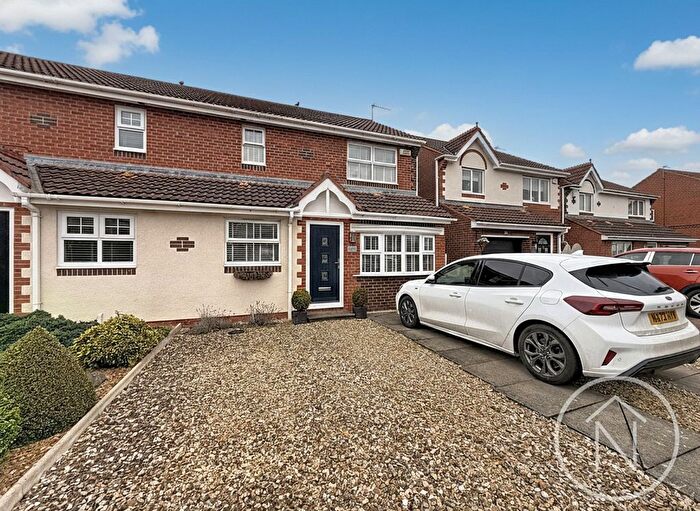
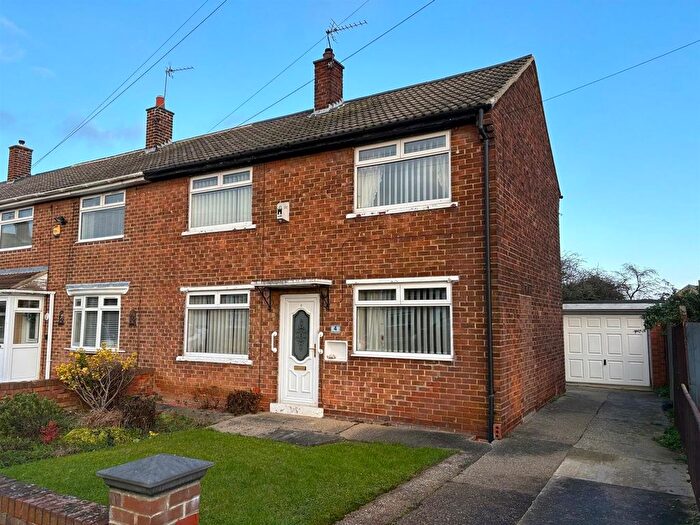
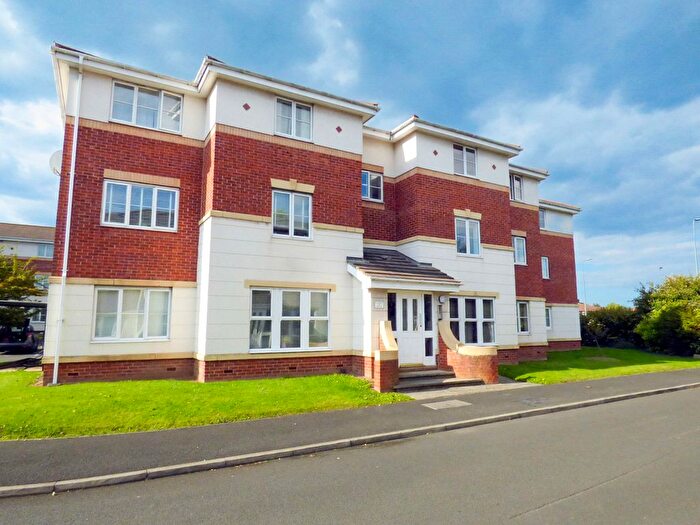
Properties in Billingham South have an average house price of £136,551.00 and had 206 Property Transactions within the last 3 years¹.
Billingham South is an area in Billingham, Stockton-on-Tees with 2,431 households², where the most expensive property was sold for £350,000.00.
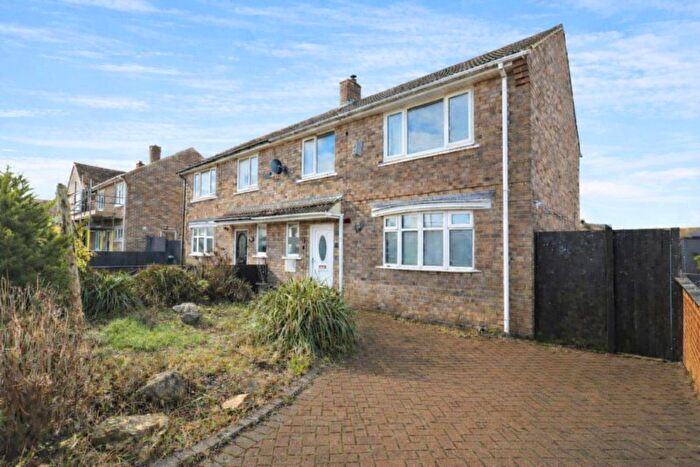
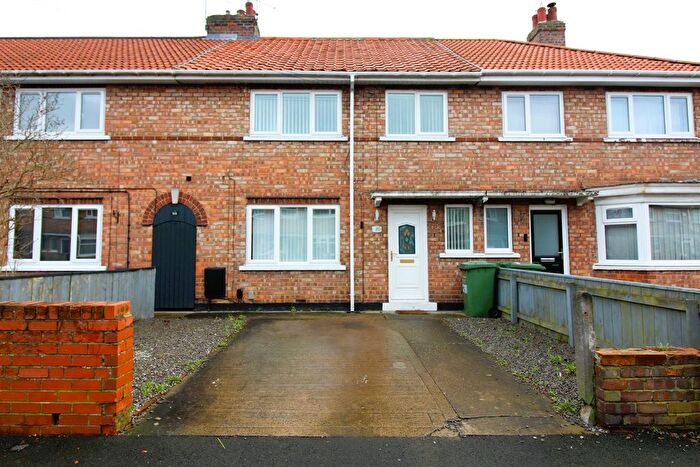
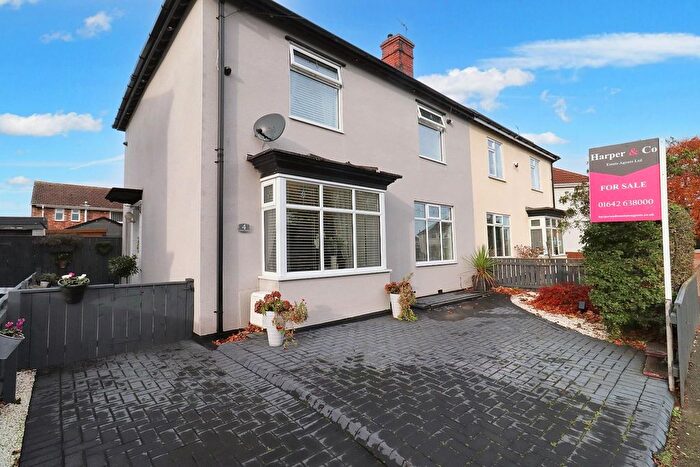
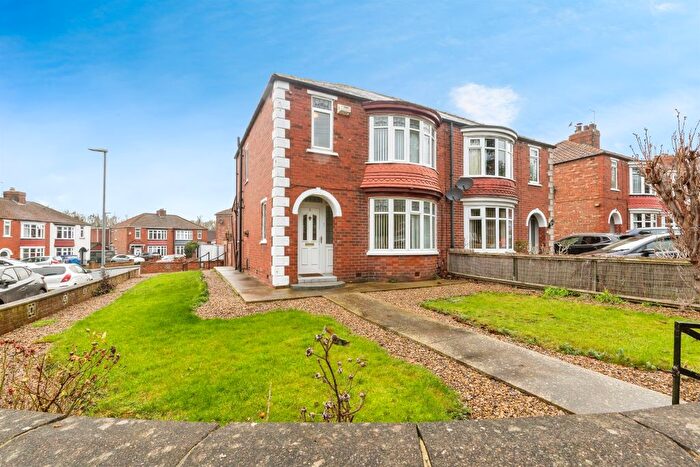
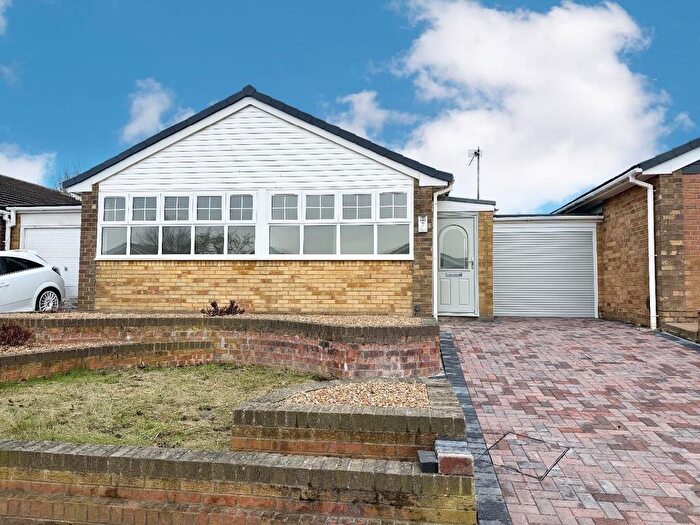
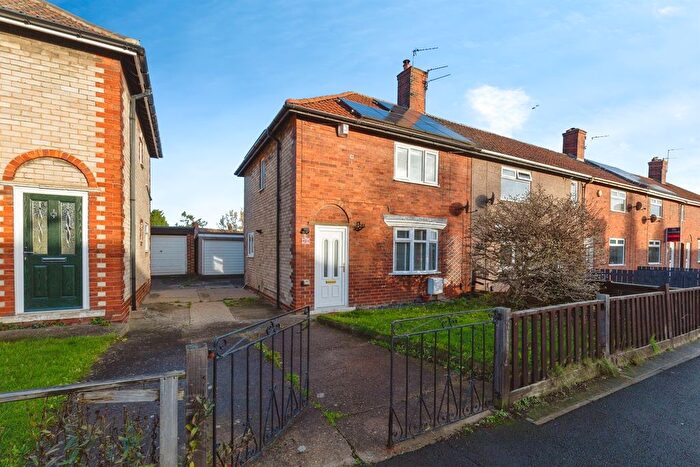
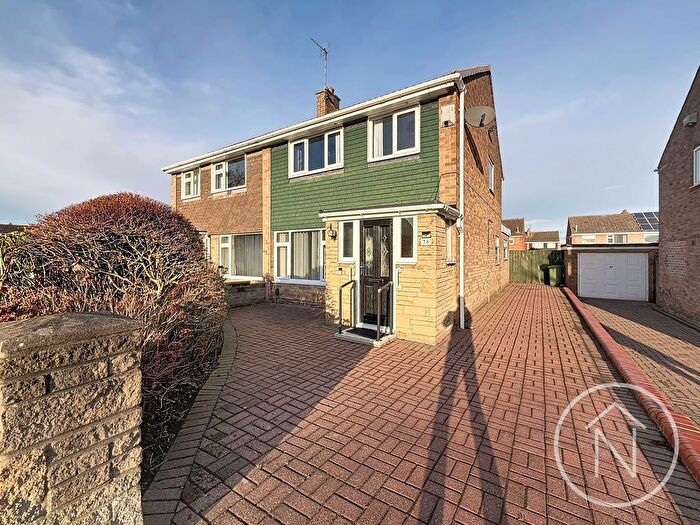
Properties for sale in Billingham South
Previously listed properties in Billingham South
Roads and Postcodes in Billingham South
Navigate through our locations to find the location of your next house in Billingham South, Billingham for sale or to rent.
| Streets | Postcodes |
|---|---|
| Allendale Road | TS23 1PP TS23 1PW |
| Ambleside Road | TS23 1HY |
| Bank Road | TS23 1DU |
| Bedale Avenue | TS23 1AH TS23 1AJ TS23 1AL TS23 1AP TS23 1AR TS23 1AU TS23 1AW TS23 1BL |
| Belasis Avenue | TS23 1BE TS23 1EY TS23 1HD TS23 1LH TS23 1QY TS23 1QZ |
| Billingham Reach Industrial Estate | TS23 1PX |
| Brent Court | TS23 1PT |
| Brunner Road | TS23 1HW |
| By Pass Road | TS23 1EB TS23 1ED |
| Cassel Court | TS23 1RB |
| Central Avenue | TS23 1LL TS23 1LN TS23 1LP TS23 1LR TS23 1LS TS23 1LT TS23 1LU TS23 1LW TS23 1LF |
| Chapel Court | TS23 1EH |
| Chapel Road | TS23 1DX TS23 1EN TS23 1FA |
| Chiltons Avenue | TS23 1JE TS23 1JF TS23 1BF TS23 1JD |
| Church Road | TS23 1BW |
| Churchend Close | TS23 1BN |
| Collingwood Road | TS23 1QH |
| Conifer Crescent | TS23 1PF |
| Conifer Grove | TS23 1PG |
| Cowpen Bewley Road | TS23 4EX |
| Cowpen Lane | TS23 1LA TS23 1LJ |
| Crescent Avenue | TS23 1HU TS23 1JU |
| Cumberland Crescent | TS23 1AY |
| East Avenue | TS23 1BY |
| Grange Avenue | TS23 1JH TS23 1JJ TS23 1JQ |
| Hallcroft Close | TS23 1QN |
| Haverton Hill Industrial Estate | TS23 1PZ |
| Haverton Hill Road | TS23 1PS TS23 1PY TS23 1QG |
| Hawthorn Avenue | TS23 1EE |
| Hill Road | TS23 1DT |
| Hollymount | TS23 1EL |
| Hope Street | TS23 4HE |
| Howard Walk | TS23 1QQ |
| Imperial Road | TS23 1DJ TS23 1DN TS23 1DP TS23 1DW |
| Keswick Road | TS23 1HB |
| Kildale Road | TS23 1NB |
| Langdale Road | TS23 1AN TS23 1AD |
| Lunedale Road | TS23 1PH TS23 1PJ TS23 1PL TS23 1PN |
| Marlborough Close | TS23 1BJ |
| Middle Avenue | TS23 1BZ |
| Mill Court | TS23 1QW |
| Mill Lane | TS23 1HF TS23 1HG TS23 1HH TS23 1HJ TS23 1HL TS23 1HN |
| Mond Crescent | TS23 1DL |
| Monksfield | TS23 1FD TS23 1FE TS23 1FF TS23 1FG |
| New Road | TS23 1DE TS23 1DF TS23 1DG TS23 1DH TS23 1DQ TS23 1DR TS23 1LE |
| Old Road | TS23 1DS |
| Parklands Avenue | TS23 1DZ |
| Pickering Street | TS23 1QE |
| Picture House Buildings | TS23 1HE |
| Rawlinson Avenue | TS23 1JG |
| Rodney Close | TS23 1QJ |
| Roscoe Road | TS23 1HP |
| Rydal Avenue | TS23 1HX TS23 1HZ |
| South Avenue | TS23 1DD |
| South View | TS23 1BS TS23 1BU TS23 1BX TS23 1BT |
| Station Crescent | TS23 1LY |
| Station Road | TS23 1AB TS23 1AE TS23 1AF TS23 1AG TS23 1AQ TS23 1PA TS23 1PD TS23 1PE TS23 1PQ |
| Stockton Street | TS23 1EF TS23 1EQ |
| Stokesley Crescent | TS23 1LX TS23 1ND TS23 1NE TS23 1NF TS23 1NG TS23 1NQ |
| Sunnybrow Avenue | TS23 1EA |
| Swaledale Crescent | TS23 1NP TS23 1NR |
| Tees Bridge Approach Road | TS18 2RF |
| Teesdale Avenue | TS23 1LZ TS23 1NA TS23 1NH TS23 1NJ TS23 1NN TS23 1NW |
| The Grange Business Centre | TS23 1LG |
| The Green | TS23 1ER TS23 1ES TS23 1EX TS23 1EU TS23 1EW |
| The Hollies | TS23 1DY |
| Thirlmere Court | TS23 1HQ |
| Tibbersley Avenue | TS23 1JA TS23 1JP TS23 1JW |
| Ullswater Road | TS23 1JT |
| Walsingham Court | TS23 1JR |
| Weardale Crescent | TS23 1AZ TS23 1BA TS23 1BB TS23 1BD TS23 1BG TS23 1BH TS23 1BQ |
| West Avenue | TS23 1DA TS23 1DB |
| Wharfdale Avenue | TS23 1AX TS23 1NL TS23 1NS |
| Windermere Avenue | TS23 1JL |
| Windsor Street | TS23 4EY |
| Wolviston Road | TS23 1PB |
| Wooler Crescent | TS23 1JN |
| Yenton Close | TS23 1EG |
| York Crescent | TS23 1AS TS23 1AT |
Transport near Billingham South
- FAQ
- Price Paid By Year
- Property Type Price
Frequently asked questions about Billingham South
What is the average price for a property for sale in Billingham South?
The average price for a property for sale in Billingham South is £136,551. This amount is 24% lower than the average price in Billingham. There are 1,375 property listings for sale in Billingham South.
What streets have the most expensive properties for sale in Billingham South?
The streets with the most expensive properties for sale in Billingham South are Old Road at an average of £350,000, Brent Court at an average of £332,500 and Hallcroft Close at an average of £241,666.
What streets have the most affordable properties for sale in Billingham South?
The streets with the most affordable properties for sale in Billingham South are Tibbersley Avenue at an average of £72,875, Wooler Crescent at an average of £84,625 and Marlborough Close at an average of £86,000.
Which train stations are available in or near Billingham South?
Some of the train stations available in or near Billingham South are Billingham, Stockton and Middlesbrough.
Property Price Paid in Billingham South by Year
The average sold property price by year was:
| Year | Average Sold Price | Price Change |
Sold Properties
|
|---|---|---|---|
| 2025 | £143,501 | 6% |
65 Properties |
| 2024 | £134,951 | 3% |
81 Properties |
| 2023 | £131,180 | -6% |
60 Properties |
| 2022 | £138,992 | 13% |
86 Properties |
| 2021 | £121,587 | 6% |
68 Properties |
| 2020 | £114,436 | -4% |
52 Properties |
| 2019 | £118,523 | 10% |
85 Properties |
| 2018 | £107,192 | -10% |
60 Properties |
| 2017 | £117,469 | 7% |
70 Properties |
| 2016 | £108,984 | -7% |
71 Properties |
| 2015 | £116,862 | 17% |
52 Properties |
| 2014 | £96,872 | -10% |
48 Properties |
| 2013 | £106,785 | -7% |
51 Properties |
| 2012 | £113,915 | 9% |
33 Properties |
| 2011 | £103,393 | -7% |
47 Properties |
| 2010 | £110,181 | 14% |
42 Properties |
| 2009 | £95,240 | -18% |
45 Properties |
| 2008 | £112,810 | -6% |
56 Properties |
| 2007 | £119,865 | 11% |
107 Properties |
| 2006 | £107,153 | 5% |
101 Properties |
| 2005 | £101,814 | 9% |
92 Properties |
| 2004 | £92,816 | 29% |
98 Properties |
| 2003 | £65,790 | 25% |
117 Properties |
| 2002 | £49,442 | 16% |
130 Properties |
| 2001 | £41,615 | 10% |
103 Properties |
| 2000 | £37,365 | -1% |
101 Properties |
| 1999 | £37,787 | 11% |
93 Properties |
| 1998 | £33,686 | -12% |
93 Properties |
| 1997 | £37,606 | 2% |
92 Properties |
| 1996 | £36,857 | -1% |
89 Properties |
| 1995 | £37,254 | - |
59 Properties |
Property Price per Property Type in Billingham South
Here you can find historic sold price data in order to help with your property search.
The average Property Paid Price for specific property types in the last three years are:
| Property Type | Average Sold Price | Sold Properties |
|---|---|---|
| Flat | £57,500.00 | 2 Flats |
| Semi Detached House | £135,823.00 | 102 Semi Detached Houses |
| Detached House | £239,900.00 | 14 Detached Houses |
| Terraced House | £122,749.00 | 88 Terraced Houses |

