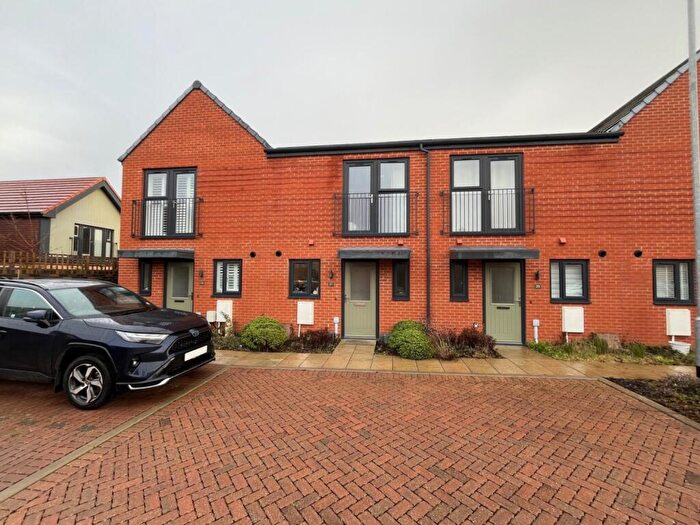
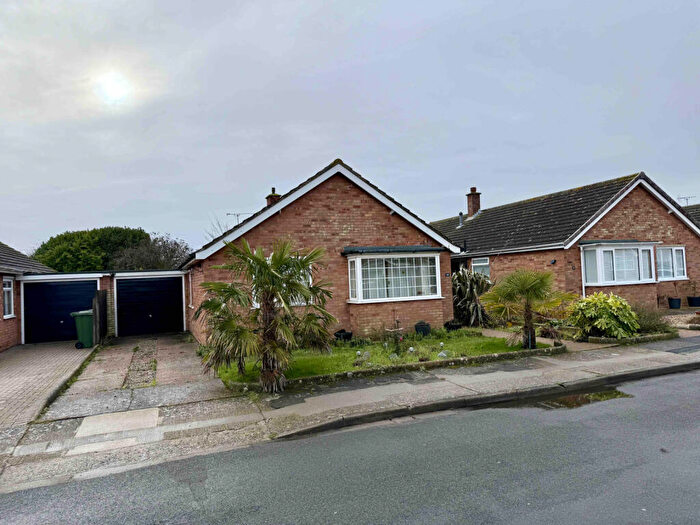
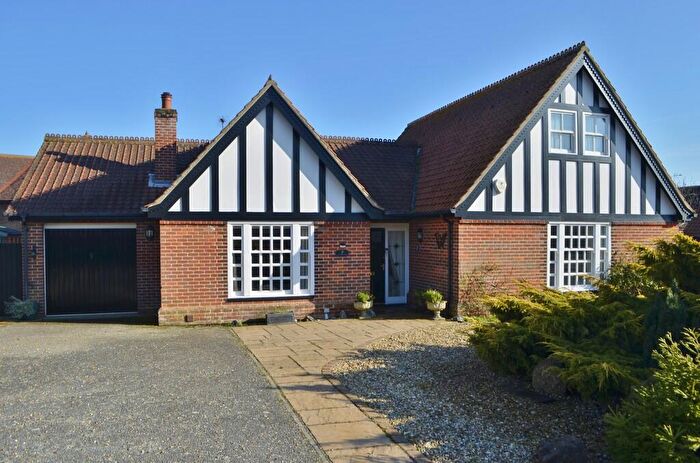
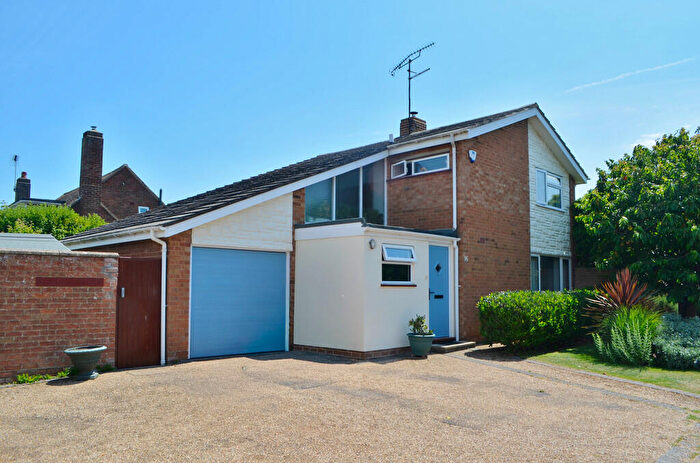
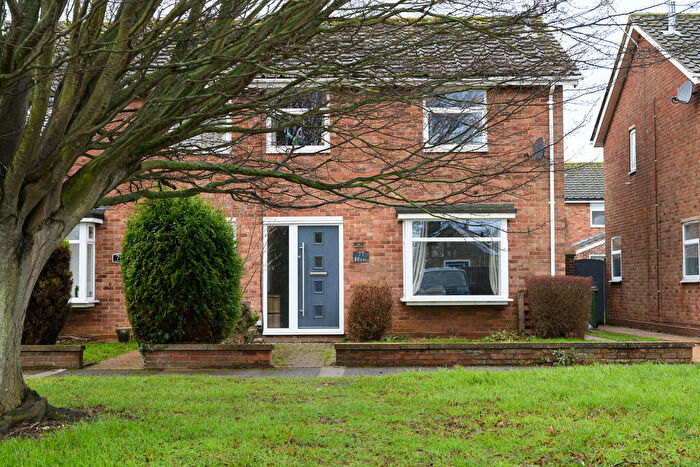
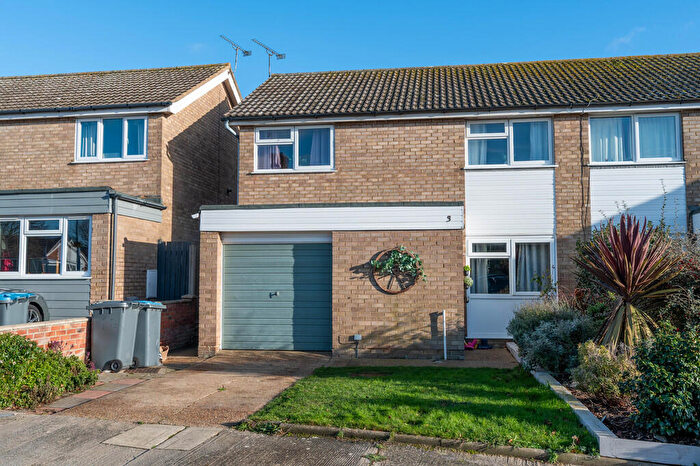
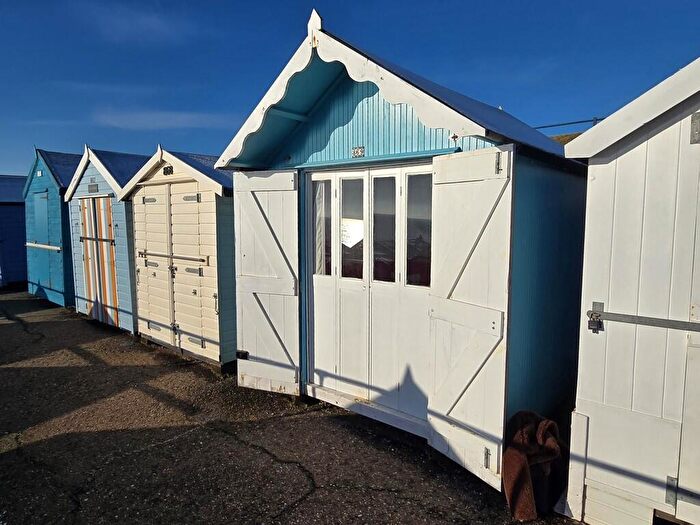
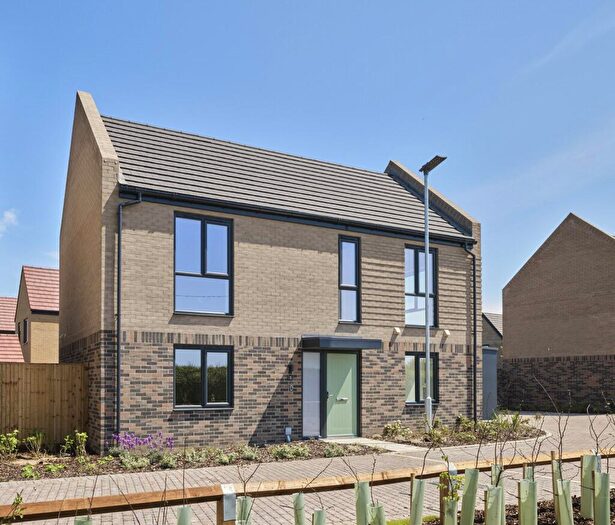
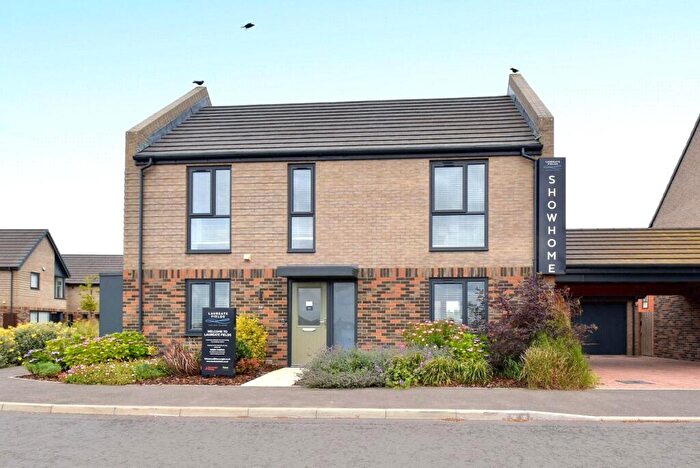
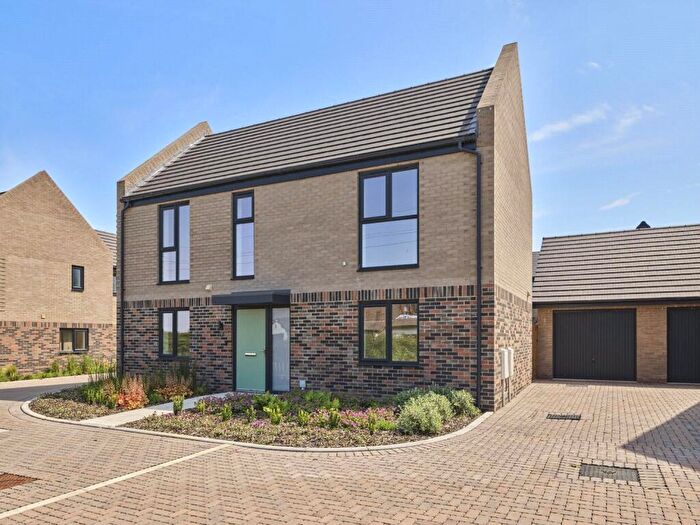
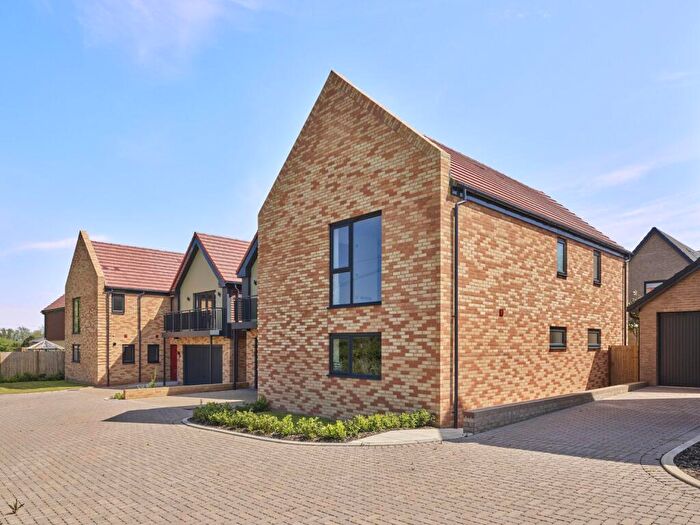
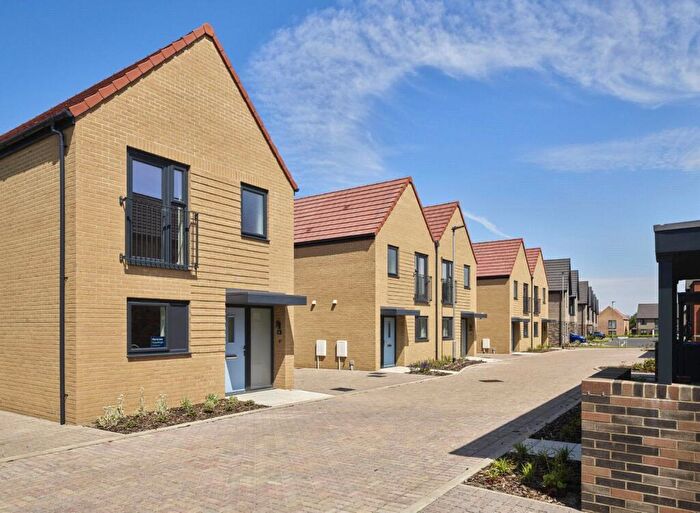
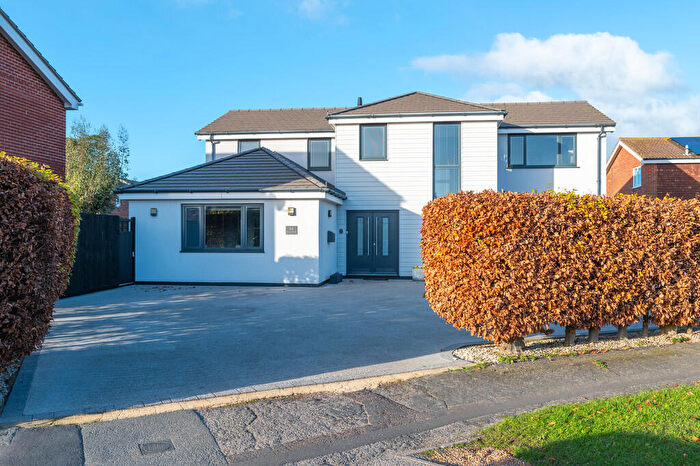
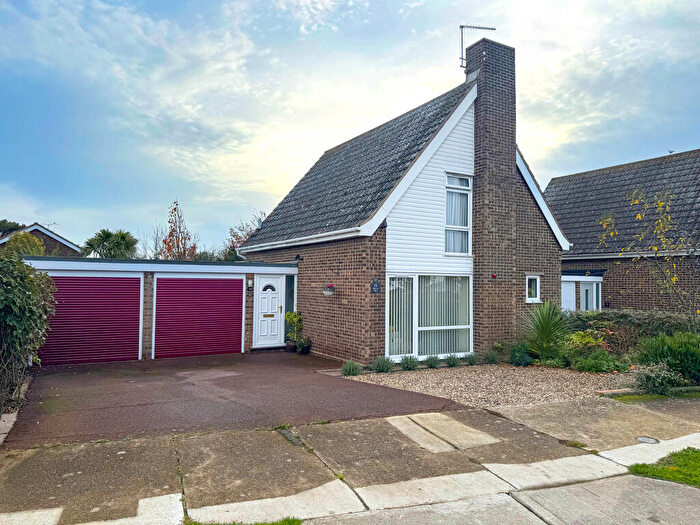
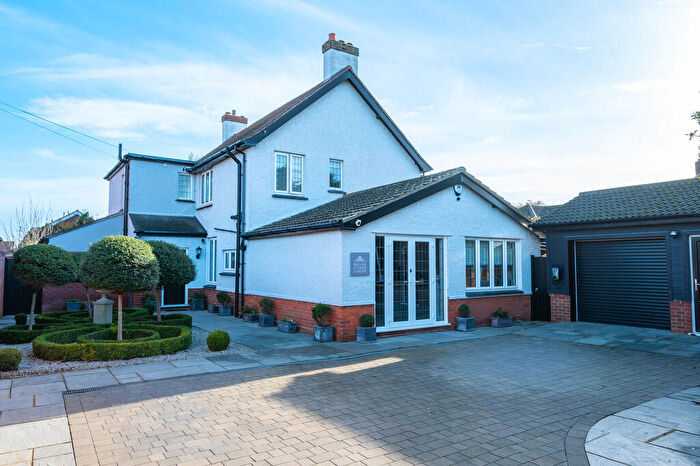
Houses for sale & to rent in Felixstowe East, Felixstowe
House Prices in Felixstowe East
Properties in Felixstowe East have an average house price of £418,085.00 and had 178 Property Transactions within the last 3 years¹.
Felixstowe East is an area in Felixstowe, Suffolk with 1,749 households², where the most expensive property was sold for £1,120,000.00.
Properties for sale in Felixstowe East
Roads and Postcodes in Felixstowe East
Navigate through our locations to find the location of your next house in Felixstowe East, Felixstowe for sale or to rent.
| Streets | Postcodes |
|---|---|
| Barons Close | IP11 9NL |
| Bawdsey Close | IP11 9TT |
| Brinkley Way | IP11 9TX |
| Buttermere Green | IP11 9SP |
| Carol Close | IP11 9QD |
| Castle Close | IP11 9NN |
| Church Road | IP11 9NE IP11 9NF |
| Cliff Road | IP11 9PH IP11 9PP IP11 9SA IP11 9SH IP11 9SQ IP11 9SY |
| Colneis Road | IP11 9HF IP11 9HH IP11 9HJ IP11 9HQ IP11 9LG IP11 9LH IP11 9LJ IP11 9LL IP11 9LQ |
| Coniston Close | IP11 9SW |
| Conway Close | IP11 9LP |
| Cumberland Close | IP11 9ST |
| Drift Cottages | IP11 9LZ |
| Dukes Close | IP11 9NS |
| Earls Close | IP11 9NY |
| Eastcliff | IP11 9TA |
| Elmcroft Lane | IP11 9LX |
| Ennerdale Close | IP11 9SS |
| Estuary Drive | IP11 9TL |
| Ferndown Road | IP11 9LA |
| Ferry Road | IP11 9LN IP11 9LU IP11 9LY IP11 9NB IP11 9RL IP11 9RS IP11 9RT IP11 9RU IP11 9RX |
| Gleneagles Close | IP11 9HL |
| Gosford Way | IP11 9PA IP11 9PB IP11 9PD |
| Grasmere Avenue | IP11 9SG |
| Gulpher Road | IP11 9RQ |
| High Road East | IP11 9PS IP11 9PT |
| Hollybush Drive | IP11 9TP |
| Kendal Green | IP11 9SF |
| Keswick Close | IP11 9NZ |
| Knights Close | IP11 9NU |
| Langdale Close | IP11 9SR |
| Links Avenue | IP11 9HD IP11 9HE |
| Looe Road | IP11 9QB IP11 9QF |
| Norman Close | IP11 9NQ |
| Ofeld Terrace | IP11 9NA |
| Old Hall Close | IP11 9PQ |
| Prestwick Avenue | IP11 9LF |
| Quintons Lane | IP11 9QE |
| Roman Way | IP11 9NJ IP11 9NP IP11 9NR IP11 9NW |
| Rosemary Avenue | IP11 9HN IP11 9HU IP11 9HX |
| Rushmeadow Way | IP11 9TH |
| Rydal Avenue | IP11 9SE |
| Saxon Close | IP11 9NH |
| St Georges Road | IP11 9PL IP11 9PN IP11 9PW |
| St Georges Terrace | IP11 9ND |
| Stuart Close | IP11 9SX |
| Sunningdale Drive | IP11 9LE |
| Sunray Avenue | IP11 9QG |
| Swallow Close | IP11 9LR |
| Tarn Hows Close | IP11 9PF |
| The Ferry | IP11 9RZ |
| The Pines | IP11 9SU |
| Thirlmere Court | IP11 9SN |
| Ullswater Avenue | IP11 9SD |
| Upperfield Drive | IP11 9LS IP11 9LT IP11 9LW |
| Walnut Close | IP11 9TD |
| Wentworth Drive | IP11 9LB IP11 9LD |
| Western Avenue | IP11 9NG IP11 9NT IP11 9NX IP11 9SB IP11 9SJ IP11 9SL IP11 9TS |
| Westmorland Road | IP11 9TB IP11 9TE IP11 9TF IP11 9TJ IP11 9TN IP11 9TW |
| Whinyard Way | IP11 9TG |
| White Horse Close | IP11 9UJ |
| Windermere Road | IP11 9TR |
| Wrens Park | IP11 9TQ |
Transport near Felixstowe East
- FAQ
- Price Paid By Year
- Property Type Price
Frequently asked questions about Felixstowe East
What is the average price for a property for sale in Felixstowe East?
The average price for a property for sale in Felixstowe East is £418,085. This amount is 37% higher than the average price in Felixstowe. There are 1,146 property listings for sale in Felixstowe East.
What streets have the most expensive properties for sale in Felixstowe East?
The streets with the most expensive properties for sale in Felixstowe East are Cliff Road at an average of £696,649, The Pines at an average of £598,750 and Eastcliff at an average of £595,000.
What streets have the most affordable properties for sale in Felixstowe East?
The streets with the most affordable properties for sale in Felixstowe East are Earls Close at an average of £240,000, Prestwick Avenue at an average of £255,000 and Gosford Way at an average of £271,833.
Which train stations are available in or near Felixstowe East?
Some of the train stations available in or near Felixstowe East are Felixstowe, Trimley and Harwich Town.
Property Price Paid in Felixstowe East by Year
The average sold property price by year was:
| Year | Average Sold Price | Price Change |
Sold Properties
|
|---|---|---|---|
| 2025 | £437,291 | 7% |
48 Properties |
| 2024 | £408,156 | -1% |
69 Properties |
| 2023 | £414,204 | -7% |
61 Properties |
| 2022 | £442,331 | 17% |
64 Properties |
| 2021 | £365,402 | 3% |
68 Properties |
| 2020 | £355,890 | 4% |
70 Properties |
| 2019 | £341,574 | 4% |
64 Properties |
| 2018 | £329,617 | 7% |
69 Properties |
| 2017 | £306,900 | -2% |
51 Properties |
| 2016 | £311,758 | 4% |
72 Properties |
| 2015 | £299,774 | 17% |
61 Properties |
| 2014 | £249,532 | 11% |
67 Properties |
| 2013 | £222,710 | -9% |
58 Properties |
| 2012 | £242,388 | 3% |
59 Properties |
| 2011 | £234,889 | -8% |
60 Properties |
| 2010 | £253,841 | 10% |
60 Properties |
| 2009 | £228,764 | -3% |
53 Properties |
| 2008 | £235,327 | -1% |
42 Properties |
| 2007 | £236,665 | -1% |
79 Properties |
| 2006 | £238,053 | -3% |
93 Properties |
| 2005 | £244,118 | 14% |
76 Properties |
| 2004 | £210,519 | 13% |
76 Properties |
| 2003 | £182,145 | 17% |
70 Properties |
| 2002 | £151,444 | 14% |
85 Properties |
| 2001 | £130,969 | 13% |
66 Properties |
| 2000 | £114,398 | 22% |
81 Properties |
| 1999 | £89,423 | 6% |
97 Properties |
| 1998 | £83,880 | 3% |
70 Properties |
| 1997 | £80,998 | 12% |
82 Properties |
| 1996 | £71,428 | 6% |
90 Properties |
| 1995 | £67,466 | - |
58 Properties |
Property Price per Property Type in Felixstowe East
Here you can find historic sold price data in order to help with your property search.
The average Property Paid Price for specific property types in the last three years are:
| Property Type | Average Sold Price | Sold Properties |
|---|---|---|
| Semi Detached House | £330,883.00 | 50 Semi Detached Houses |
| Detached House | £484,787.00 | 105 Detached Houses |
| Terraced House | £314,452.00 | 21 Terraced Houses |
| Flat | £184,500.00 | 2 Flats |

