
Houses for sale in Suffolk, England
House Prices in Suffolk
Properties in Suffolk have
an average house price of
£319k
and had 33,369 Property Transactions
within the last 3 years.¹
Suffolk is a location in
England with
333,967 households², where the most expensive property was sold for £3.88M.
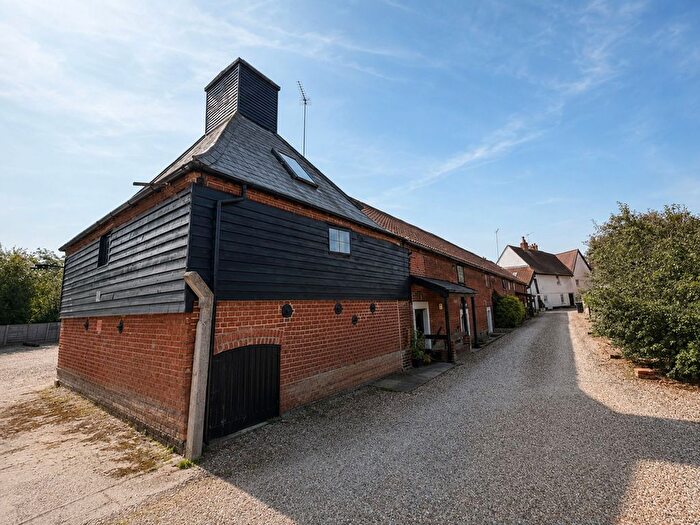
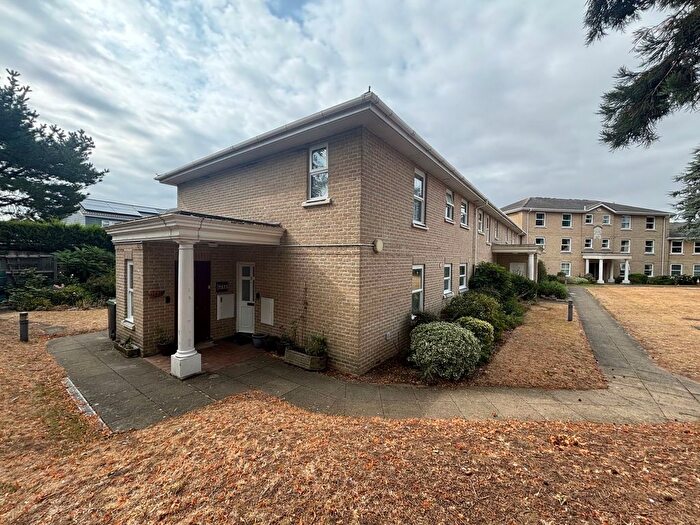
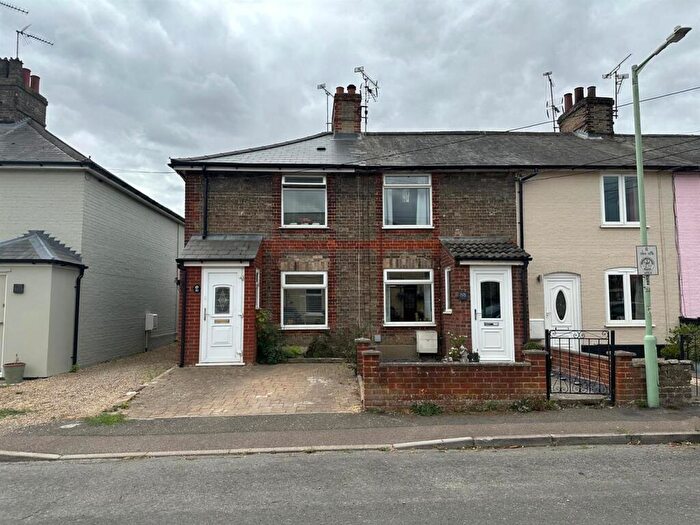
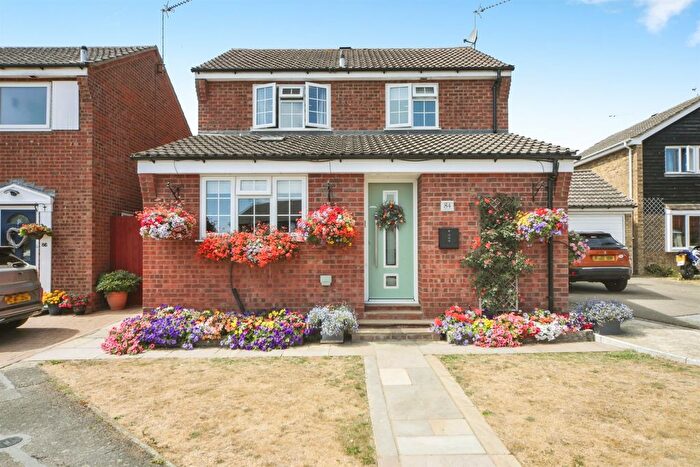
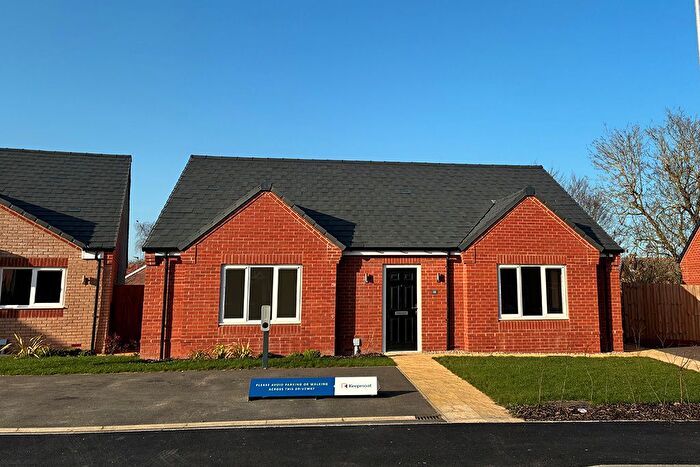
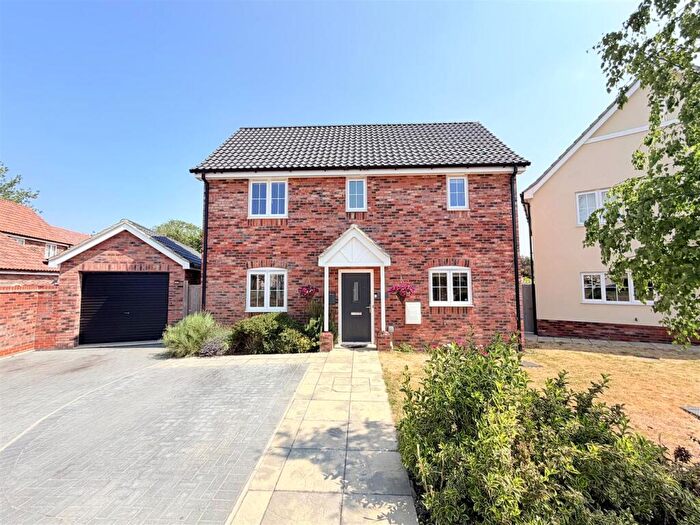
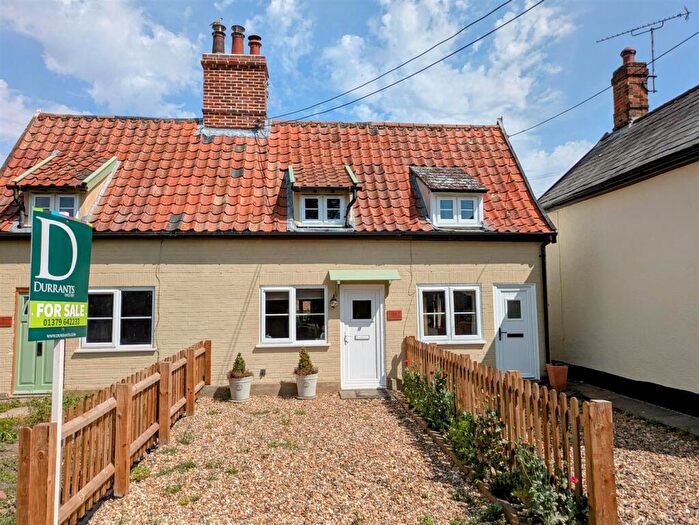
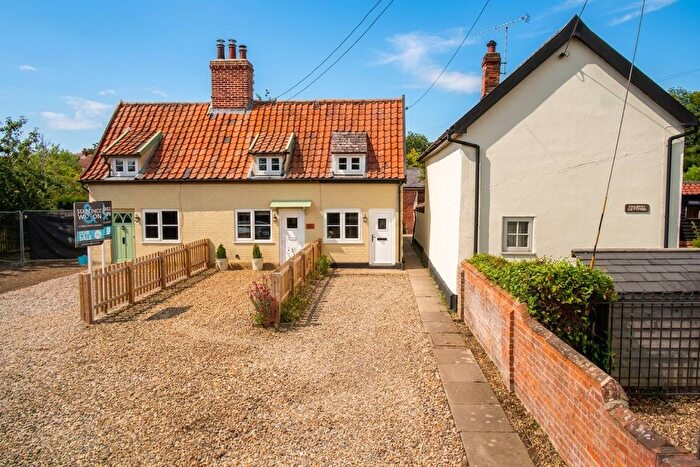
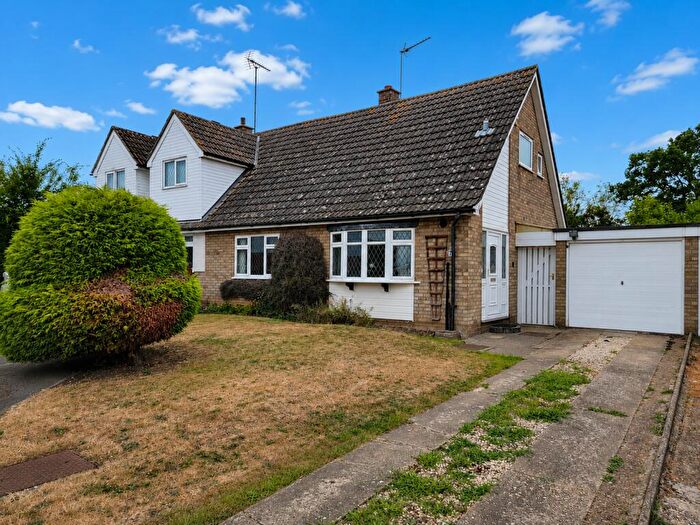
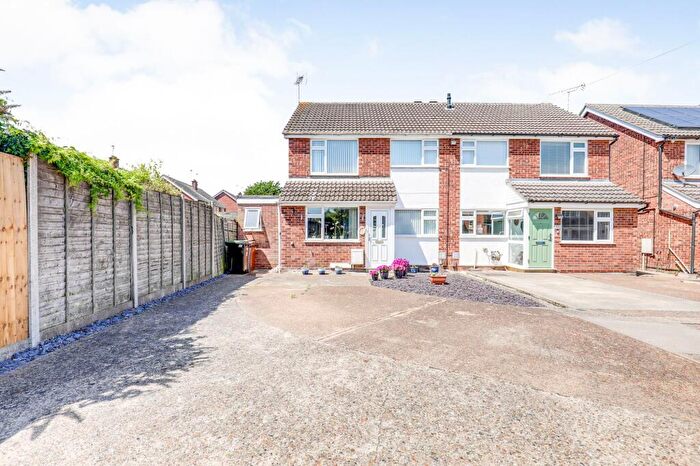
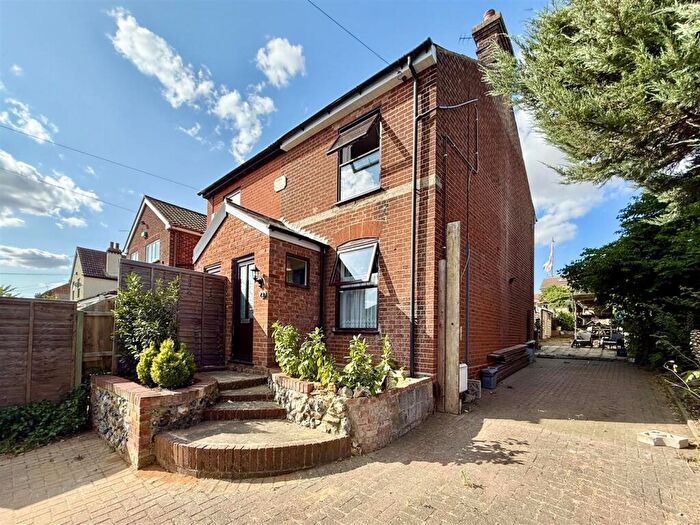
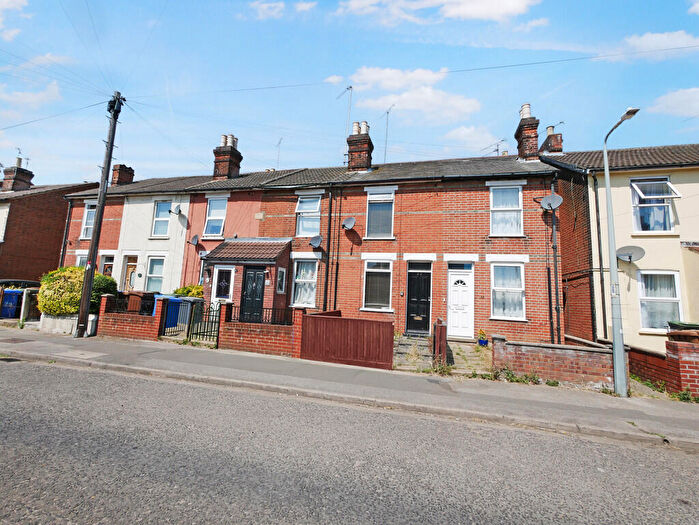
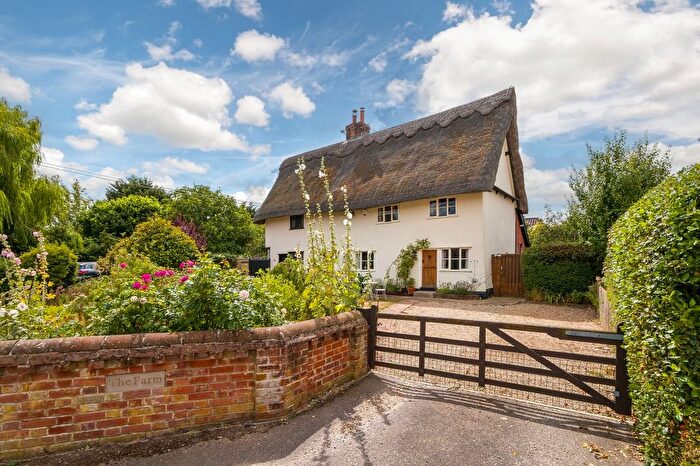
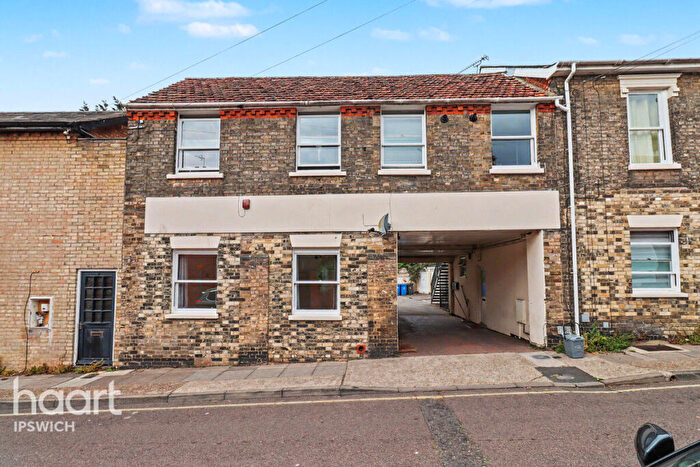
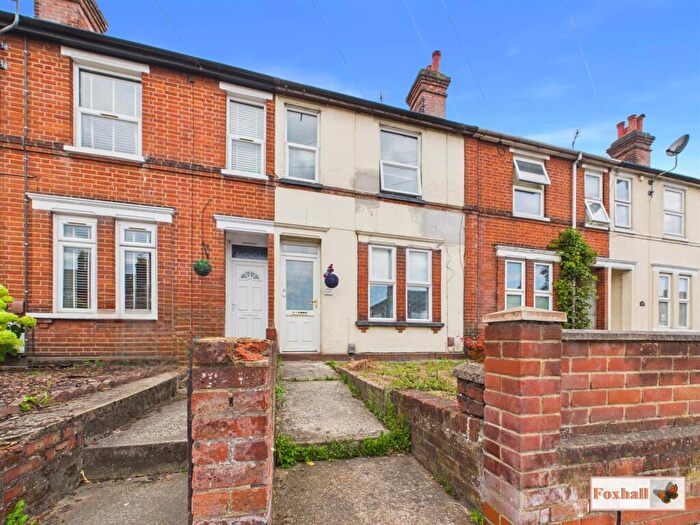
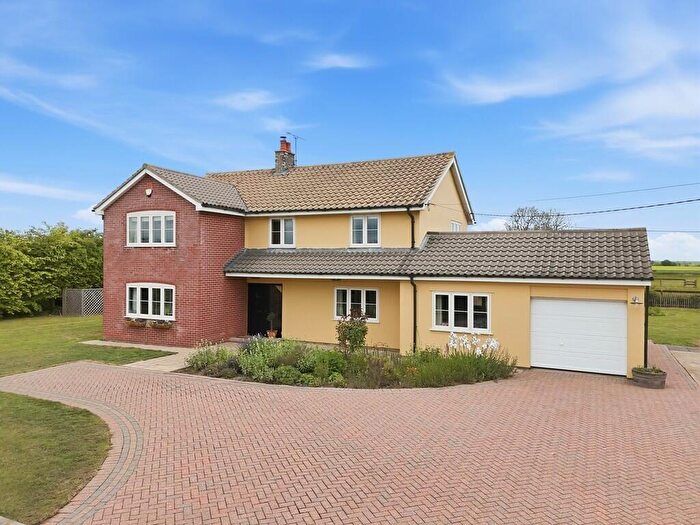
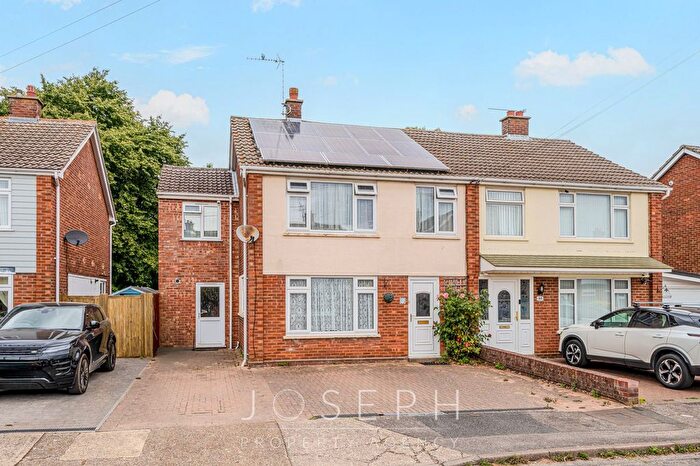
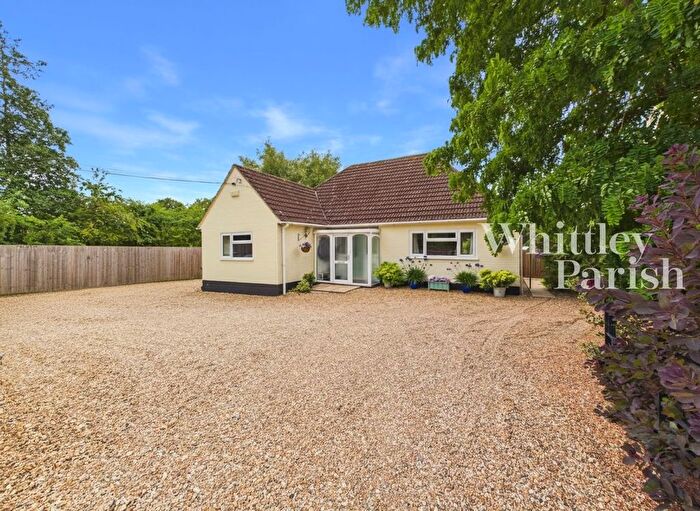
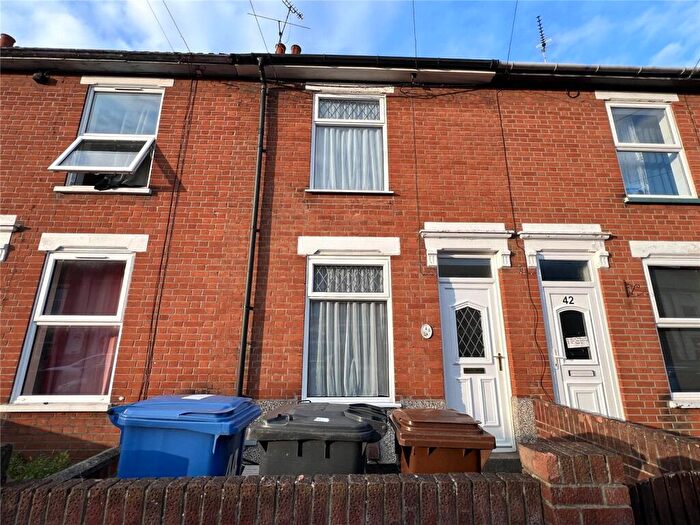
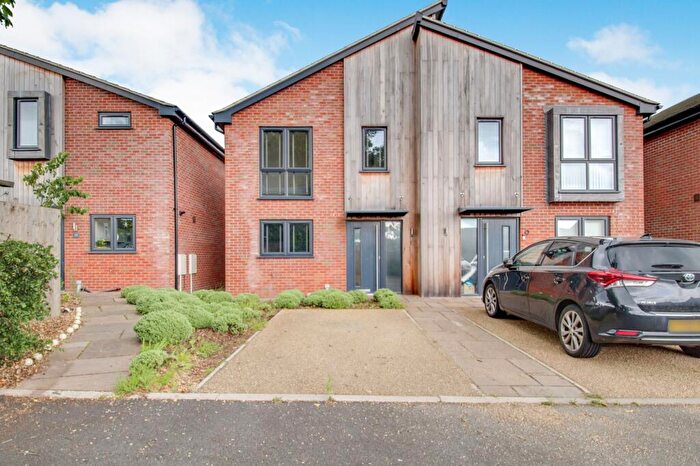
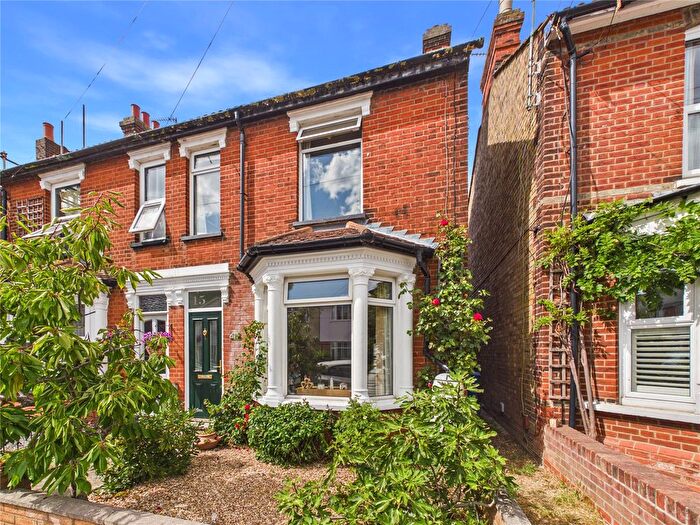
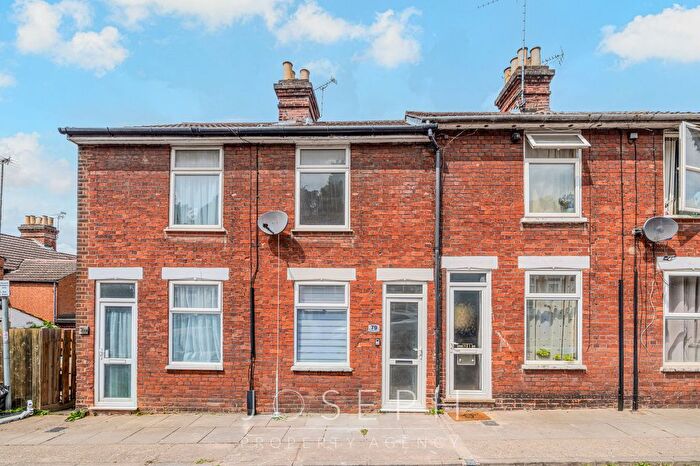
Properties for sale in Suffolk
![]()
If you are looking to sell your house, let it out, or receive a property valuation, an expert can help you.
Click the button below to get started.
Towns in Suffolk
Navigate through our locations to find the location of your next house in Suffolk, England for sale or to rent.
Property price trends in Suffolk
According to the latest Land Registry data, the average home in Suffolk sold for £305,943 in 2026. That figure comes from a substantial record of 428,544 sales logged over the past 31 years.
Prices have fallen back over the last three years. Compared with 2023, when the typical sale came in around £326,770, that's a fall of roughly 6.4%.
Looking back five years, average prices are down about 2% since 2021, a drop of around £6,192 in cash terms.
Zoom out to the past decade for the fuller picture. Back in 2016, homes here averaged £246,303, so the typical sold price has climbed about 24.2% since then, roughly 2.2% a year. Stretch the view to fifteen years and that annual pace edges up closer to 2.8%.
Frequently asked questions about Suffolk
What is the average price for a property for sale in Suffolk?
The average price for a property for sale in Suffolk is £319,009. This amount is 11% lower than the average price in England. There are more than 10,000 property listings for sale in Suffolk.
What locations have the most expensive properties for sale in Suffolk?
The locations with the most expensive properties for sale in Suffolk are Aldeburgh at an average of £661,786, Southwold at an average of £615,586 and Colchester at an average of £484,646.
What locations have the most affordable properties for sale in Suffolk?
The locations with the most affordable properties for sale in Suffolk are Lowestoft at an average of £232,651, Great Yarmouth at an average of £236,250 and Brandon at an average of £238,539.
Which train stations are available in or near Suffolk?
Some of the train stations available in or near Suffolk are Needham Market, Stowmarket and Westerfield.
Property Price Paid in Suffolk by Year
The average sold property price by year was:
| Year | Average Sold Price | Price Change |
Sold Properties
|
|---|---|---|---|
| 2026 | £305,943 | -5% |
2,177 Properties |
| 2025 | £320,533 | 2% |
10,996 Properties |
| 2024 | £313,021 | -4% |
10,550 Properties |
| 2023 | £326,770 | -1% |
9,646 Properties |
| 2022 | £330,282 | 5% |
12,232 Properties |
| 2021 | £312,135 | 6% |
16,055 Properties |
| 2020 | £292,693 | 6% |
11,565 Properties |
| 2019 | £276,045 | 1% |
12,615 Properties |
| 2018 | £274,220 | 3% |
13,159 Properties |
| 2017 | £266,657 | 8% |
13,738 Properties |
Property Price per Property Type in Suffolk
Here you can find historic sold price data in order to help with your property search.
The average Property Paid Price for specific property types in the last three years are:
| Property Type | Average Sold Price | Sold Properties |
|---|---|---|
| Semi Detached House | £282,650.00 | 9,656 Semi Detached Houses |
| Terraced House | £237,788.00 | 9,434 Terraced Houses |
| Detached House | £456,522.00 | 11,386 Detached Houses |
| Flat | £164,015.00 | 2,893 Flats |
Transport in Suffolk
Please see below transportation links in this area:
