
Houses for sale in Kessingland, Lowestoft
House Prices in Kessingland
Properties in Kessingland have an average house price of £237k and had 262 Property Transactions within the last 3 years¹.
Kessingland is an area in Lowestoft, Suffolk with 2,344 households², where the most expensive property was sold for £630k.
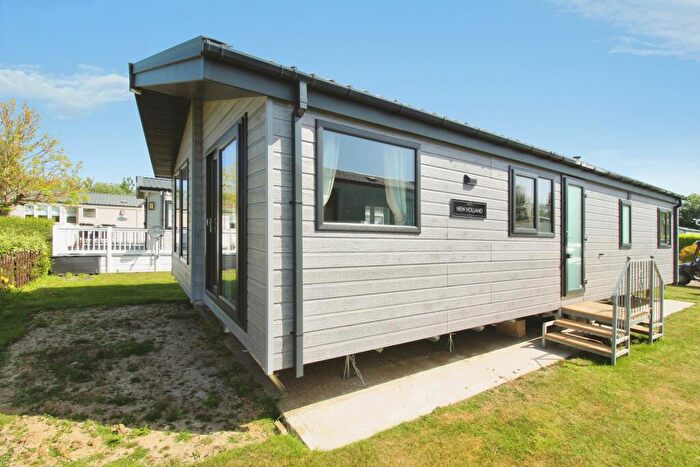
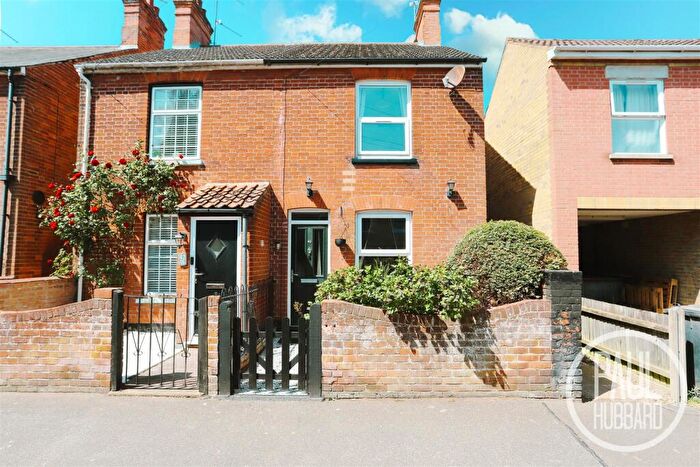
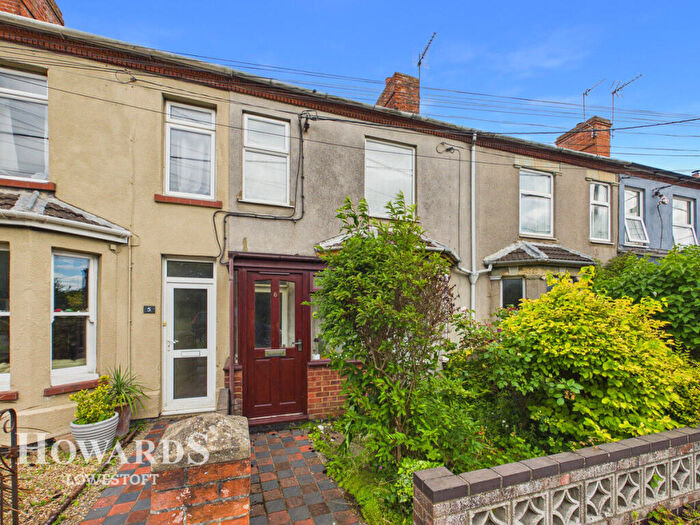
Properties for sale in Kessingland
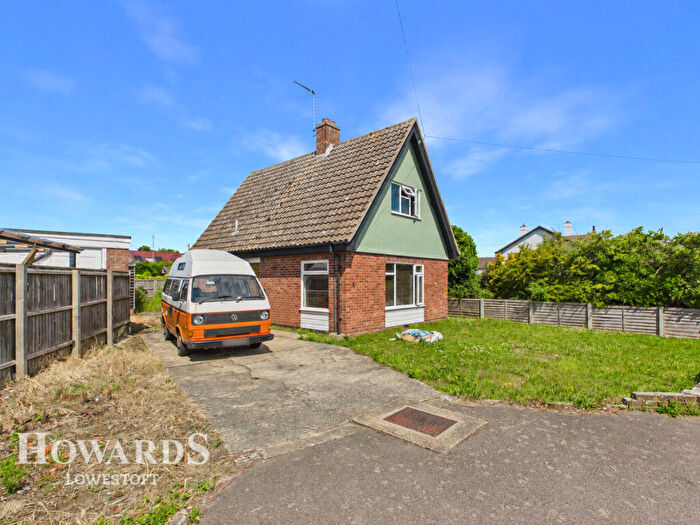
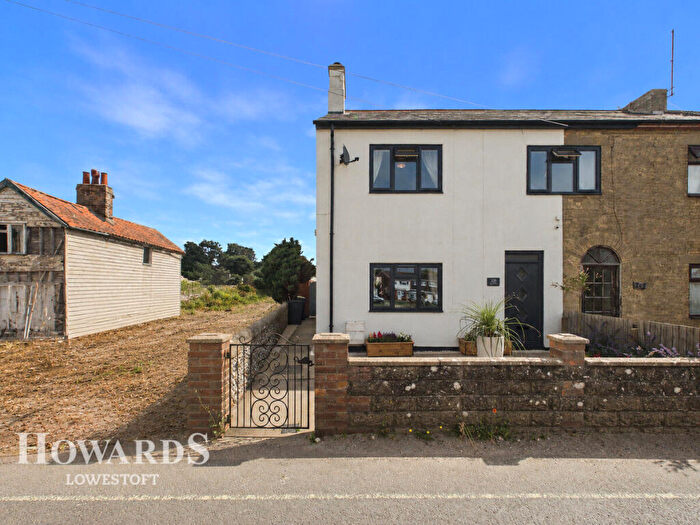
![]()
If you are looking to sell your house, let it out, or receive a property valuation, an expert can help you.
Click the button below to get started.
Roads and Postcodes in Kessingland
Navigate through our locations to find the location of your next house in Kessingland, Lowestoft for sale or to rent.
| Streets | Postcodes |
|---|---|
| Alandale Drive | NR33 7SD |
| Amber Drive | NR33 7UL |
| Ark Close | NR33 7UR |
| Badgers Holt | NR33 7SZ |
| Barber Close | NR33 7UG |
| Barnard Terrace | NR33 7QP |
| Beach Road | NR33 7RW |
| Beaconsfield Place | NR33 7RJ |
| Beaconsfield Road | NR33 7RD |
| Belvedere Drive | NR33 7SA |
| Bethel Drive | NR33 7RY |
| Birds Cottages | NR33 7TD |
| Black Street | NR33 8EG NR33 8EL NR33 8EN |
| Bucknam Close | NR33 7NX |
| Catchpole Close | NR33 7TL |
| Catherine Terrace | NR33 7QS |
| Chipperfield Road | NR33 7SS |
| Church Road | NR33 7SB NR33 7SF NR33 7SG NR33 7SJ NR33 7SQ NR33 7TH NR33 7TJ NR33 7TQ NR33 8DS |
| Clare Road | NR33 7PS |
| Coastal Cottages | NR33 7RZ |
| Coastguard Lane | NR33 7RE |
| Cooke Close | NR33 7NW |
| Cooke Road | NR33 7NA |
| Coopers Drive | NR33 7RU |
| Damerson Went | NR33 7PE |
| Dorley Dale | NR33 8US |
| Dowson Drive | NR33 7UQ |
| Drury Close | NR33 7ST |
| Durrants Close | NR33 7PB |
| Easdale | NR33 8WL |
| Elizabeth Terrace | NR33 7QR |
| Fellowship Green | NR33 7SP |
| Field Lane | NR33 7PY NR33 7PZ NR33 7QA NR33 7QB |
| Fishermans Way | NR33 7NY |
| Francis Road | NR33 7PU |
| Glebe Road East | NR33 7QX |
| Glebe Road West | NR33 7UB |
| Gratton Dale | NR33 8WP |
| Green Lane | NR33 7RH NR33 7RP |
| Grice Close | NR33 7SW |
| Griffith Close | NR33 7SN |
| Hall Road | NR33 7PP |
| Heritage Close | NR33 7UJ |
| Heritage Green | NR33 7UP |
| High Path | NR33 7RS |
| High Street | NR33 7QE NR33 7QF NR33 7QG NR33 7QQ NR33 7UT |
| Highfield Close | NR33 8DE |
| Holly Grange Road | NR33 7RR |
| Humber Cottages | NR33 7TA |
| Kipling Close | NR33 7NZ |
| Latymere Close | NR33 8EH |
| Lincoln Court | NR33 7QL |
| Lloyds Avenue | NR33 7TP NR33 7TR NR33 7TS NR33 7TT NR33 7TU NR33 7TX |
| London Road | NR33 7PG NR33 7PJ NR33 7PL NR33 7PN NR33 7PQ NR33 7PW |
| Lowlands Close | NR33 7QJ |
| Manor Walk | NR33 7UD |
| Market Place | NR33 7SY NR33 7TB NR33 7TE |
| Market Place Square | NR33 7TN |
| Marram Green | NR33 7AH |
| Marsh Lane | NR33 7RT |
| Mayfield Avenue | NR33 7QT |
| Mclean Drive | NR33 7TY |
| Mill Villas | NR33 8EJ |
| Noahs Drive | NR33 7US |
| North Cliff | NR33 7RA |
| Northacre | NR33 7PX |
| Oaklands Terrace | NR33 7PH |
| Peregrine Way | NR33 7QH |
| Pinbush Road | NR33 7NL |
| Poplar Terrace | NR33 7RX |
| Rider Haggard Lane | NR33 7NU NR33 7PD |
| Romany Lane | NR33 7RB |
| Roynon Close | NR33 7AJ |
| Rumsby Cottages | NR33 8DY |
| Rushmere Road | NR33 8HB |
| Ryeburn Close | NR33 7UH |
| Sanctuary Close | NR33 7SX |
| Sandy Lane | NR33 8EQ |
| Scotts Close | NR33 7SU |
| Seaview Chalet Park | NR33 7RG NR33 7RQ |
| Smith Crescent | NR33 7TZ |
| Solomon Road | NR33 7SR |
| St Edmunds Crescent | NR33 7PT |
| Strowgers Way | NR33 7PA |
| The Archway | NR33 7RF |
| The Avenue | NR33 7QD |
| The Nordalls | NR33 7UE |
| The Paddocks | NR33 7SE |
| Thixendale | NR33 8WN |
| Turrell Drive | NR33 7UA |
| Wash Lane | NR33 7QY NR33 7QZ |
| Whites Lane | NR33 7SL NR33 7TF NR33 7TG |
| Windsor Terrace | NR33 7PR |
| Winston Close | NR33 7QU |
| NR33 8DR NR33 8DT NR33 8DU NR33 8DZ |
Property price trends in Kessingland
According to the latest Land Registry data, the average home in Kessingland sold for £193,500 in 2026. That figure comes from 3,529 sales logged over the past 31 years.
Prices have fallen back over the last three years. Compared with 2023, when the typical sale came in around £231,738, that's a fall of roughly 16.5%.
Looking back five years, average prices are down about 13.6% since 2021, a drop of around £30,532 in cash terms.
Zoom out to the past decade for the fuller picture. Back in 2016, homes here averaged £180,517, so the typical sold price has climbed about 7.2% since then, roughly 0.7% a year. Stretch the view to fifteen years and that annual pace edges up closer to 2.5%.
Frequently asked questions about Kessingland
What is the average price for a property for sale in Kessingland?
The average price for a property for sale in Kessingland is £237,308. This amount is 2% higher than the average price in Lowestoft. There are 661 property listings for sale in Kessingland.
What streets have the most expensive properties for sale in Kessingland?
The streets with the most expensive properties for sale in Kessingland are North Cliff at an average of £573,100, Holly Grange Road at an average of £437,500 and Black Street at an average of £407,500.
What streets have the most affordable properties for sale in Kessingland?
The streets with the most affordable properties for sale in Kessingland are Alandale Drive at an average of £67,850, Marram Green at an average of £100,000 and Seaview Chalet Park at an average of £110,583.
Which train stations are available in or near Kessingland?
Some of the train stations available in or near Kessingland are Oulton Broad South, Oulton Broad North and Lowestoft.
Property Price Paid in Kessingland by Year
The average sold property price by year was:
| Year | Average Sold Price | Price Change |
Sold Properties
|
|---|---|---|---|
| 2026 | £193,500 | -22% |
2 Properties |
| 2025 | £236,744 | -3% |
89 Properties |
| 2024 | £244,269 | 5% |
87 Properties |
| 2023 | £231,738 | -14% |
84 Properties |
| 2022 | £265,337 | 16% |
98 Properties |
| 2021 | £224,032 | 9% |
119 Properties |
| 2020 | £204,639 | 8% |
100 Properties |
| 2019 | £188,304 | -2% |
98 Properties |
| 2018 | £192,237 | -3% |
137 Properties |
| 2017 | £198,050 | 9% |
118 Properties |
Property Price per Property Type in Kessingland
Here you can find historic sold price data in order to help with your property search.
The average Property Paid Price for specific property types in the last three years are:
| Property Type | Average Sold Price | Sold Properties |
|---|---|---|
| Semi Detached House | £235,515.00 | 67 Semi Detached Houses |
| Detached House | £341,141.00 | 67 Detached Houses |
| Terraced House | £185,869.00 | 125 Terraced Houses |
| Flat | £101,666.00 | 3 Flats |
