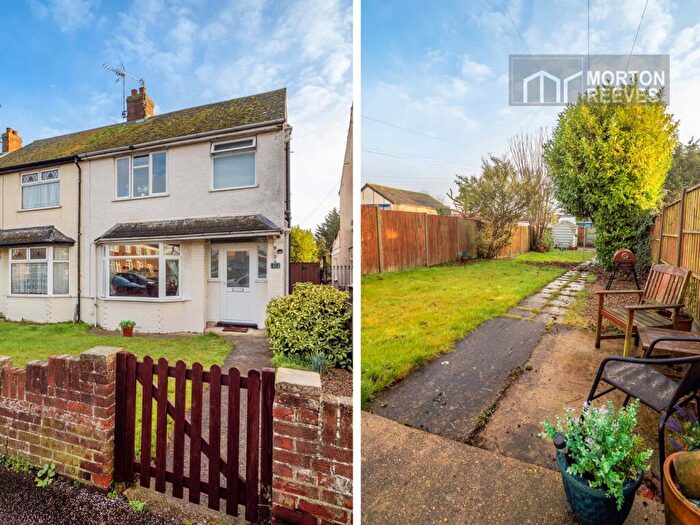
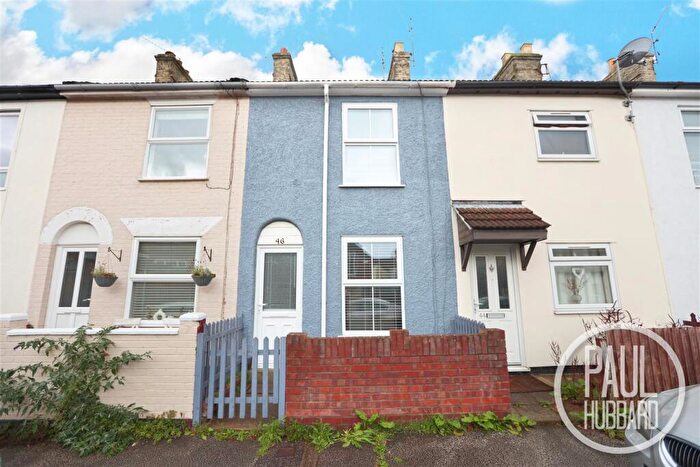
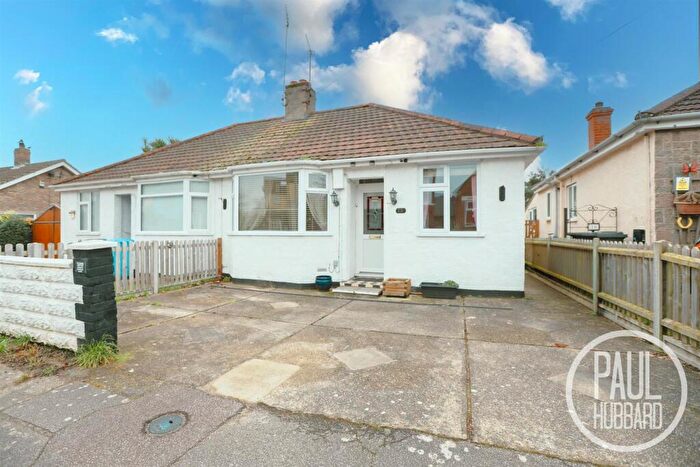
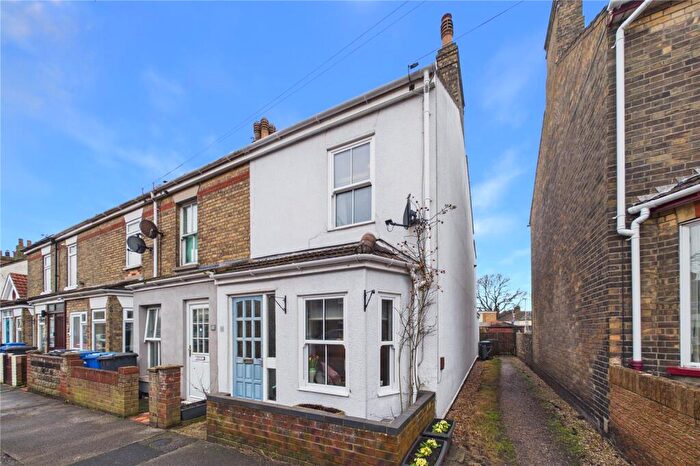
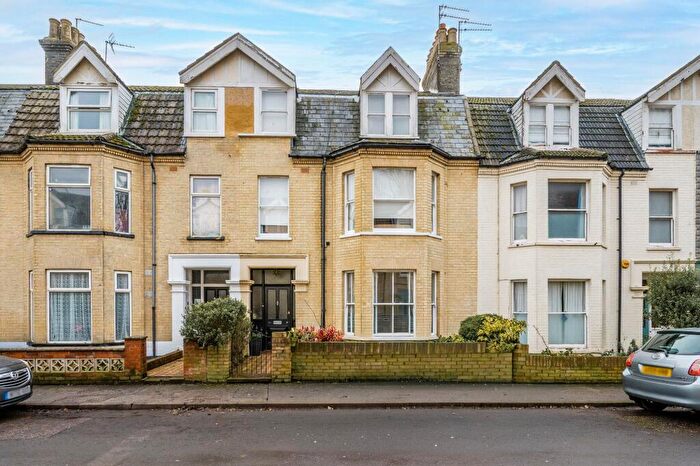
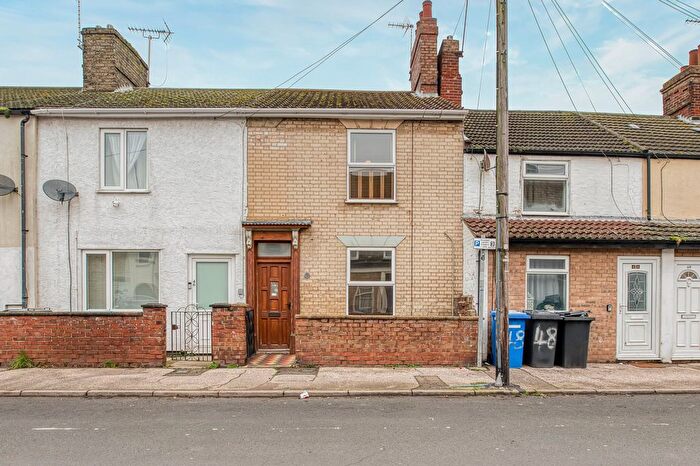
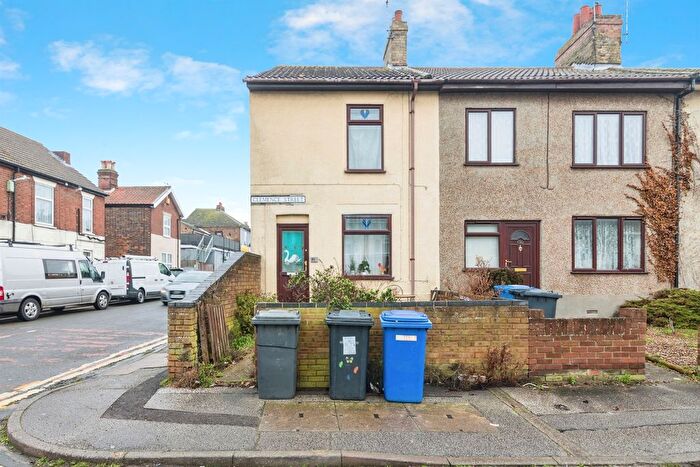
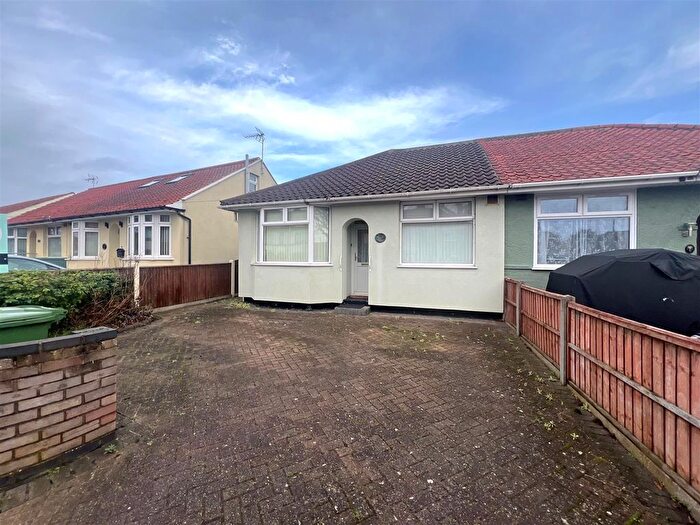
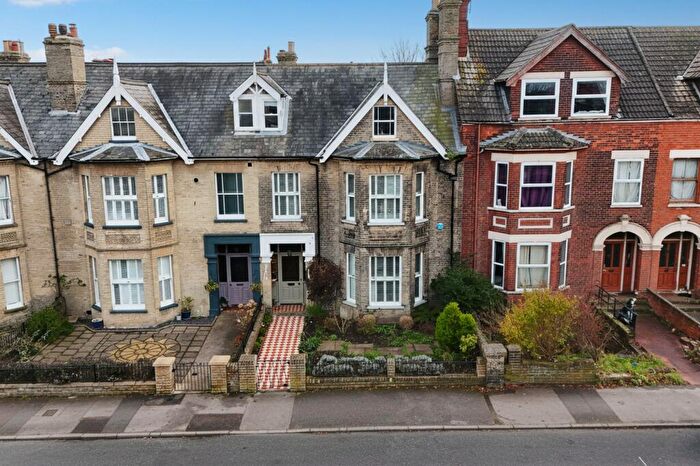
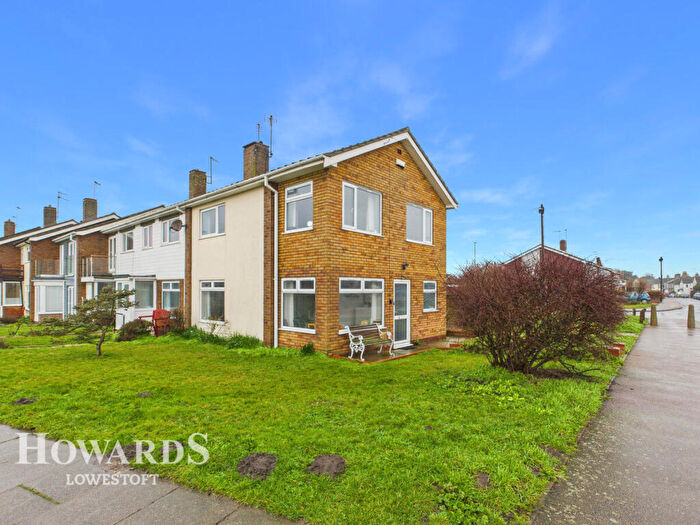
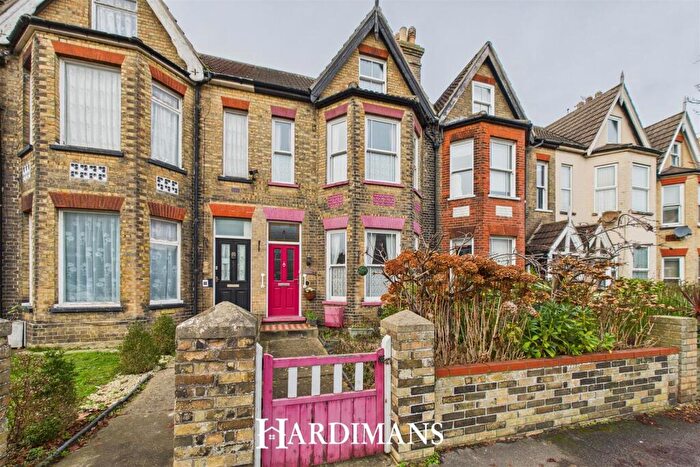
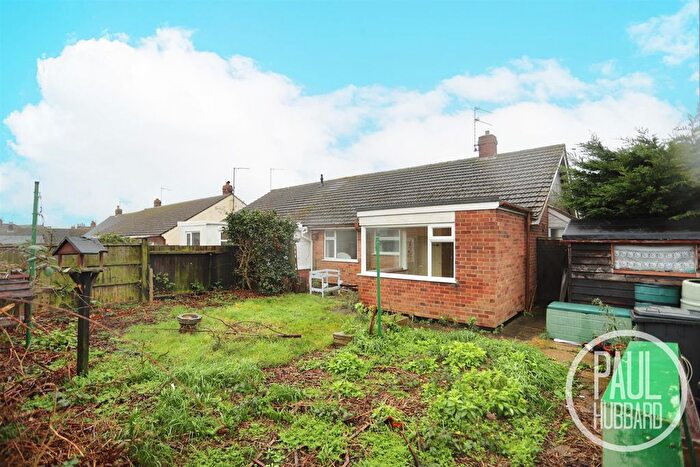
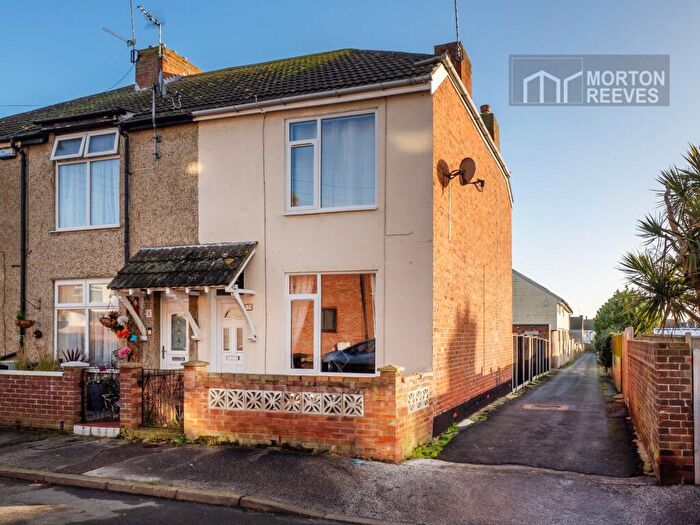
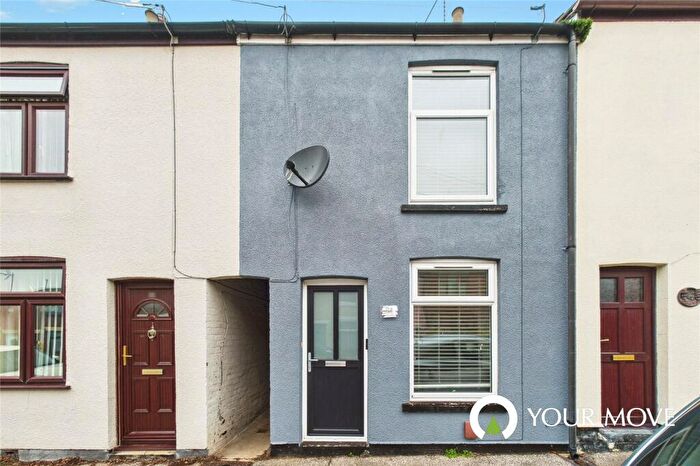
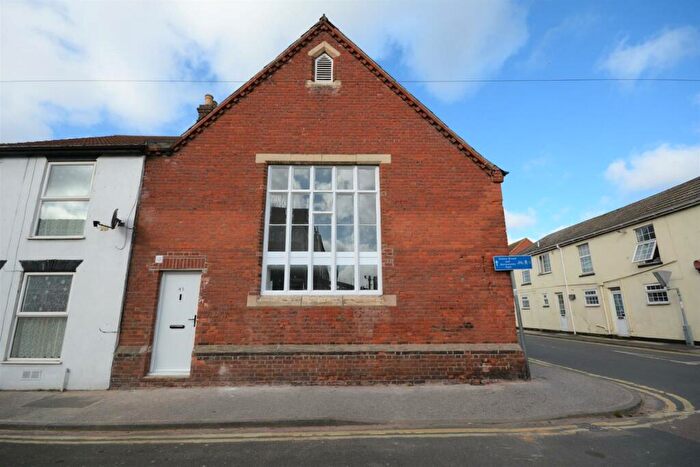
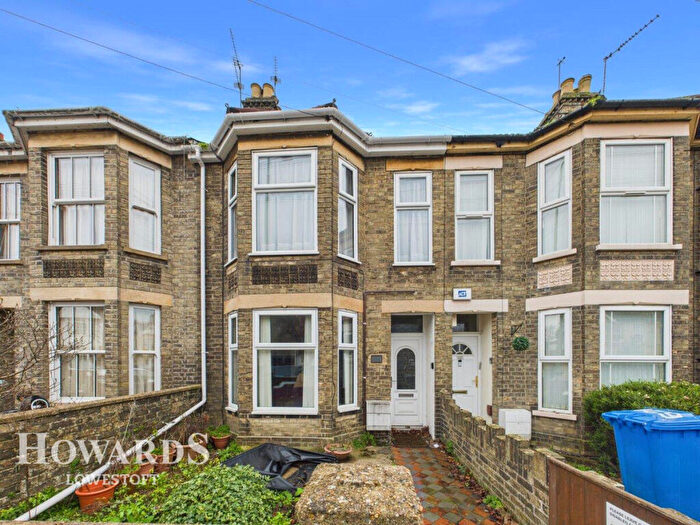
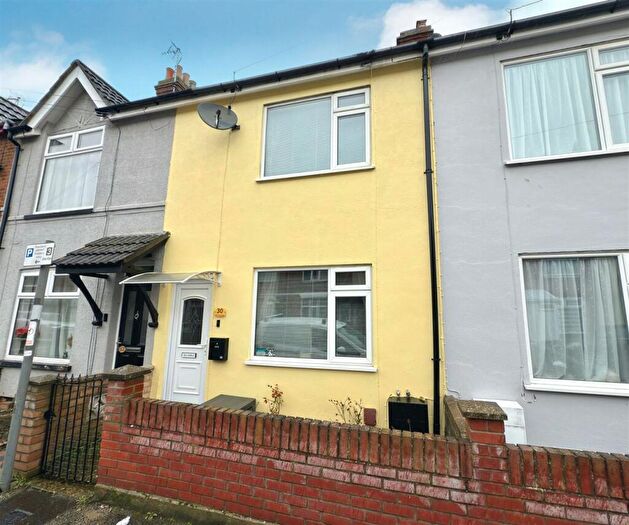
Houses for sale & to rent in Kirkley, Lowestoft
House Prices in Kirkley
Properties in Kirkley have an average house price of £187,447.00 and had 293 Property Transactions within the last 3 years¹.
Kirkley is an area in Lowestoft, Suffolk with 3,008 households², where the most expensive property was sold for £450,000.00.
Properties for sale in Kirkley
Roads and Postcodes in Kirkley
Navigate through our locations to find the location of your next house in Kirkley, Lowestoft for sale or to rent.
| Streets | Postcodes |
|---|---|
| Anchor Street | NR33 0RA |
| Badgerwood Close | NR33 0LP |
| Beaconsfield Road | NR33 0RH NR33 0RJ NR33 0RL |
| Belvedere Road | NR33 0PR |
| Birds Lane | NR33 0NP |
| Bixley Road | NR33 0ER |
| Bruce Street | NR33 0HA |
| Carlton Road | NR33 0LZ NR33 0NA NR33 0NB NR33 0ND NR33 0RP NR33 0RT NR33 0RU NR33 0RX NR33 0RY |
| Claremont Road | NR33 0BS |
| Clement Square | NR33 0LT |
| Cleveland Road | NR33 0BN |
| Clifton Road | NR33 0HF |
| College Road | NR33 0EE |
| Durban Road | NR33 0UH |
| Elizabeth Court | NR33 0DJ |
| Enstone Road | NR33 0NE |
| Florence Terrace | NR33 0PJ |
| Freemantle Road | NR33 0EA |
| Grosvenor Road | NR33 0BW |
| Harold Road | NR33 0EF |
| Hillhouse Gardens | NR33 0BL |
| Horn Hill | NR33 0PX |
| John Street | NR33 0EX NR33 0EY |
| Kensington Road | NR33 0HY |
| Kimberley Road | NR33 0TZ NR33 0UA NR33 0UB NR33 0UE |
| Kirkley Cliff | NR33 0BY |
| Kirkley Cliff Road | NR33 0BF NR33 0DB NR33 0DE NR33 0DF |
| Kirkley Gardens | NR33 7LS NR33 7LT |
| Kirkley Park Road | NR33 0LG NR33 0LQ |
| Kirkley Run | NR33 0NH NR33 0NJ NR33 0NL NR33 0NN NR33 0NW |
| Kirkley Street | NR33 0LU |
| Laurel Road | NR33 0NF NR33 0NG |
| Lawson Road | NR33 0ES NR33 0ET |
| London Road South | NR33 0AS NR33 0AU NR33 0AX NR33 0AZ NR33 0BB NR33 0BE NR33 0BG NR33 0BH NR33 0BJ NR33 0BQ NR33 0DP NR33 0DR NR33 0DS NR33 0DX NR33 0DY NR33 0PD |
| Lorne Park Road | NR33 0RB NR33 0RD |
| Lorne Road | NR33 0RF NR33 0RG |
| Lovewell Road | NR33 0RQ |
| Marine Parade | NR33 0QL NR33 0QN |
| Martins Avenue | NR33 0LX |
| Mill Road | NR33 0PP NR33 0PW |
| Newark Road | NR33 0LY |
| Notley Road | NR33 0UF NR33 0UG |
| Ontario Road | NR33 0EU |
| Orchard Terrace | NR33 0HG NR33 0HQ |
| Pakefield Road | NR33 0HS |
| Payne Street | NR33 0EZ |
| Pier Terrace | NR33 0AB |
| Providence Villas | NR33 0EP |
| Rectory Road | NR33 0AR NR33 0BU NR33 0ED |
| Richmond Place | NR33 0EW |
| Richmond Road | NR33 0EN |
| Salisbury Road | NR33 0HB NR33 0HE |
| Simmetts Cottages | NR33 0PL |
| Southwell Road | NR33 0RN NR33 0RW |
| St Aubyns Road | NR33 0EG |
| St Johns Road | NR33 0PH |
| St Leonards Road | NR33 0EJ NR33 0EL |
| St Peters Road | NR33 0LH NR33 0LJ |
| The Esplanade | NR33 0QG |
| Turners Cottages | NR33 0PN |
| Victoria Terrace | NR33 0QJ |
| Waterloo Road | NR33 0AA |
| Waveney Crescent | NR33 0TX NR33 0TY |
| Waveney Drive | NR33 0TN NR33 0TP NR33 0TR NR33 0TT NR33 0TW |
| Wellington Esplanade | NR33 0QQ |
| Windsor Road | NR33 0BP |
Transport near Kirkley
- FAQ
- Price Paid By Year
- Property Type Price
Frequently asked questions about Kirkley
What is the average price for a property for sale in Kirkley?
The average price for a property for sale in Kirkley is £187,447. This amount is 19% lower than the average price in Lowestoft. There are 1,254 property listings for sale in Kirkley.
What streets have the most expensive properties for sale in Kirkley?
The streets with the most expensive properties for sale in Kirkley are Kirkley Park Road at an average of £425,000, Pakefield Road at an average of £338,750 and Badgerwood Close at an average of £330,000.
What streets have the most affordable properties for sale in Kirkley?
The streets with the most affordable properties for sale in Kirkley are Clifton Road at an average of £109,000, Turners Cottages at an average of £115,000 and Orchard Terrace at an average of £115,285.
Which train stations are available in or near Kirkley?
Some of the train stations available in or near Kirkley are Lowestoft, Oulton Broad North and Oulton Broad South.
Property Price Paid in Kirkley by Year
The average sold property price by year was:
| Year | Average Sold Price | Price Change |
Sold Properties
|
|---|---|---|---|
| 2025 | £198,783 | 6% |
89 Properties |
| 2024 | £187,218 | 5% |
102 Properties |
| 2023 | £177,786 | -14% |
102 Properties |
| 2022 | £202,101 | 5% |
149 Properties |
| 2021 | £192,993 | 13% |
152 Properties |
| 2020 | £167,380 | 5% |
117 Properties |
| 2019 | £159,548 | 6% |
136 Properties |
| 2018 | £149,904 | 2% |
122 Properties |
| 2017 | £147,421 | 7% |
138 Properties |
| 2016 | £137,118 | 3% |
153 Properties |
| 2015 | £133,257 | 7% |
143 Properties |
| 2014 | £123,819 | 14% |
143 Properties |
| 2013 | £106,635 | -3% |
102 Properties |
| 2012 | £109,832 | -15% |
82 Properties |
| 2011 | £126,531 | 5% |
98 Properties |
| 2010 | £119,969 | 7% |
90 Properties |
| 2009 | £112,152 | -13% |
93 Properties |
| 2008 | £126,654 | -7% |
95 Properties |
| 2007 | £135,095 | 12% |
159 Properties |
| 2006 | £118,403 | 10% |
212 Properties |
| 2005 | £107,107 | 0,1% |
162 Properties |
| 2004 | £107,052 | 18% |
196 Properties |
| 2003 | £87,775 | 21% |
210 Properties |
| 2002 | £69,381 | 20% |
224 Properties |
| 2001 | £55,807 | 11% |
199 Properties |
| 2000 | £49,738 | 20% |
177 Properties |
| 1999 | £39,870 | 7% |
205 Properties |
| 1998 | £37,041 | -0,3% |
188 Properties |
| 1997 | £37,156 | 3% |
172 Properties |
| 1996 | £35,979 | -9% |
142 Properties |
| 1995 | £39,372 | - |
115 Properties |
Property Price per Property Type in Kirkley
Here you can find historic sold price data in order to help with your property search.
The average Property Paid Price for specific property types in the last three years are:
| Property Type | Average Sold Price | Sold Properties |
|---|---|---|
| Semi Detached House | £218,571.00 | 73 Semi Detached Houses |
| Detached House | £271,078.00 | 19 Detached Houses |
| Terraced House | £170,112.00 | 177 Terraced Houses |
| Flat | £154,416.00 | 24 Flats |

