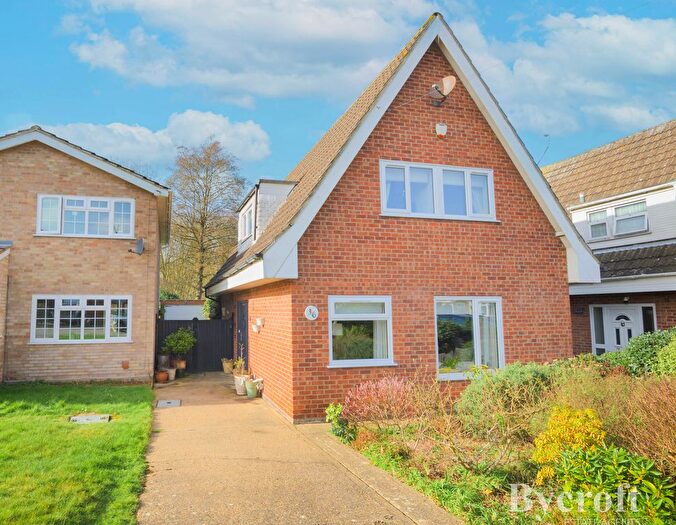
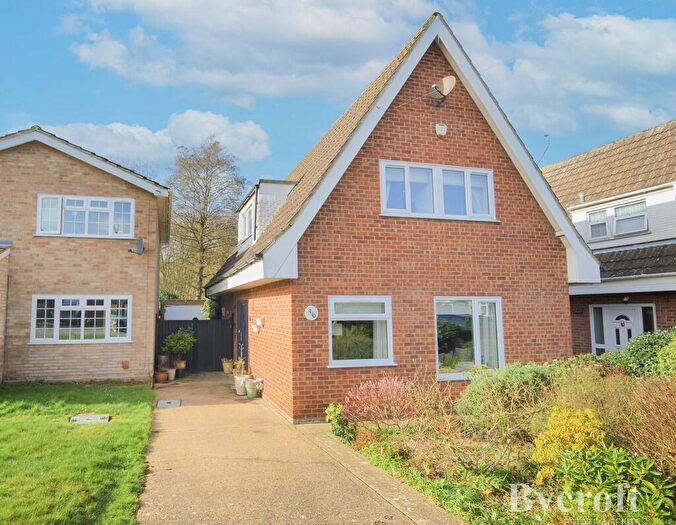
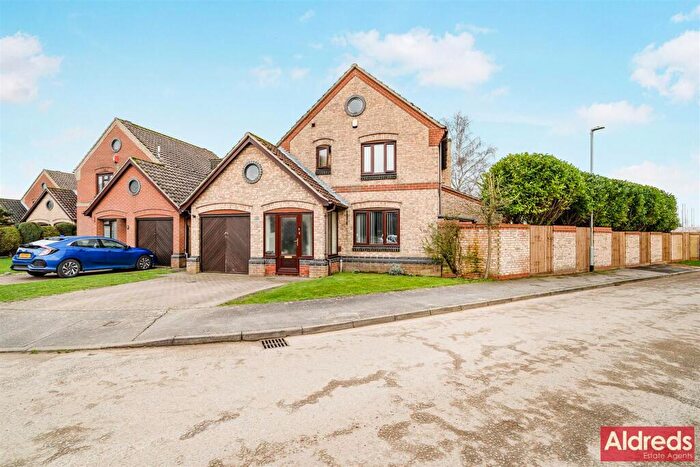
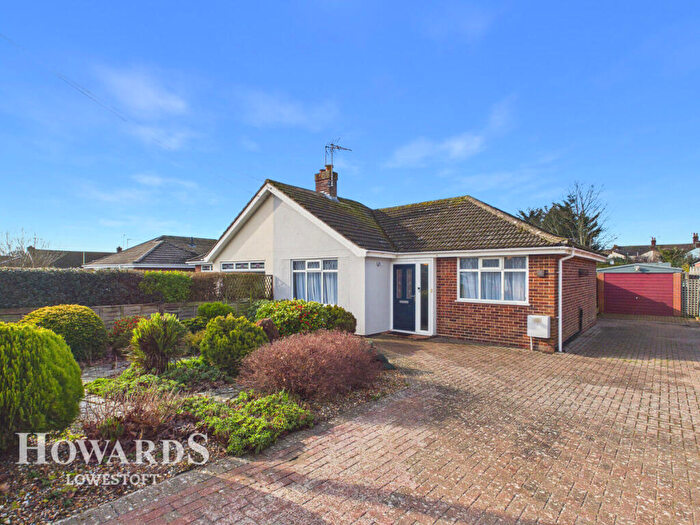
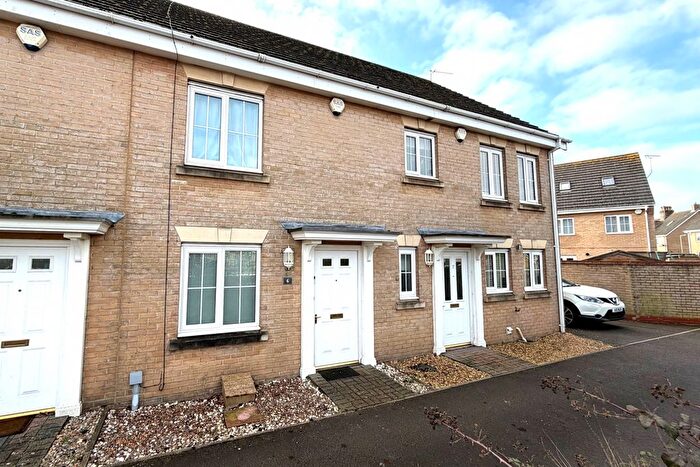
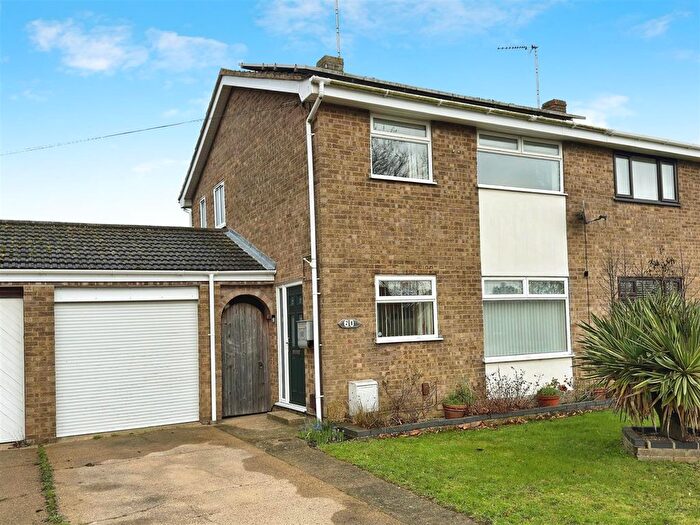
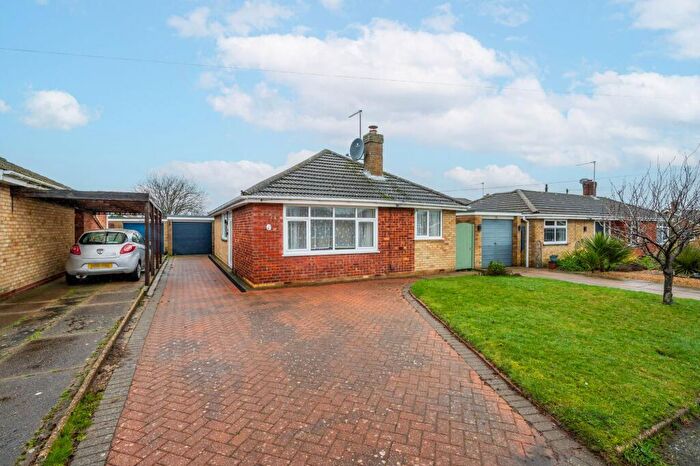
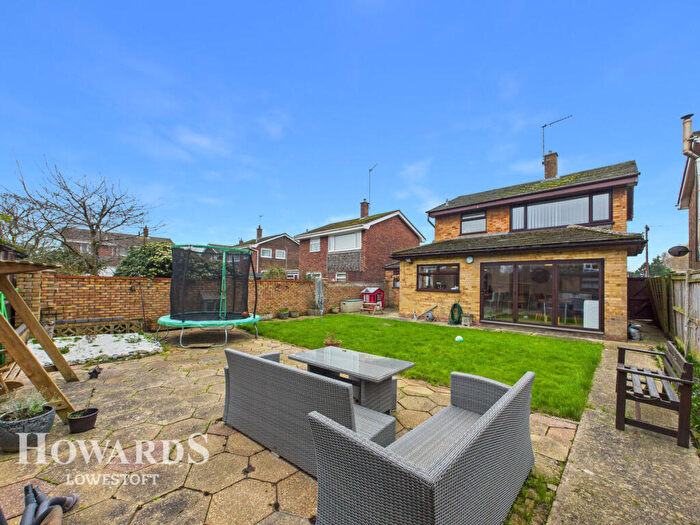
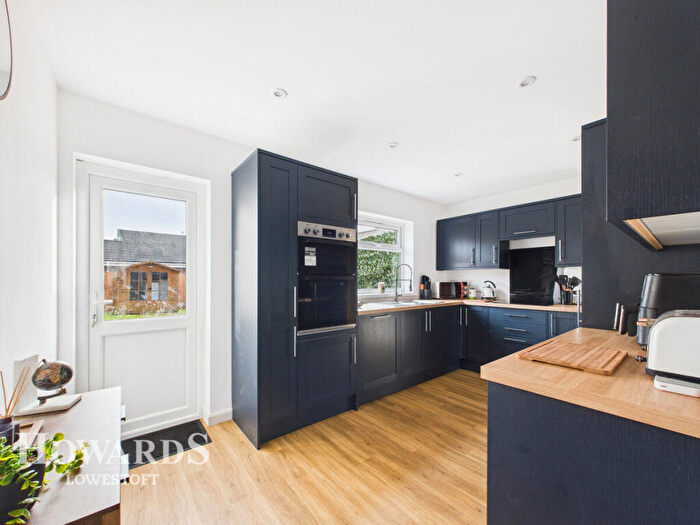
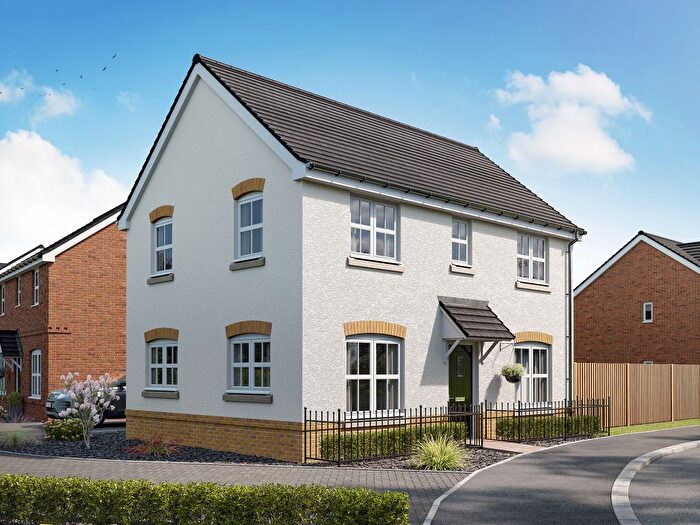
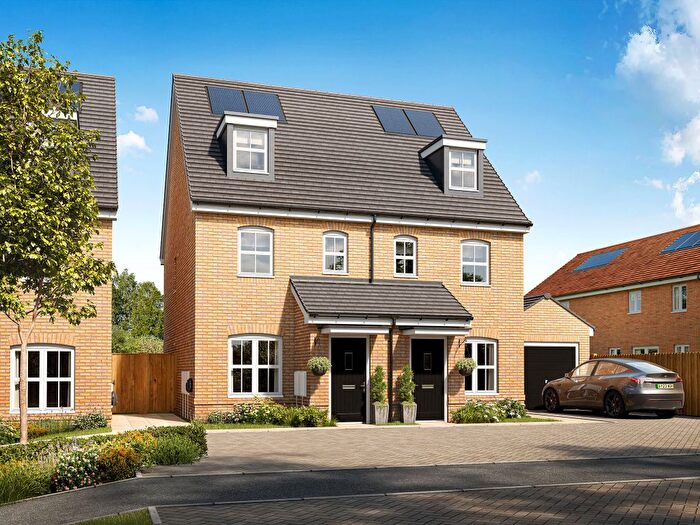
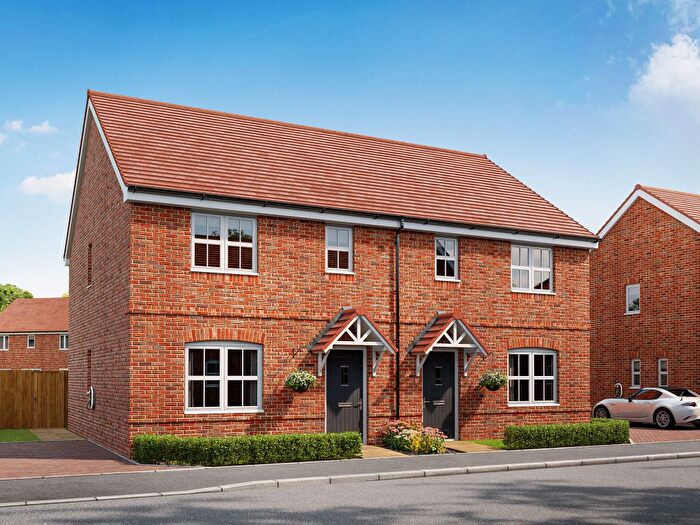
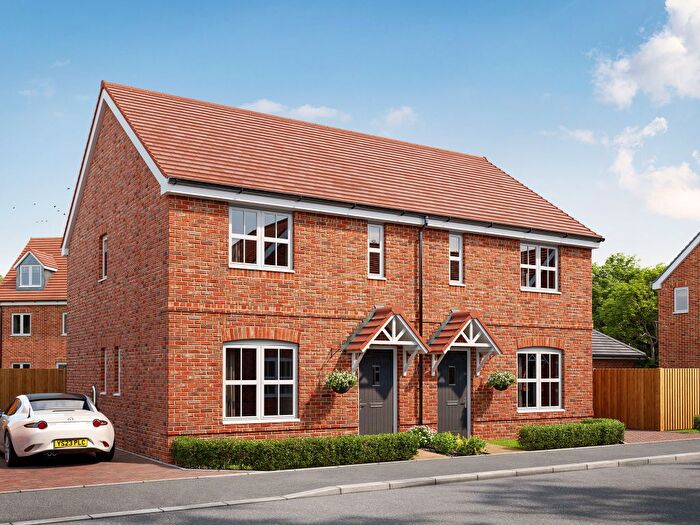
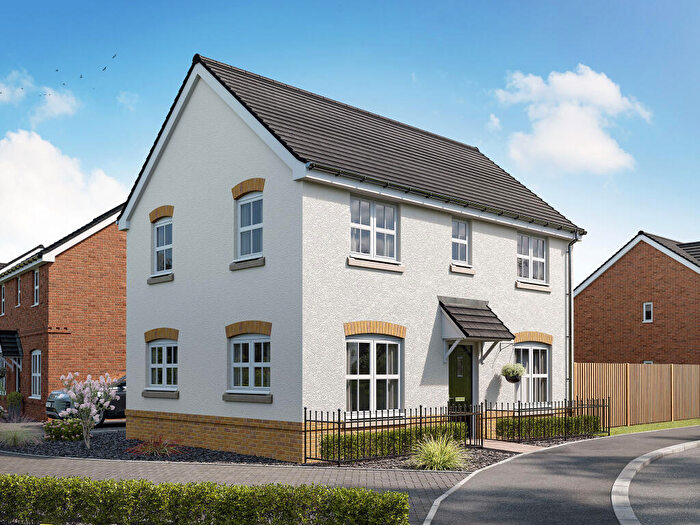
Houses for sale & to rent in Oulton, Lowestoft
House Prices in Oulton
Properties in Oulton have an average house price of £271,944.00 and had 140 Property Transactions within the last 3 years¹.
Oulton is an area in Lowestoft, Suffolk with 1,529 households², where the most expensive property was sold for £660,000.00.
Properties for sale in Oulton
Roads and Postcodes in Oulton
Navigate through our locations to find the location of your next house in Oulton, Lowestoft for sale or to rent.
| Streets | Postcodes |
|---|---|
| Allington Smith Close | NR32 3JW |
| Birch Close | NR32 3QF |
| Blackberry Way | NR32 3HF |
| Brendon Close | NR32 3HL |
| Broad Fleet Close | NR32 3RA |
| Cambrian Crescent | NR32 3HW |
| Chestnut Avenue | NR32 3JB |
| Cheviot Road | NR32 3EN |
| Chiltern Crescent | NR32 3HQ |
| Christmas Lane | NR32 3JX |
| Church Lane | NR32 3JN |
| Church Rise | NR32 3JP |
| Cotswold Way | NR32 3HH |
| Curlew Green | NR32 3JU |
| Desmond Close | NR32 3JY |
| Dunston Drive | NR32 3BZ |
| Edendale | NR32 3JZ |
| Fallowfields | NR32 4WQ NR32 4XN |
| Fen Green Close | NR32 3QW |
| Fern Avenue | NR32 3JF |
| Flixton View | NR32 3GZ |
| Foxglade | NR32 3JJ |
| Gorleston Road | NR32 3AJ |
| Grampian Way | NR32 3EP NR32 3EW |
| Grange Road | NR32 3JD NR32 3JE |
| Green Fleet Drive | NR32 3QN |
| Hall Drive | NR32 3PU |
| Hall Lane | NR32 3AT NR32 5DJ |
| Herons Close | NR32 3LB |
| Hobart Close | NR32 3BH |
| Hobart Way | NR32 3BW |
| Hollowell Close | NR32 3RB |
| Hollydene Close | NR32 3QQ |
| Houghton Drive | NR32 3HR |
| Kempshorne Close | NR32 3JR |
| Kevington Drive | NR32 3JL |
| Lime Avenue | NR32 3QG |
| Longfield Way | NR32 3LD |
| Lothingland Close | NR32 3RH |
| Meadow Road | NR32 3AZ |
| Melrose Close | NR32 4QJ |
| Mendip Road | NR32 3HJ |
| Millbank | NR32 3HG |
| Mobbs Cottages | NR32 5DH |
| Noel Road | NR32 3JS |
| Northfield Close | NR32 3AY |
| Oulton Road North | NR32 4QL NR32 4QZ |
| Oulton Street | NR32 3BA NR32 3BB |
| Parkhill | NR32 3BL NR32 5DQ |
| Pennine Way | NR32 3HD |
| Penny Lane | NR32 3HE |
| Plumtrees | NR32 3JH |
| Prospect Road | NR32 3PT |
| Red House Close | NR32 3BD |
| Sands Lane | NR32 3ER NR32 3ES NR32 3ET NR32 3EU NR32 3EX NR32 3EY NR32 3EZ NR32 3HA NR32 3HB NR32 3HS NR32 3HT NR32 3HU |
| Somerleyton Road | NR32 4RD |
| South Leet Close | NR32 3NG |
| St Michaels Close | NR32 3JT |
| Stayngate Walk | NR32 3BP |
| Stirling Close | NR32 4RA |
| The Glades | NR32 3LG |
| The Trossachs | NR32 3HP |
| The Weald | NR32 3HN |
| Union Lane | NR32 3AX |
| Vallibus Close | NR32 3DS |
| Whiskin Close | NR32 3LA |
Transport near Oulton
- FAQ
- Price Paid By Year
- Property Type Price
Frequently asked questions about Oulton
What is the average price for a property for sale in Oulton?
The average price for a property for sale in Oulton is £271,944. This amount is 17% higher than the average price in Lowestoft. There are 840 property listings for sale in Oulton.
What streets have the most expensive properties for sale in Oulton?
The streets with the most expensive properties for sale in Oulton are Prospect Road at an average of £485,000, Longfield Way at an average of £375,000 and Birch Close at an average of £347,666.
What streets have the most affordable properties for sale in Oulton?
The streets with the most affordable properties for sale in Oulton are Stirling Close at an average of £134,500, Brendon Close at an average of £185,000 and Chestnut Avenue at an average of £195,000.
Which train stations are available in or near Oulton?
Some of the train stations available in or near Oulton are Oulton Broad North, Oulton Broad South and Lowestoft.
Property Price Paid in Oulton by Year
The average sold property price by year was:
| Year | Average Sold Price | Price Change |
Sold Properties
|
|---|---|---|---|
| 2025 | £283,987 | 5% |
40 Properties |
| 2024 | £269,922 | 2% |
54 Properties |
| 2023 | £263,846 | -9% |
46 Properties |
| 2022 | £287,824 | 7% |
41 Properties |
| 2021 | £266,681 | -0,1% |
98 Properties |
| 2020 | £266,953 | 12% |
66 Properties |
| 2019 | £235,857 | 9% |
63 Properties |
| 2018 | £214,062 | 6% |
66 Properties |
| 2017 | £201,331 | 1% |
72 Properties |
| 2016 | £198,836 | 5% |
103 Properties |
| 2015 | £189,172 | 6% |
73 Properties |
| 2014 | £177,103 | -0,5% |
67 Properties |
| 2013 | £177,924 | -3% |
64 Properties |
| 2012 | £183,209 | 8% |
46 Properties |
| 2011 | £167,820 | -1% |
47 Properties |
| 2010 | £169,061 | -1% |
38 Properties |
| 2009 | £169,979 | -8% |
57 Properties |
| 2008 | £183,768 | 6% |
54 Properties |
| 2007 | £173,401 | 5% |
121 Properties |
| 2006 | £164,574 | 7% |
104 Properties |
| 2005 | £153,520 | 6% |
64 Properties |
| 2004 | £144,799 | 8% |
77 Properties |
| 2003 | £133,730 | 20% |
78 Properties |
| 2002 | £106,754 | 22% |
95 Properties |
| 2001 | £83,273 | 10% |
104 Properties |
| 2000 | £75,041 | 12% |
95 Properties |
| 1999 | £66,379 | 10% |
91 Properties |
| 1998 | £59,847 | 5% |
93 Properties |
| 1997 | £57,014 | 1% |
69 Properties |
| 1996 | £56,486 | 2% |
77 Properties |
| 1995 | £55,233 | - |
66 Properties |
Property Price per Property Type in Oulton
Here you can find historic sold price data in order to help with your property search.
The average Property Paid Price for specific property types in the last three years are:
| Property Type | Average Sold Price | Sold Properties |
|---|---|---|
| Semi Detached House | £249,640.00 | 45 Semi Detached Houses |
| Detached House | £304,563.00 | 70 Detached Houses |
| Terraced House | £227,708.00 | 24 Terraced Houses |
| Flat | £54,000.00 | 1 Flat |

