
Houses for sale in Sunderland, Sunderland
House Prices in Sunderland
Properties in Sunderland have an average house price of £143k and had 6,849 Property Transactions within the last 3 years.¹
Sunderland is an area in Sunderland with 76,656 households², where the most expensive property was sold for £1.8M.
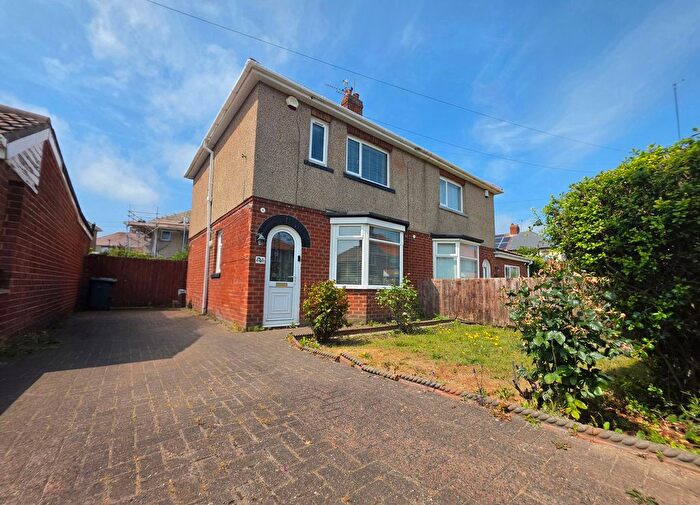
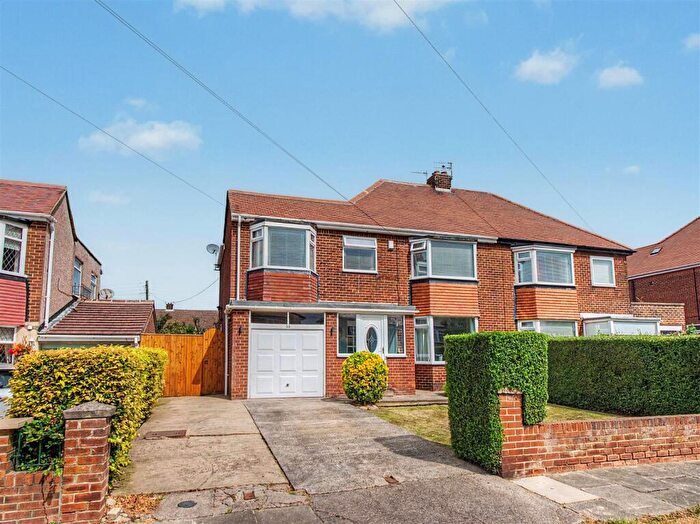
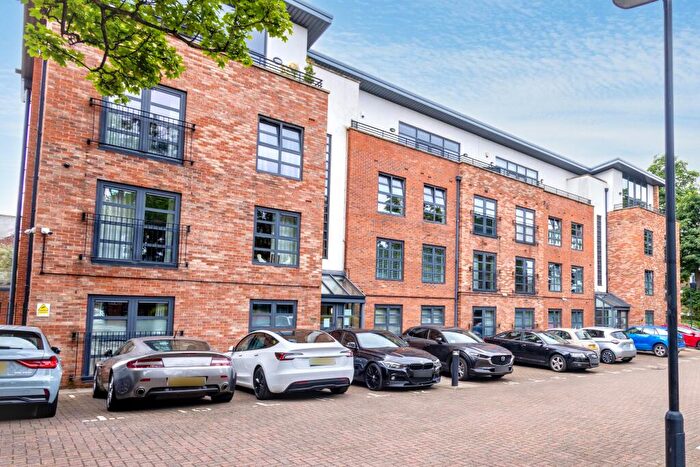
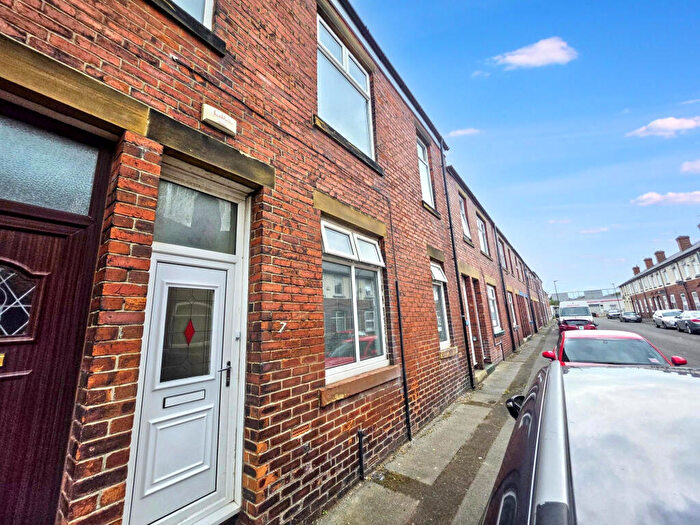
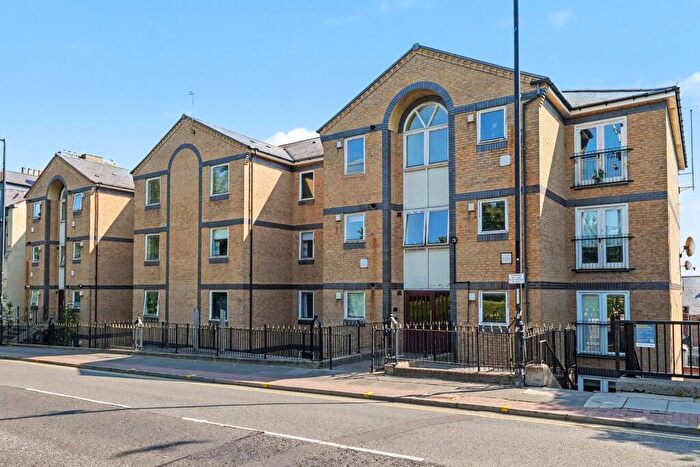
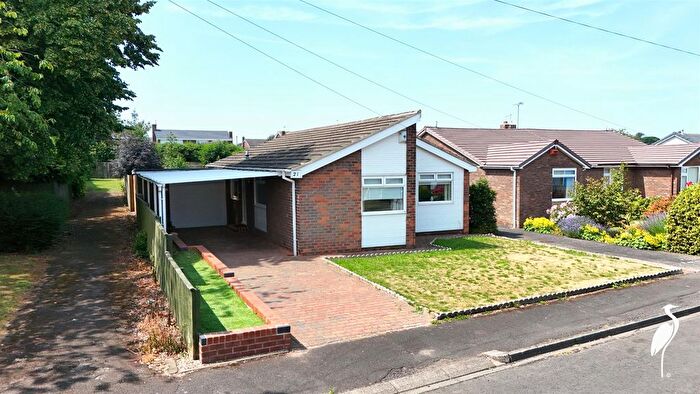
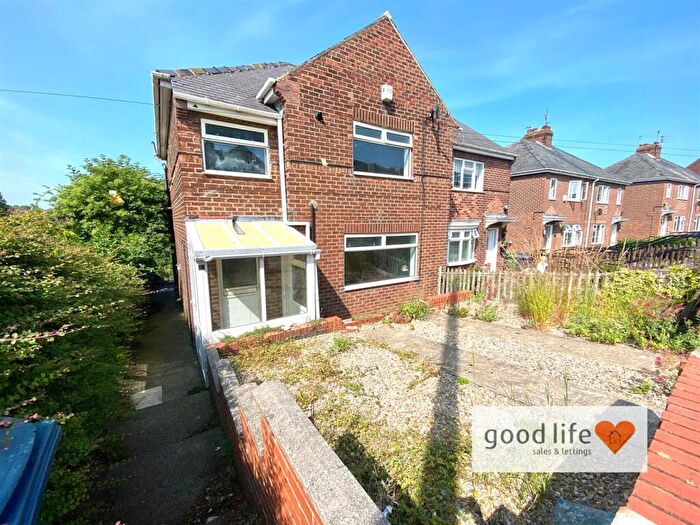
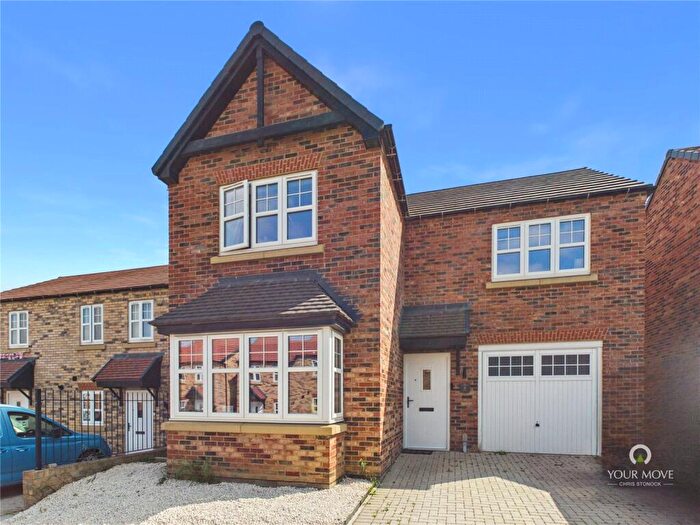
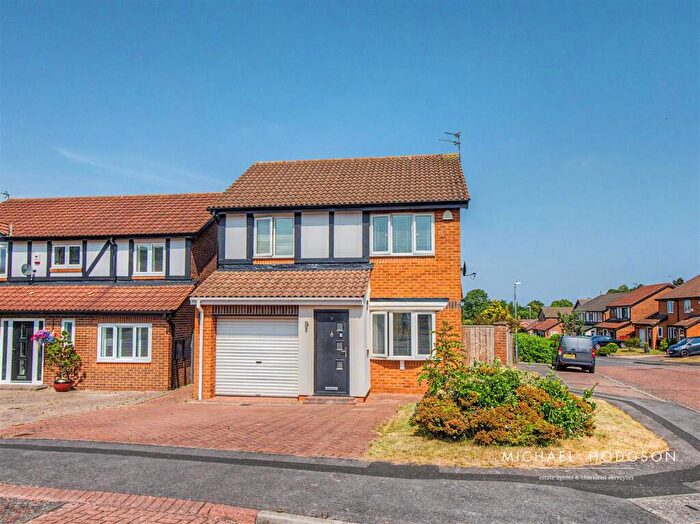
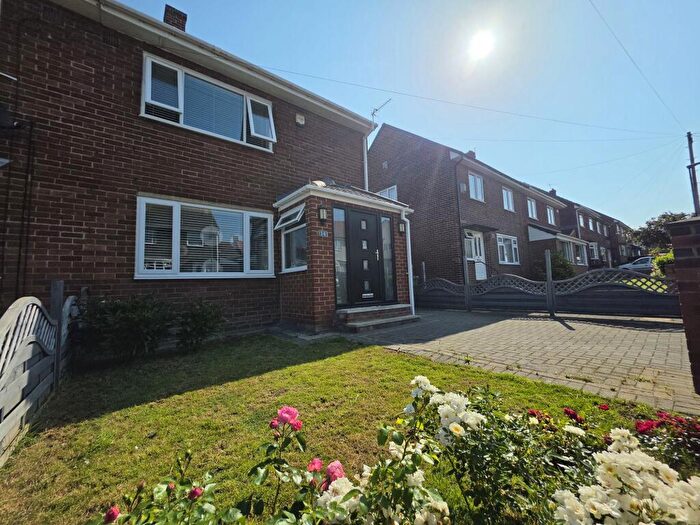
Properties for sale in Sunderland
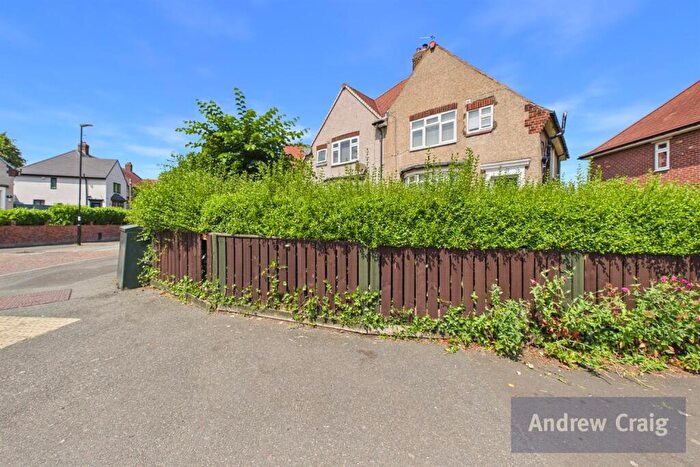
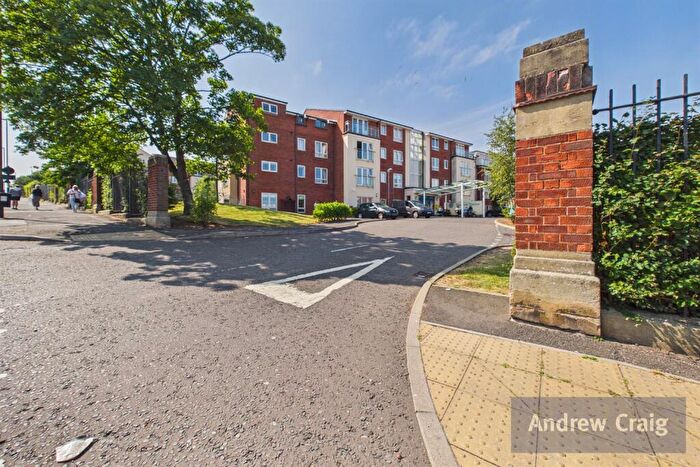
![]()
If you are looking to sell your house, let it out, or receive a property valuation, an expert can help you.
Click the button below to get started.

Neighbourhoods in Sunderland
Navigate through our locations to find the location of your next house in Sunderland, Sunderland for sale or to rent.
Property price trends in Sunderland
According to the latest Land Registry data, the average home in Sunderland sold for £137,508 in 2026. That figure comes from a substantial record of 75,210 sales logged over the past 31 years.
Prices have held fairly steady over the last three years. Compared with 2023, when the typical sale came in around £139,523, values are broadly unchanged.
Looking back five years, average prices are down about 4% since 2021, a drop of around £5,665 in cash terms.
Zoom out to the past decade for the fuller picture. Back in 2016, homes here averaged £122,667, so the typical sold price has climbed about 12.1% since then, roughly 1.1% a year. Stretch the view to fifteen years and that annual pace holds at about 1.1%.
Frequently asked questions about Sunderland
What is the average price for a property for sale in Sunderland?
The average price for a property for sale in Sunderland is £142,804. This amount is 3% lower than the average price in Sunderland. There are more than 10,000 property listings for sale in Sunderland.
What locations have the most expensive properties for sale in Sunderland?
The locations with the most expensive properties for sale in Sunderland are Shiney Row at an average of £474,000, Fulwell at an average of £215,159 and Doxford at an average of £196,686.
What locations have the most affordable properties for sale in Sunderland?
The locations with the most affordable properties for sale in Sunderland are Hendon at an average of £82,379, Redhill at an average of £100,667 and Pallion at an average of £104,282.
Which train stations are available in or near Sunderland?
Some of the train stations available in or near Sunderland are Sunderland, Seaham and Heworth.
Property Price Paid in Sunderland by Year
The average sold property price by year was:
| Year | Average Sold Price | Price Change |
Sold Properties
|
|---|---|---|---|
| 2026 | £137,508 | -9% |
173 Properties |
| 2025 | £150,150 | 7% |
2,071 Properties |
| 2024 | £139,854 | 0,2% |
2,446 Properties |
| 2023 | £139,523 | -6% |
2,159 Properties |
| 2022 | £148,472 | 4% |
2,779 Properties |
| 2021 | £143,173 | 8% |
2,955 Properties |
| 2020 | £131,309 | 2% |
2,243 Properties |
| 2019 | £128,882 | 2% |
2,440 Properties |
| 2018 | £126,699 | 0,5% |
2,286 Properties |
| 2017 | £126,108 | 3% |
2,237 Properties |
Property Price per Property Type in Sunderland
Here you can find historic sold price data in order to help with your property search.
The average Property Paid Price for specific property types in the last three years are:
| Property Type | Average Sold Price | Sold Properties |
|---|---|---|
| Semi Detached House | £160,560.00 | 2,509 Semi Detached Houses |
| Terraced House | £117,267.00 | 3,045 Terraced Houses |
| Detached House | £286,573.00 | 539 Detached Houses |
| Flat | £84,228.00 | 756 Flats |
Transport in Sunderland
Please see below transportation links in this area:
