
Houses for sale & to rent in Shiney Row, Sunderland
House Prices in Shiney Row
Properties in Shiney Row have an average house price of £486k and had 3 Property Transactions within the last 3 years¹.
Shiney Row is an area in Sunderland, Sunderland with 56 households², where the most expensive property was sold for £515k.
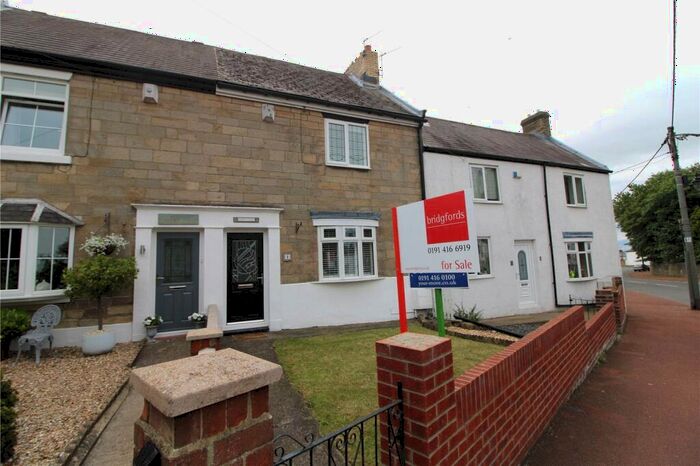
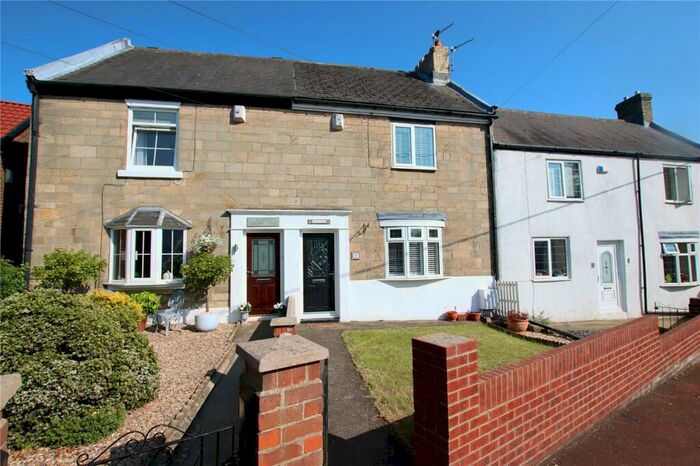
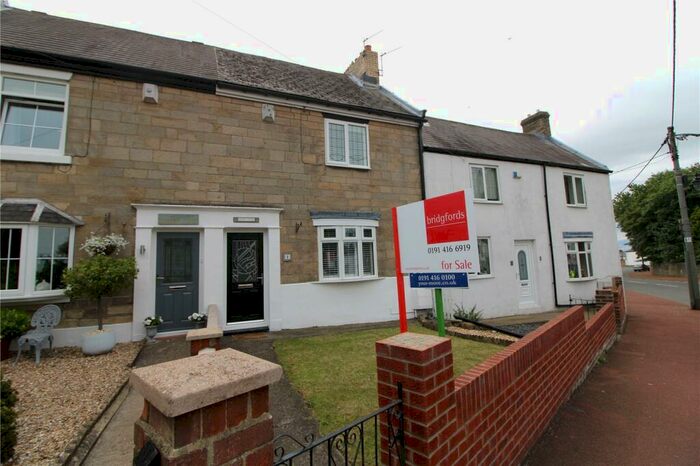
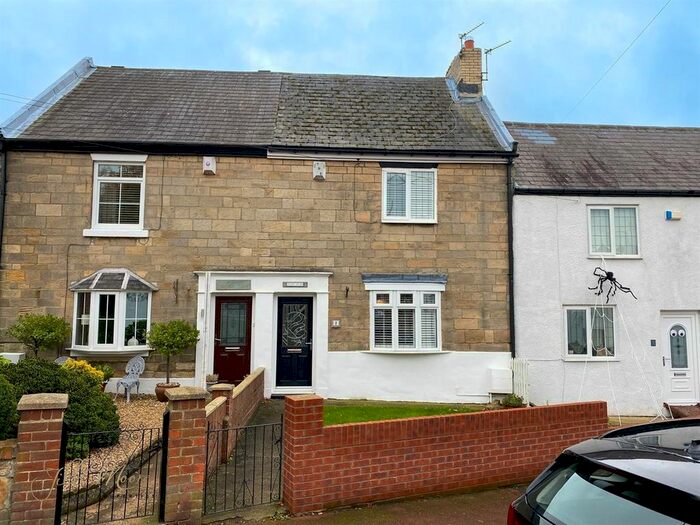
Previously listed properties in Shiney Row
![]()
If you are looking to sell your house, let it out, or receive a property valuation, an expert can help you.
Click the button below to get started.
Roads and Postcodes in Shiney Row
Navigate through our locations to find the location of your next house in Shiney Row, Sunderland for sale or to rent.
| Streets | Postcodes |
|---|---|
| Alice Well Villas | SR4 9JU |
| Chester Road | SR4 9JX SR4 9JY SR4 9JZ |
| Offerton | SR4 9JL SR4 9JN |
| Railway Cottages | SR4 9JR |
| Waterside | SR4 9JS |
| SR4 9JP SR4 9JT |
Transport near Shiney Row
-
 Sunderland Station
 -
Chester-Le-Street Station
-
Heworth Station
-
Seaham Station
-
Manors Station
-
Dunston Station
-
Newcastle Station
-
Durham Station
-
MetroCentre Station
- FAQ
- Price Paid By Year
- Property Type Price
Frequently asked questions about Shiney Row
What is the average price for a property for sale in Shiney Row?
The average price for a property for sale in Shiney Row is £486,000. This amount is 240% higher than the average price in Sunderland. There are 11 property listings for sale in Shiney Row.
Which train stations are available in or near Shiney Row?
Some of the train stations available in or near Shiney Row are Sunderland, Chester-Le-Street and Heworth.
Property Price Paid in Shiney Row by Year
The average sold property price by year was:
| Year | Average Sold Price | Price Change |
Sold Properties
|
|---|---|---|---|
| 2025 | £515,000 | 8% |
1 Property |
| 2024 | £471,500 | 50% |
2 Properties |
| 2022 | £234,875 | -11% |
4 Properties |
| 2021 | £260,000 | -54% |
1 Property |
| 2020 | £400,625 | 28% |
4 Properties |
| 2019 | £289,375 | 8% |
4 Properties |
| 2018 | £264,983 | -29% |
3 Properties |
| 2017 | £341,475 | -4% |
2 Properties |
| 2016 | £356,000 | 17% |
2 Properties |
| 2015 | £295,000 | -9% |
1 Property |
| 2013 | £321,666 | 29% |
3 Properties |
| 2012 | £227,500 | -19% |
2 Properties |
| 2009 | £271,000 | -28% |
2 Properties |
| 2008 | £346,000 | -2% |
3 Properties |
| 2007 | £352,500 | 26% |
2 Properties |
| 2006 | £260,000 | 13% |
1 Property |
| 2003 | £226,500 | 1% |
3 Properties |
| 2002 | £223,300 | 29% |
3 Properties |
| 2001 | £157,666 | 2% |
3 Properties |
| 2000 | £155,000 | 37% |
1 Property |
| 1999 | £97,000 | -9% |
1 Property |
| 1997 | £106,000 | 9% |
1 Property |
| 1996 | £96,750 | - |
4 Properties |
Property Price per Property Type in Shiney Row
Here you can find historic sold price data in order to help with your property search.
The average Property Paid Price for specific property types in the last three years are:
| Property Type | Average Sold Price | Sold Properties |
|---|---|---|
| Detached House | £515,000.00 | 2 Detached Houses |
| Terraced House | £428,000.00 | 1 Terraced House |